
In 2018, we collected data on the timing of flowering in 333 individual plants growing in our naturally occurring prairie remnants: 119 plants at Staffanson Preserve and 214 at others remnants. Flowering began on June 20th – four days earlier than last year. The last date of flowering was on August 9th – the latest bloomer was a roadside plant that had been mowed early in the season but put up another stem later in the season. Peak flowering for the remnants we observed in 2018 was on July 9th, which again was 4 days earlier than 2017. That day there were 257 individuals flowering. The figure below was generated with R package mateable, which was was developed by Team Echinacea to visualize and analyze phenology data. 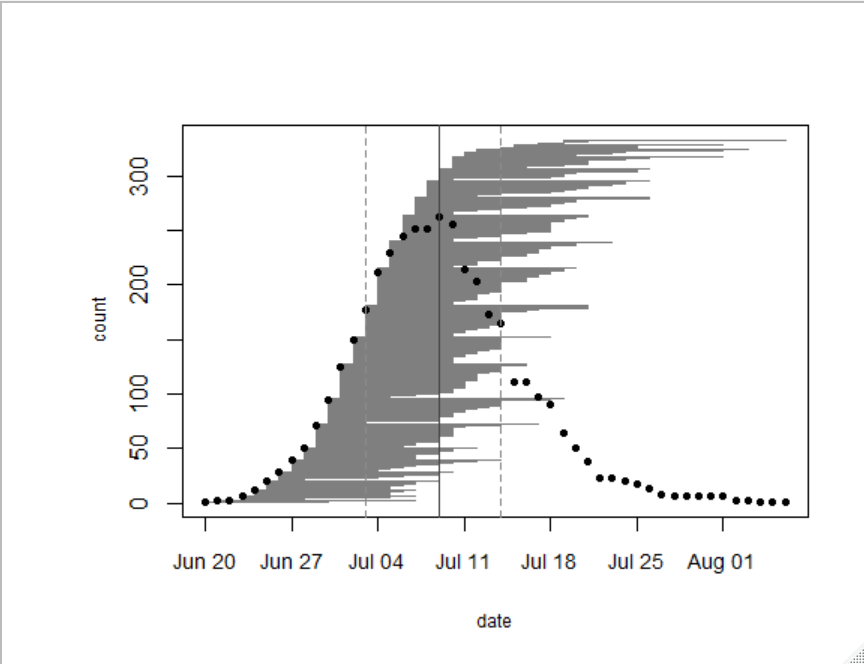
From 2014-2016, determining flowering phenology was a major focus of the summer fieldwork, with Team Echinacea tracking phenology in all plants in all of our remnant populations. Stuart began studying phenology in remnant populations in 1996, but he didn’t know that keeping track of the dates was called “phenology.” In following years, several students & interns also studied phenology in certain populations. The motivation behind this study is to understand how timing of flowering affects the reproductive opportunities and fitness of individuals in natural populations.
Start year: 1996
Location: roadsides, railroad rights of way, and nature preserves in and near Solem Township, MN
Overlaps with: Phenology in experimental plots, demography in the remnants, reproductive fitness in remnants
Physical specimens:
- Amy Waananen harvested some heads in fall 2018 and is germinating seeds right now at the U of MN. She is keeping track of which plant (mom) each seedling came from. She aims to use DNA fingerprinting techniques to identify the pollen donor (dad) of each seedling to get a sense of how far pollen moves in fragmented prairie habitat.
Data collected: We identify each plant with a numbered tag affixed to the base and give each head a colored twist tie, so that each head has a unique tag/twist-tie combination, or “head ID”, under which we store all phenology data. We monitor the flowering status of all flowering plants in the remnants, visiting at least once every three days (usually every two days) until all heads were done flowering to obtain start and end dates of flowering. We managed the data in the R project ‘aiisummer2018′ and will add it to the database of previous years’ remnant phenology records. Ask Amy Waananen for more specific data regarding phenology in the 2017 and 2018 seasons.
GPS points shot: We shot GPS points at all of the plants we monitored. The locations of plants this year will be aligned with previously recorded locations, and each will be given a unique identifier (‘AKA’). We will link this year’s phenology and survey records via the headID to AKA table. Ask Amy Waananen for more specific data regarding phenology in the 2017 and 2018 seasons.
You can find more information about phenology in the remnants and links to previous flog posts regarding this experiment at the background page for the experiment.
Leave a Reply