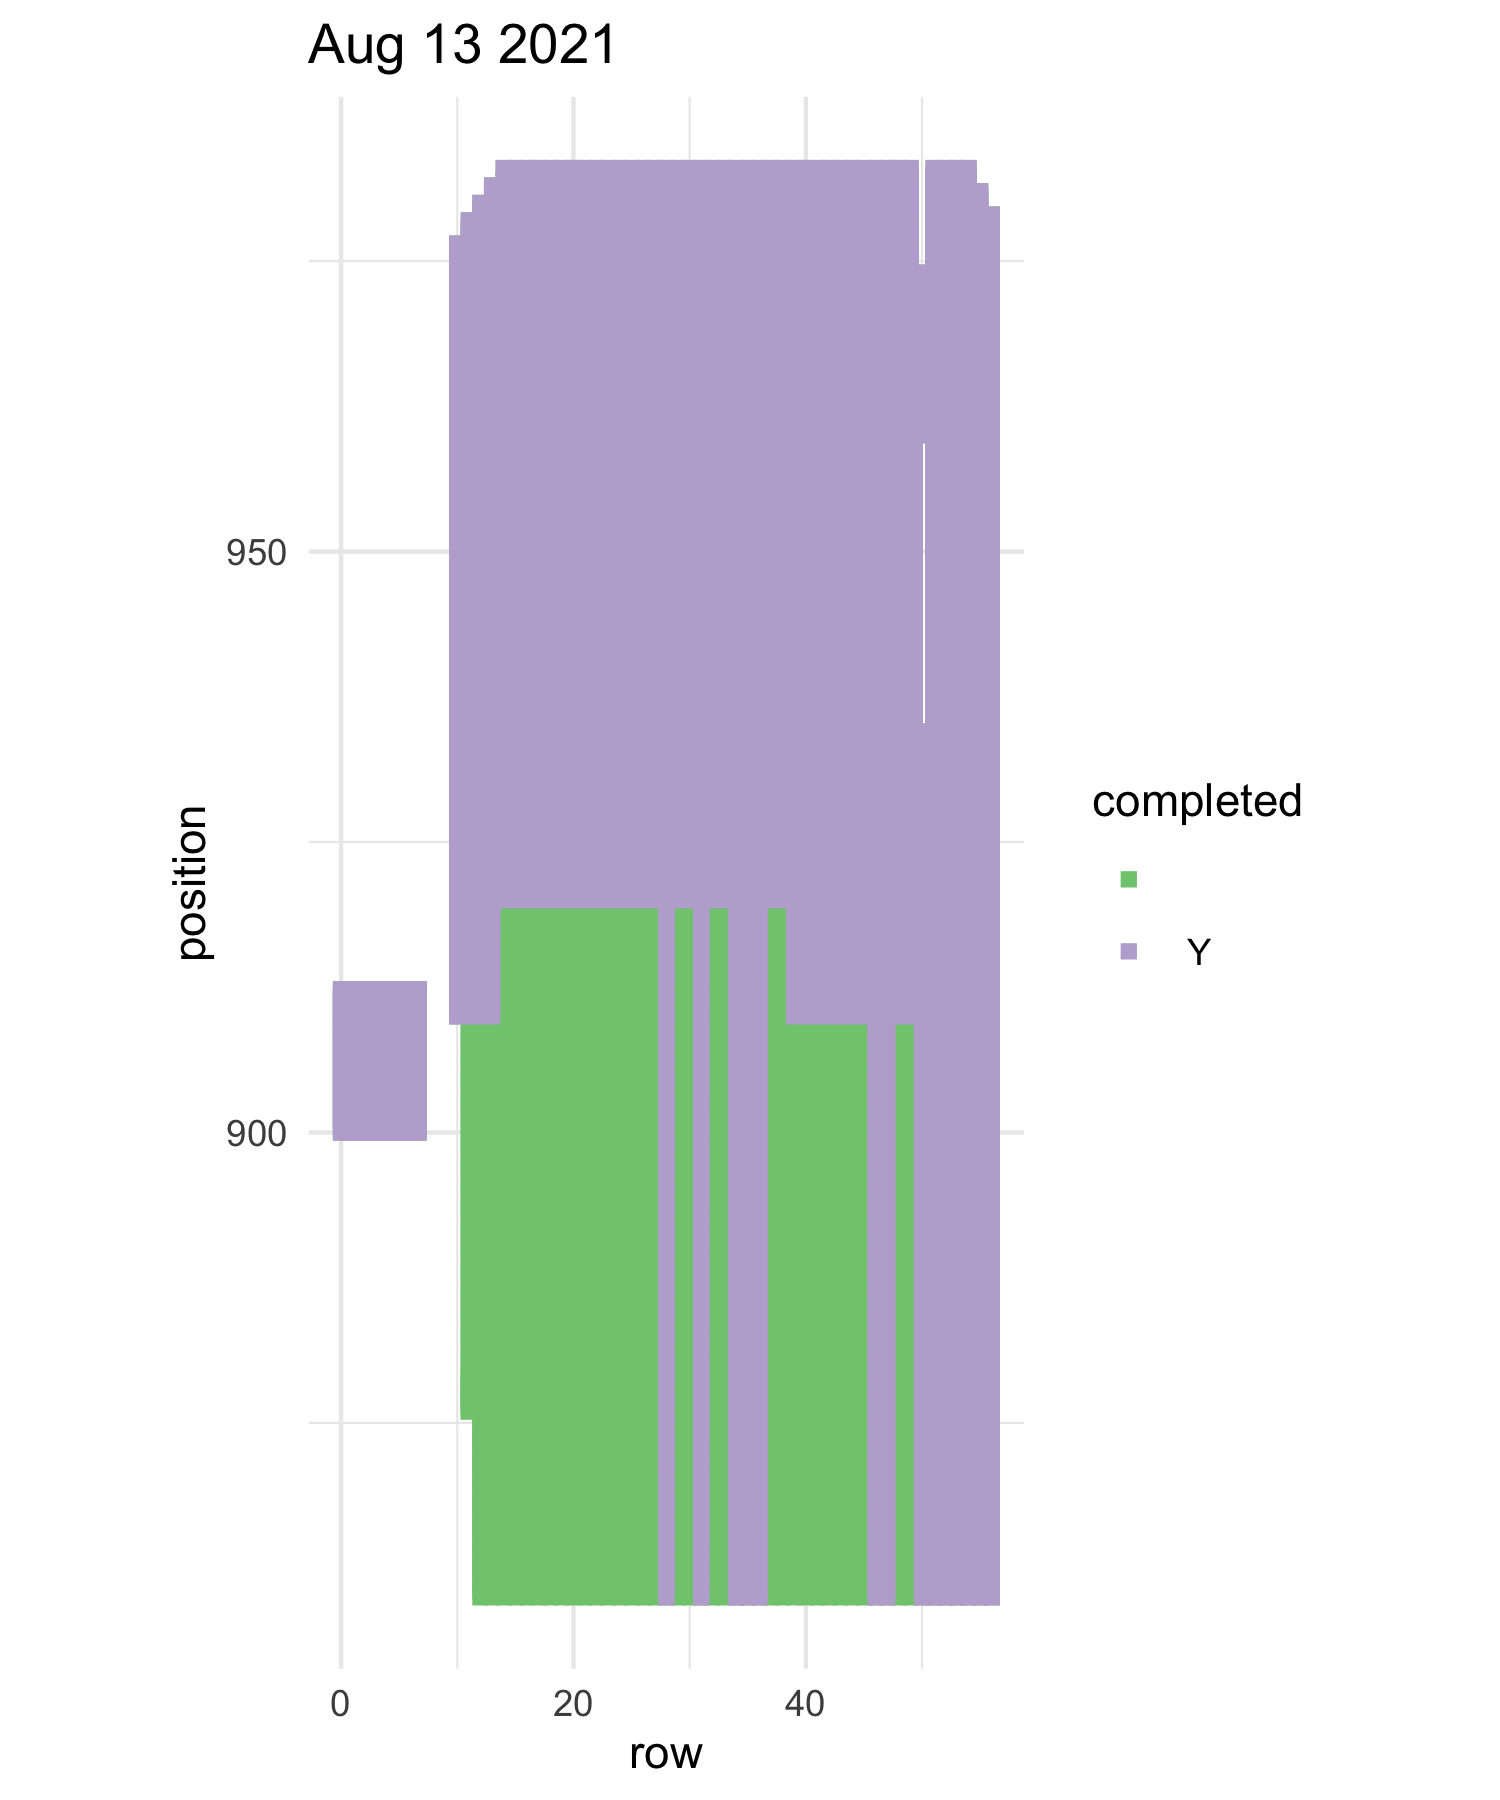
On Friday the team made great progress measuring, with the help of Gretel (World Record holder for fastest measurer) the team completed 16 segments in ~3 hours with 3 measuring pairs. We now have finished the 99’s both north and south and are off in the Q-gen/big batch experiment. We have a total of 33 segments left out of 141 segments so we are 77% complete! This is amazing and I expect that we will be done before the end of the week.
|
||||
|
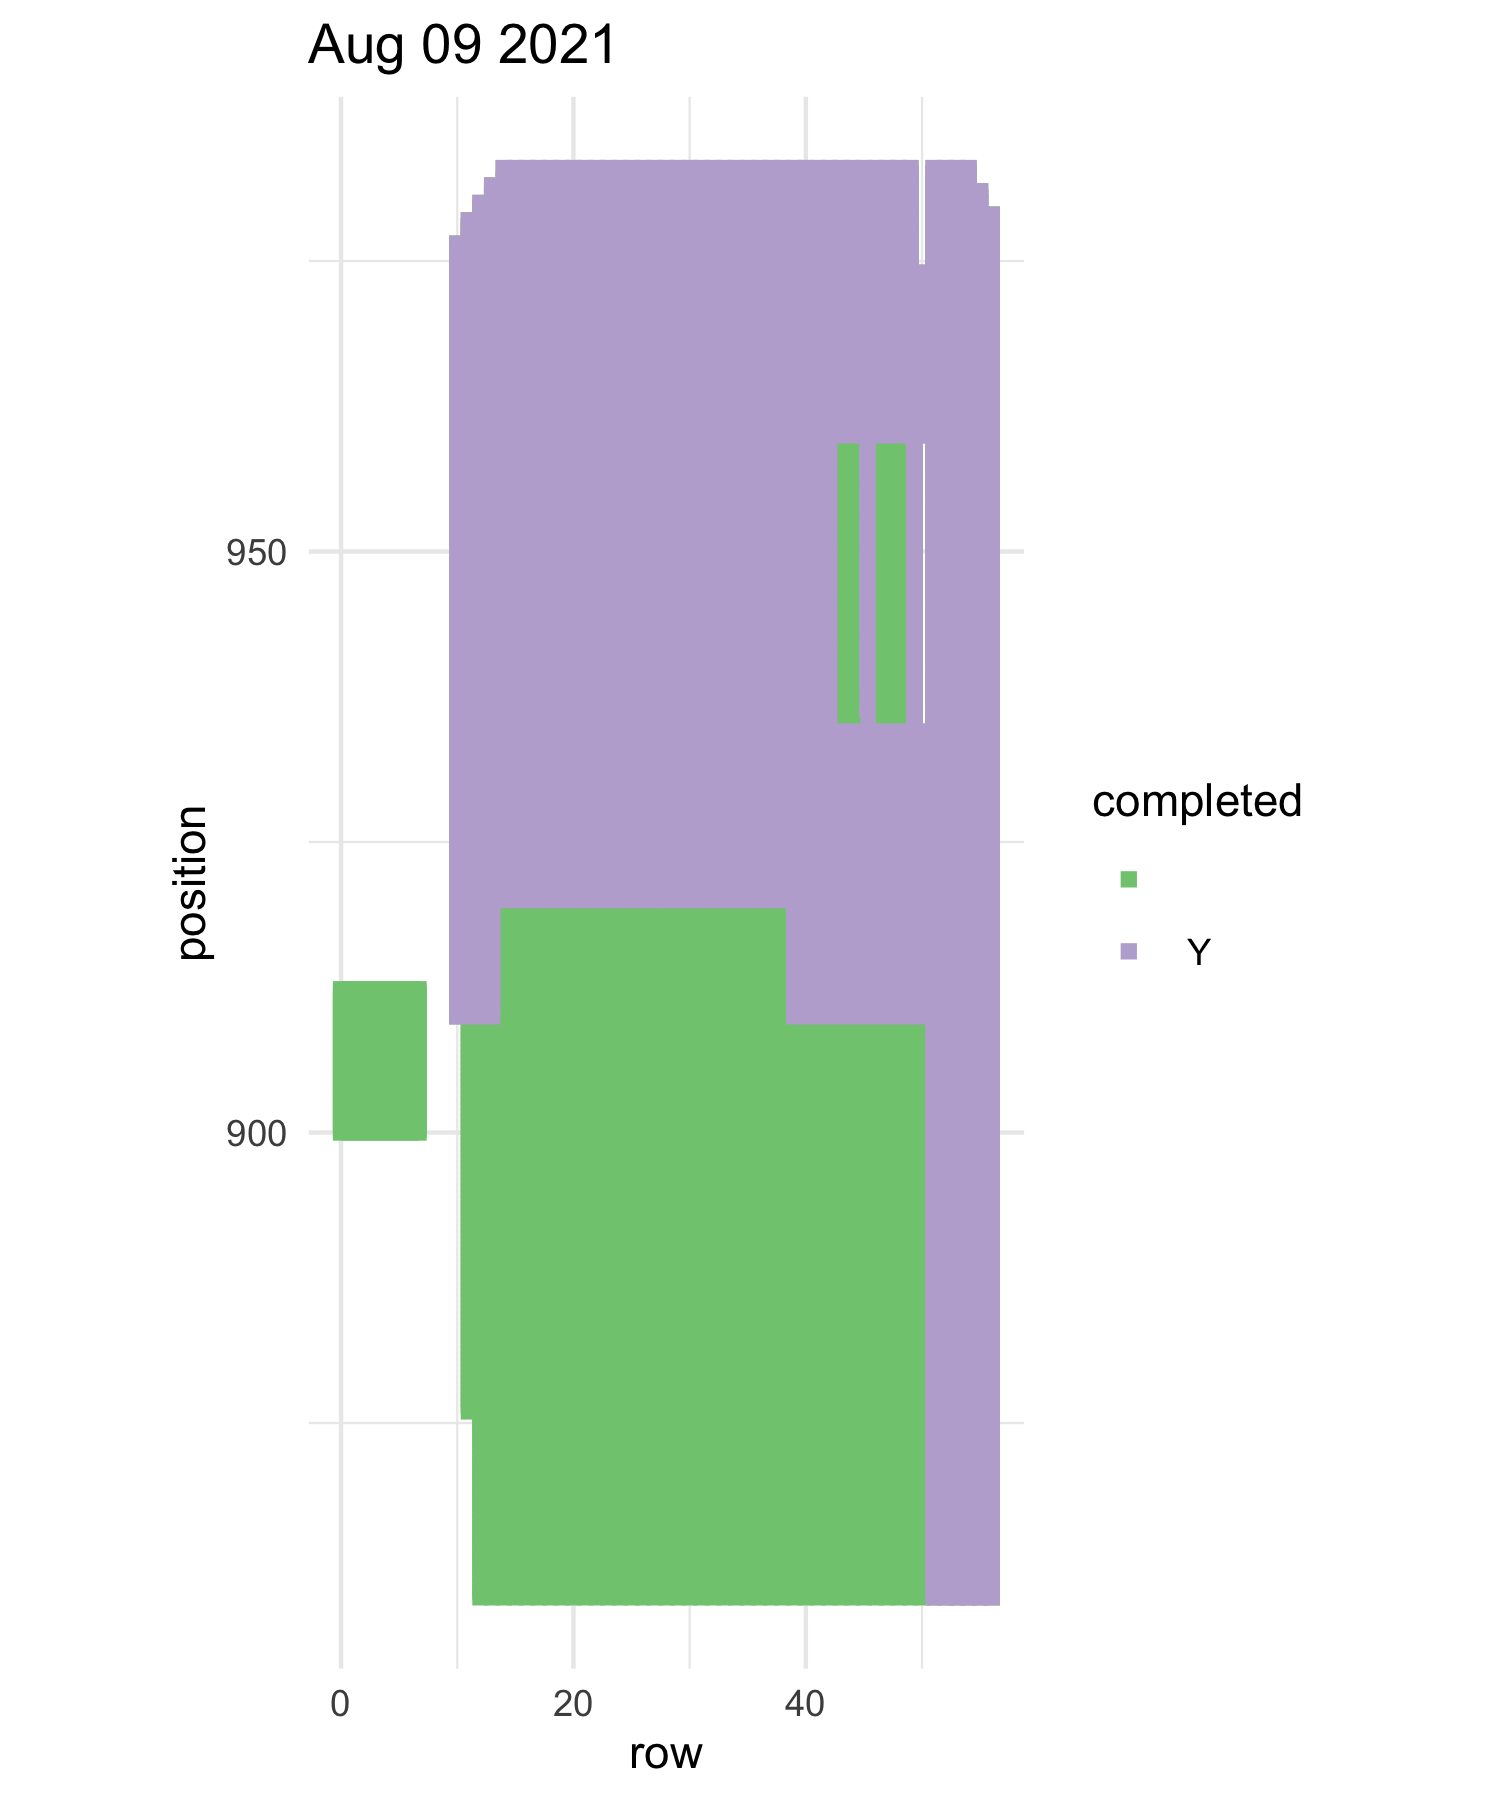
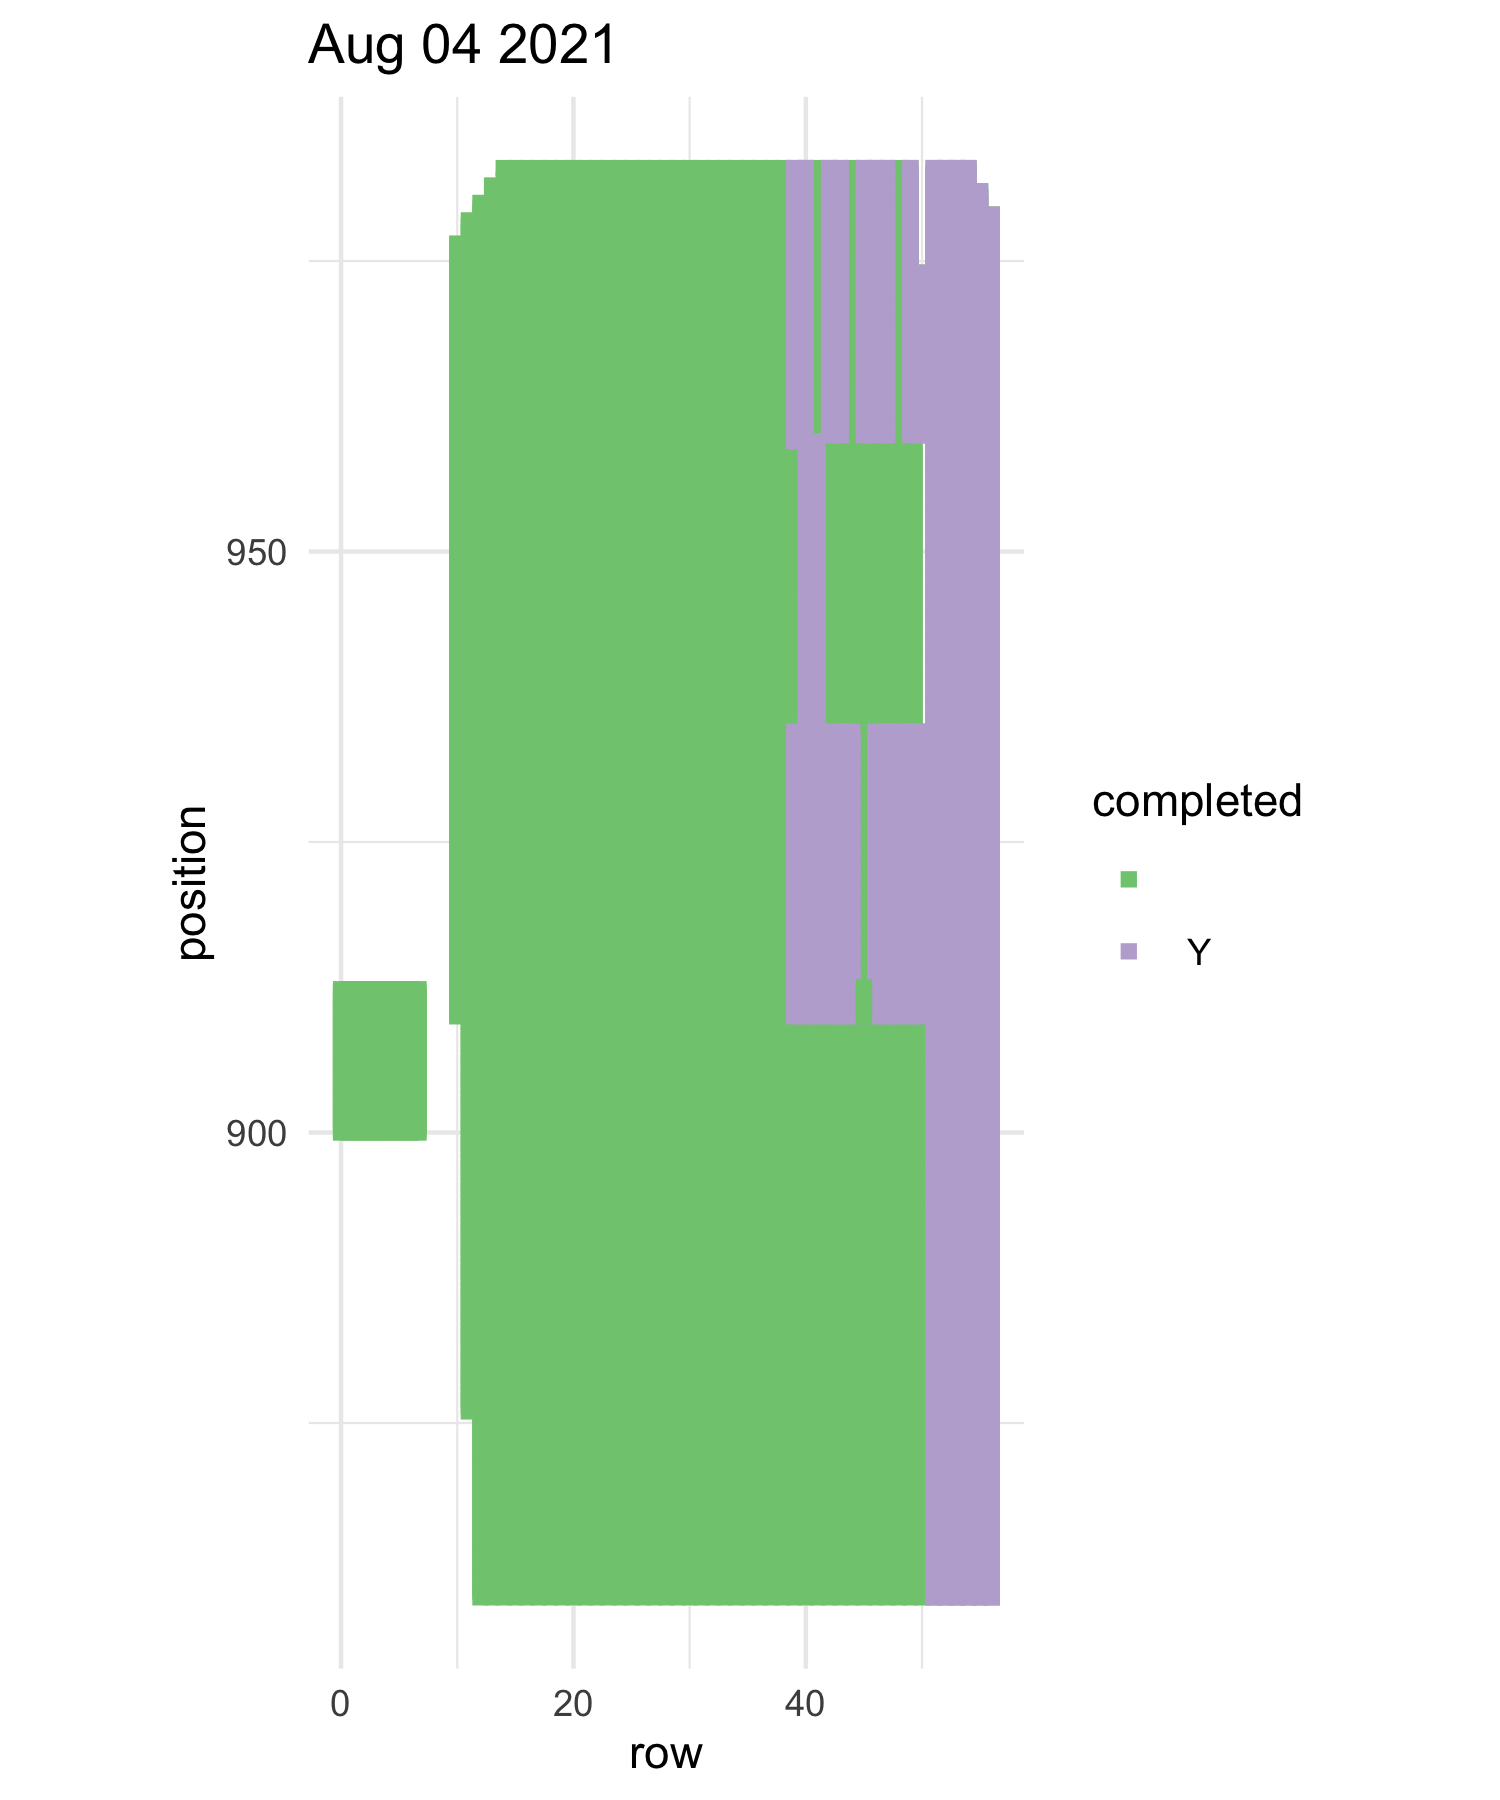
Today the team continued working in the 1999 experiments. The measuring in these experiments feels slow because the plants are so densely packed but we got a good chunk done today. With 3 measuring pairs in ~3 hours we got 12 segments done. The map makes it seem like all of 99north is done but there are actually 3 segments in their that aren’t done. Tomorrow we will finish the 1999 experiment and start Big Batch/Q-Gen which is the big green chunk on the map. This is a combined update from today and Friday. On Friday the team measured 6 segments in ~1.5 hours with 3 measuring pairs in the 96, 97, 98 experiments. Friday also was when Amy W. made her annual measuring guest appearance. Today we measured 11 segments with 3 pairs in ~3 hours. We completed the inbreeding, 96, 97, 98, experiments and started the 99 experiments. Tomorrow we will work on completing the 99 experiments which are a bit dense but we will get through them. Today we continued our efforts in measuring p1. We finished the miscellaneous assortment of experiments (SPP, 2001, and Monica’s 2003) and we started working on the 96, 97, and 98 experiments. We had 4 measuring pairs going and in the course of ~2.5 hours we completed 21 segments. As you can see below we have made a HUGE jump westward. The team has done an amazing job cranking through the plot. Next we will finish the 96, 97, and 98 experiments and keep working west into the inbreeding 1 experiment.
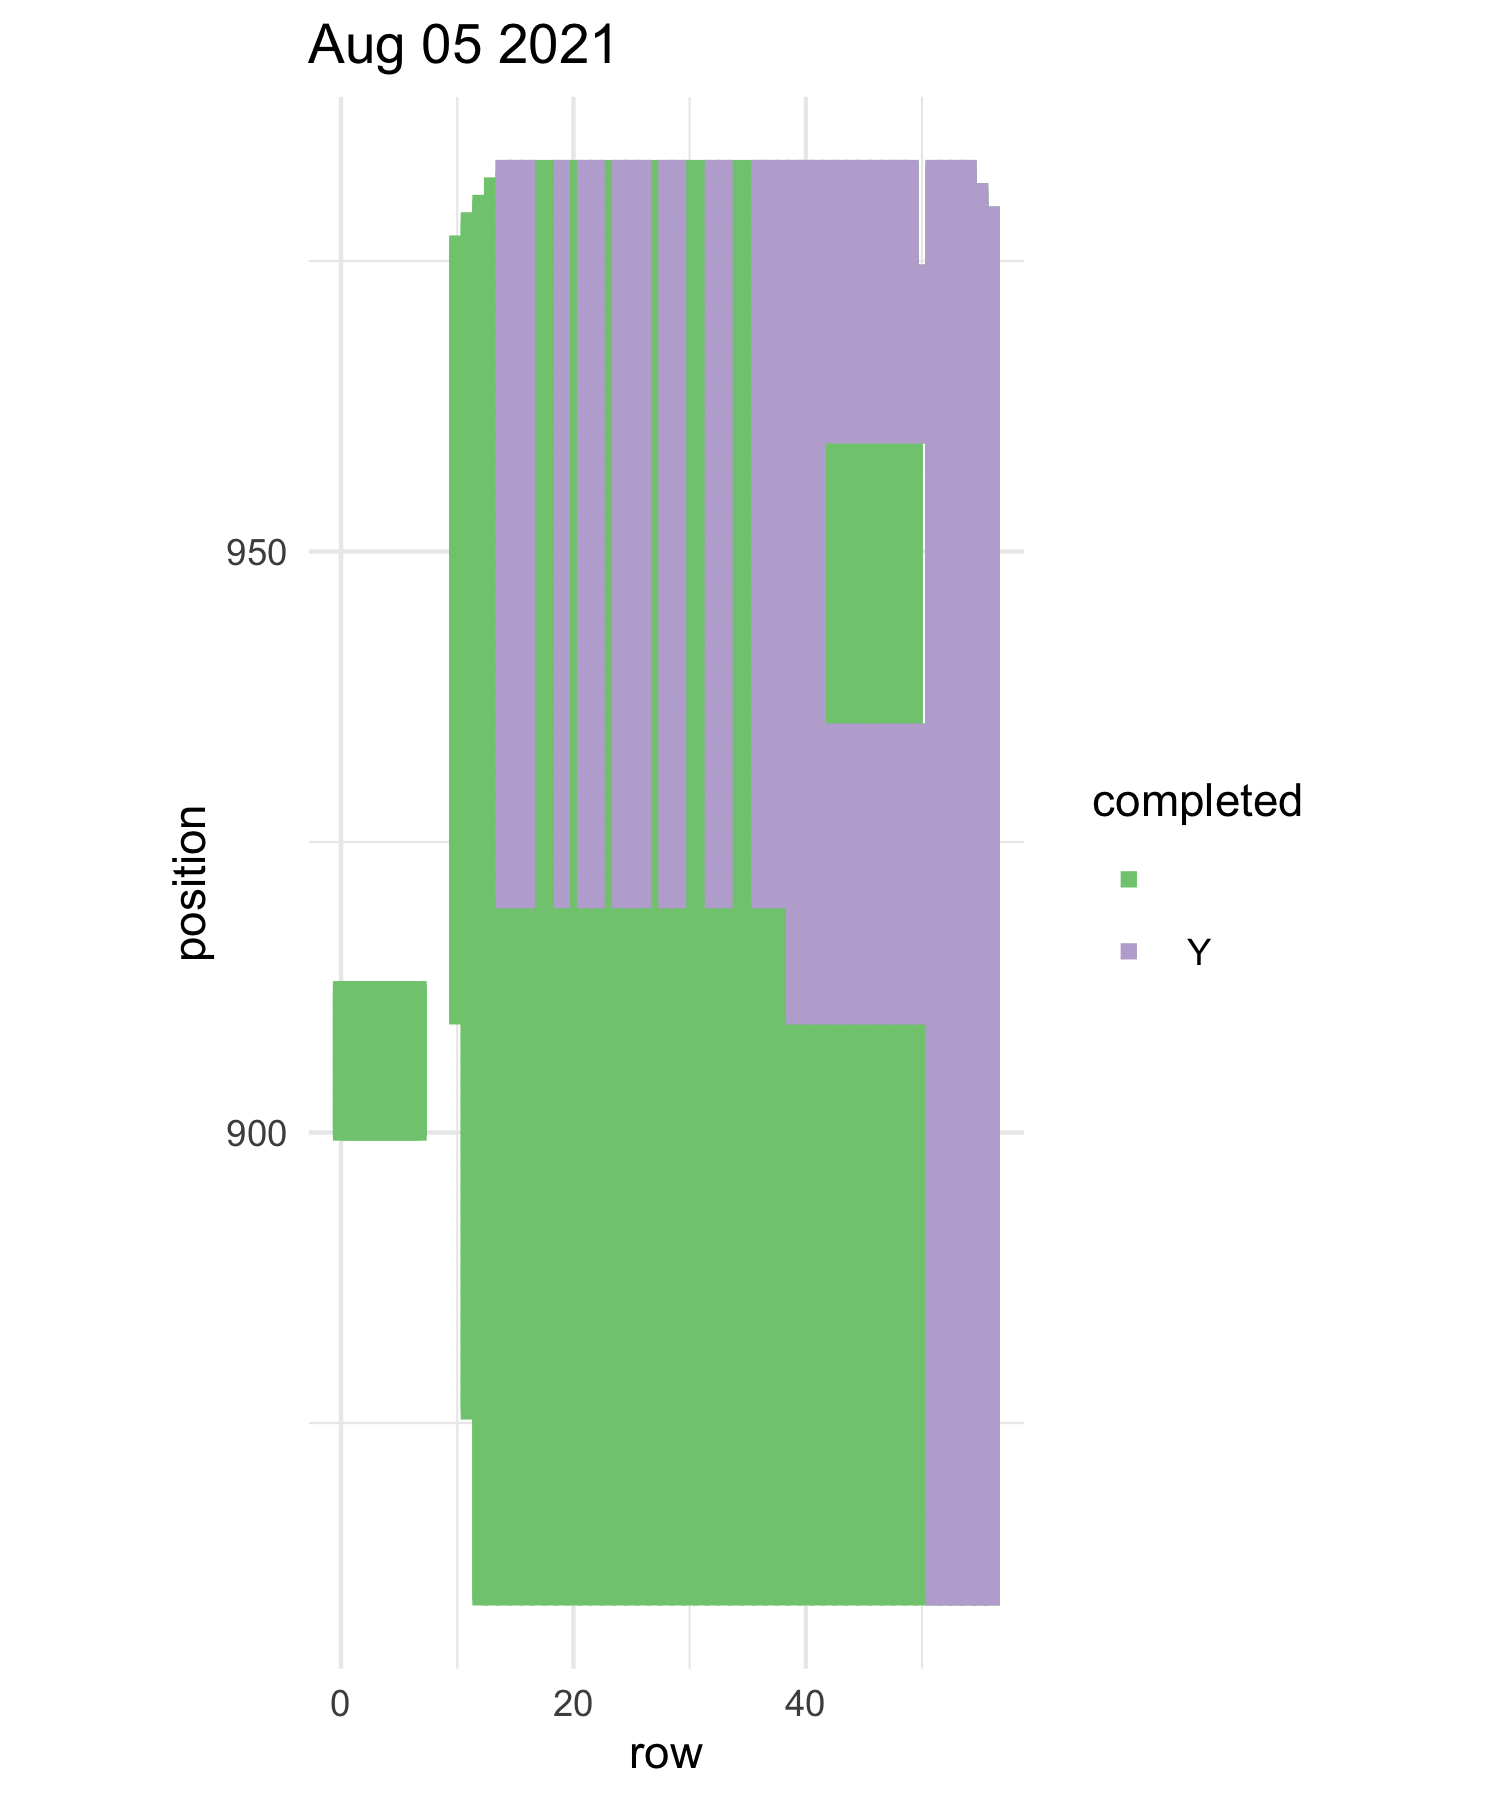
Yesterday we continued our measuring progress we starting working on a miscellaneous assortment of experiments, seeds from Staffonson, and two different 2001 experiments. The team completed 23 total segments with 4 measuring pairs in ~4 hours. This brings the total segments to 41 segments. Below you can see the updated progress map, there has been a big jump in the purple between Aug 03 to Aug 04. The team will continue to work west ward today as we start the 96, 97, 98 experiments.
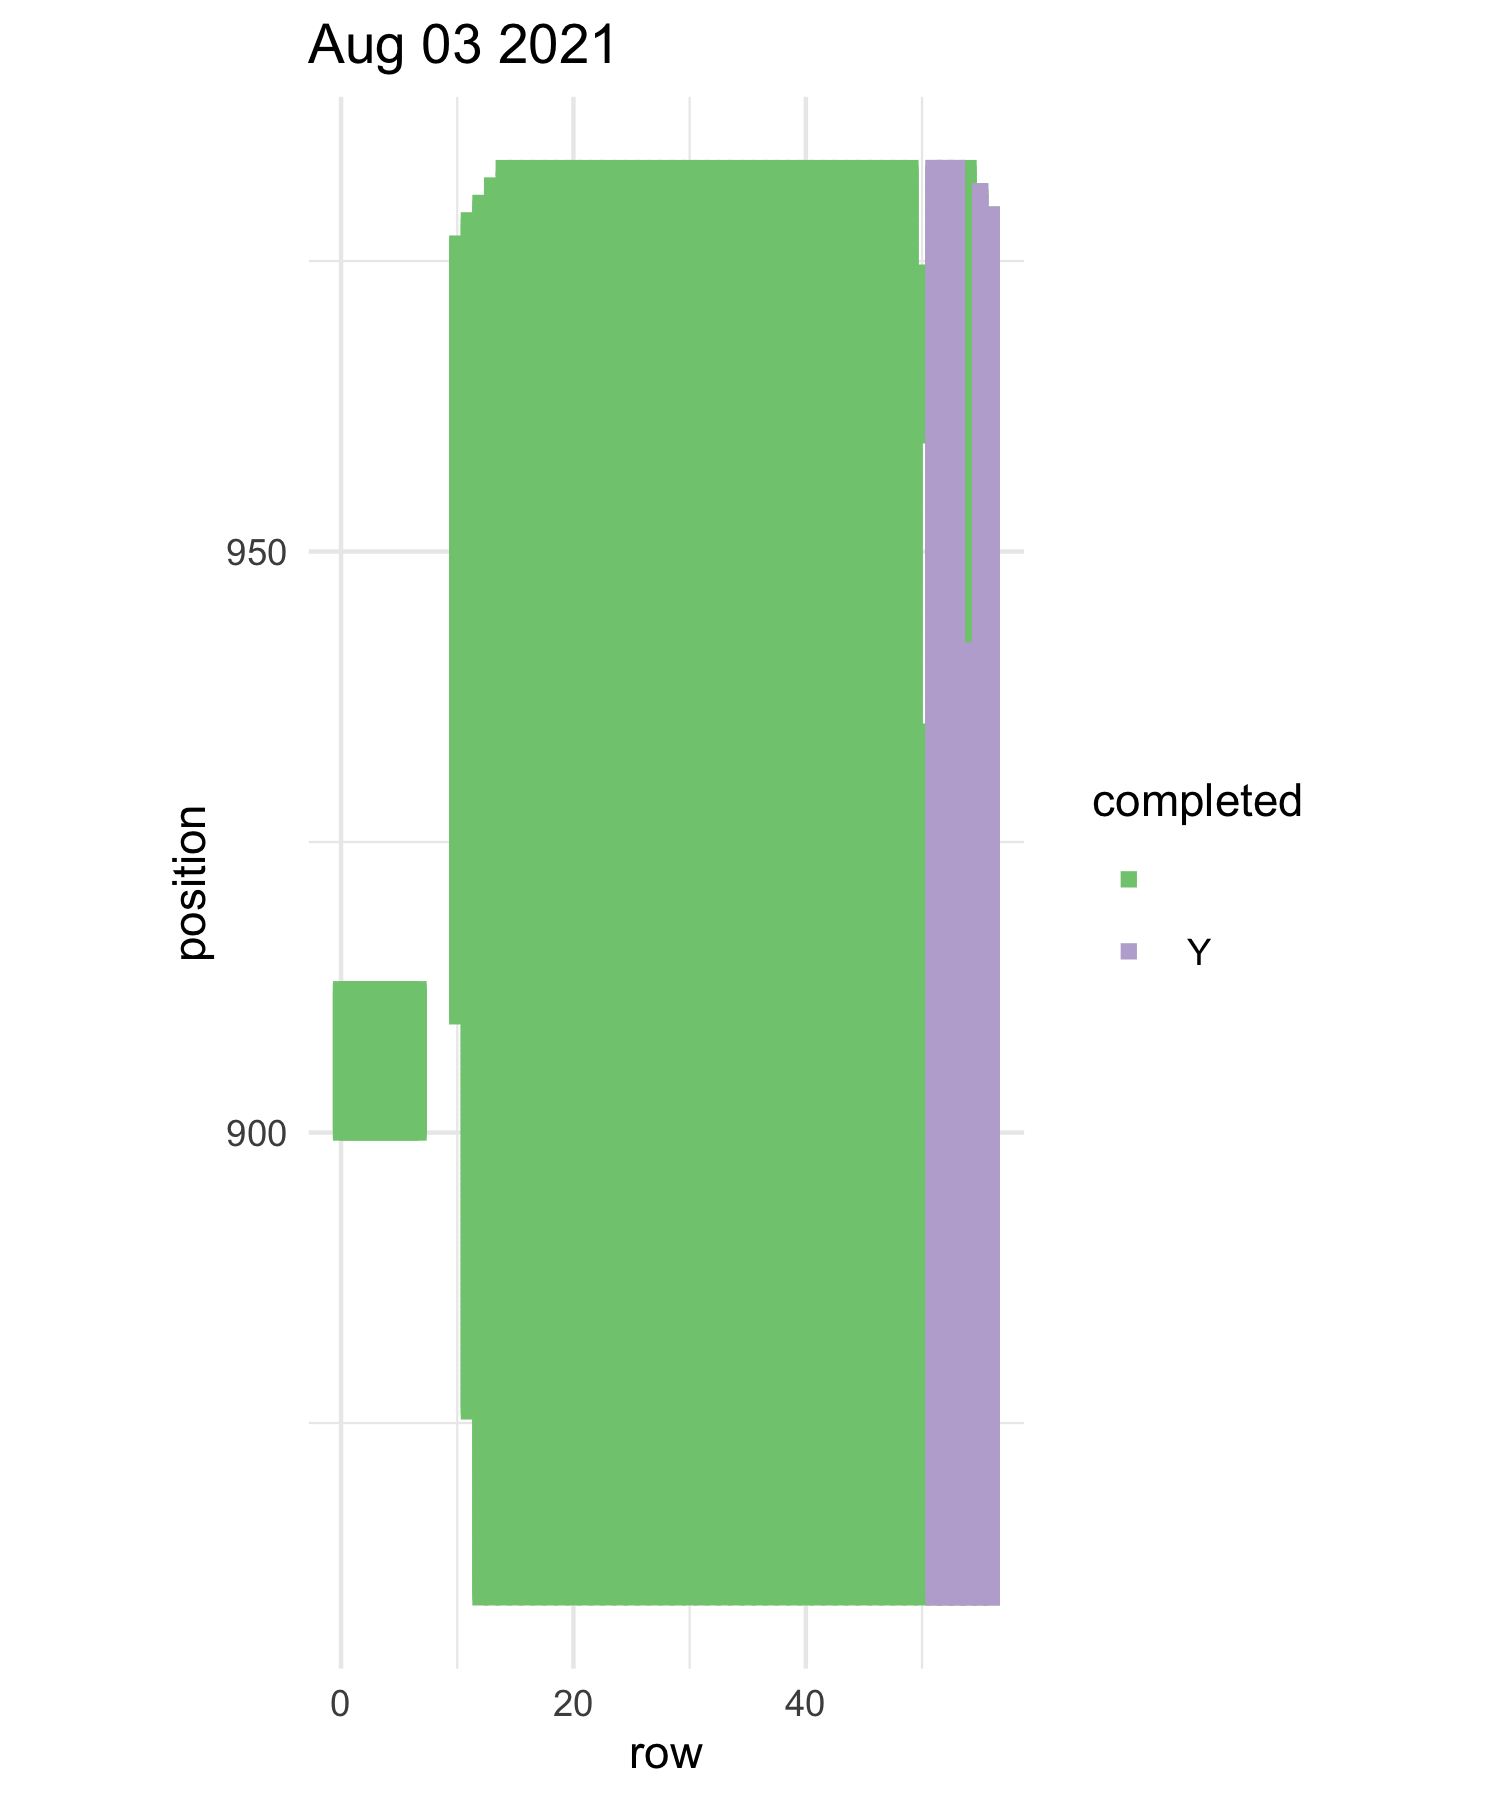
One of the large tasks that the team does every year is measure the first experimental plot (p1). This is the largest of the the experimental plots with a daunting 10,673 total positions. The plot is broken up into 46 rows, some of these rows are so long that we have broken them up into segments. There are 141 total segments. I will be posting daily (or close to daily) updates on our measuring progress right here on the flog. Yesturday (Aug 03 2021) was our first day of measuring p1. We start with one of the inbreeding experiments, the team measured a total of 18 segments over the course of 3 ish hours with 4 measuring pairs. Below I have attached a map of the plot, it is colored with which positions have been measured and what we have yet to do. There is a lot left to do but we have made GREAT progress for just one day!
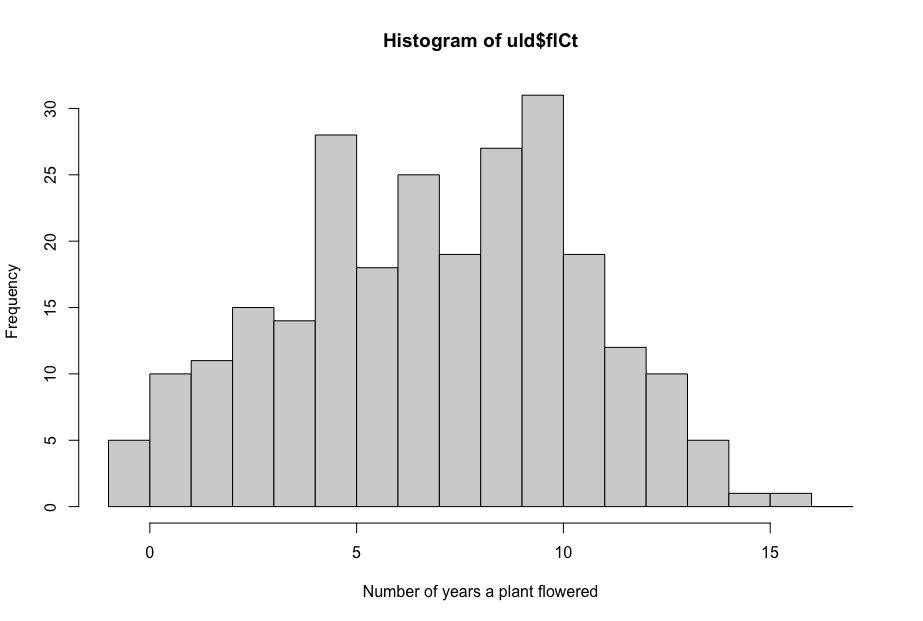
The oldest plants in our experimental plots are turning 25 years old this year. Happy almost birthday to them! I set off on a mission to determine how many of these plants are still alive so we know how much cake we need to celebrate. These plants are in the oldest portion of our oldest experimental plot (exPt01), they were planted in 1996 and every year since we have visited each plant and recorded various traits. The first year that these plants flowered was in 1999, a total of 10 plants flowered in this first year. If we look at survival as of 2019 only 251 of the original 646 plants are still alive. Of these 251 surviving plants five of these plants have never flowered! They have been alive for 26 years and never flowered, they have only been producing basal rosettes (just leaves nothing else), all these years. On the other end of the flowering frequency spectrum, one plant has flowered during 16 of the 26 years that it has been alive, that is a 62% flowering rate. To show the high variation in flowering frequency I made the following histogram, the majority of plants have flowered a total of nine or four times. As I continue to work through the 2020 data from our experimental plots I will be posting more “Random Fun Facts” with Mia so stay tuned to learn more about what is going on in the experimental plots! Stopped by P8 this morning and snowshoed out to P2. If you like these plots in the summer, the winter offers a new, unique perspective of the beauty of a prairie. The last few days, all vegetation has been covered in hoarfrost so the prairie lacks all color and seems like a black and white movie scene.   On the south side of the P2, overlooking the plot. 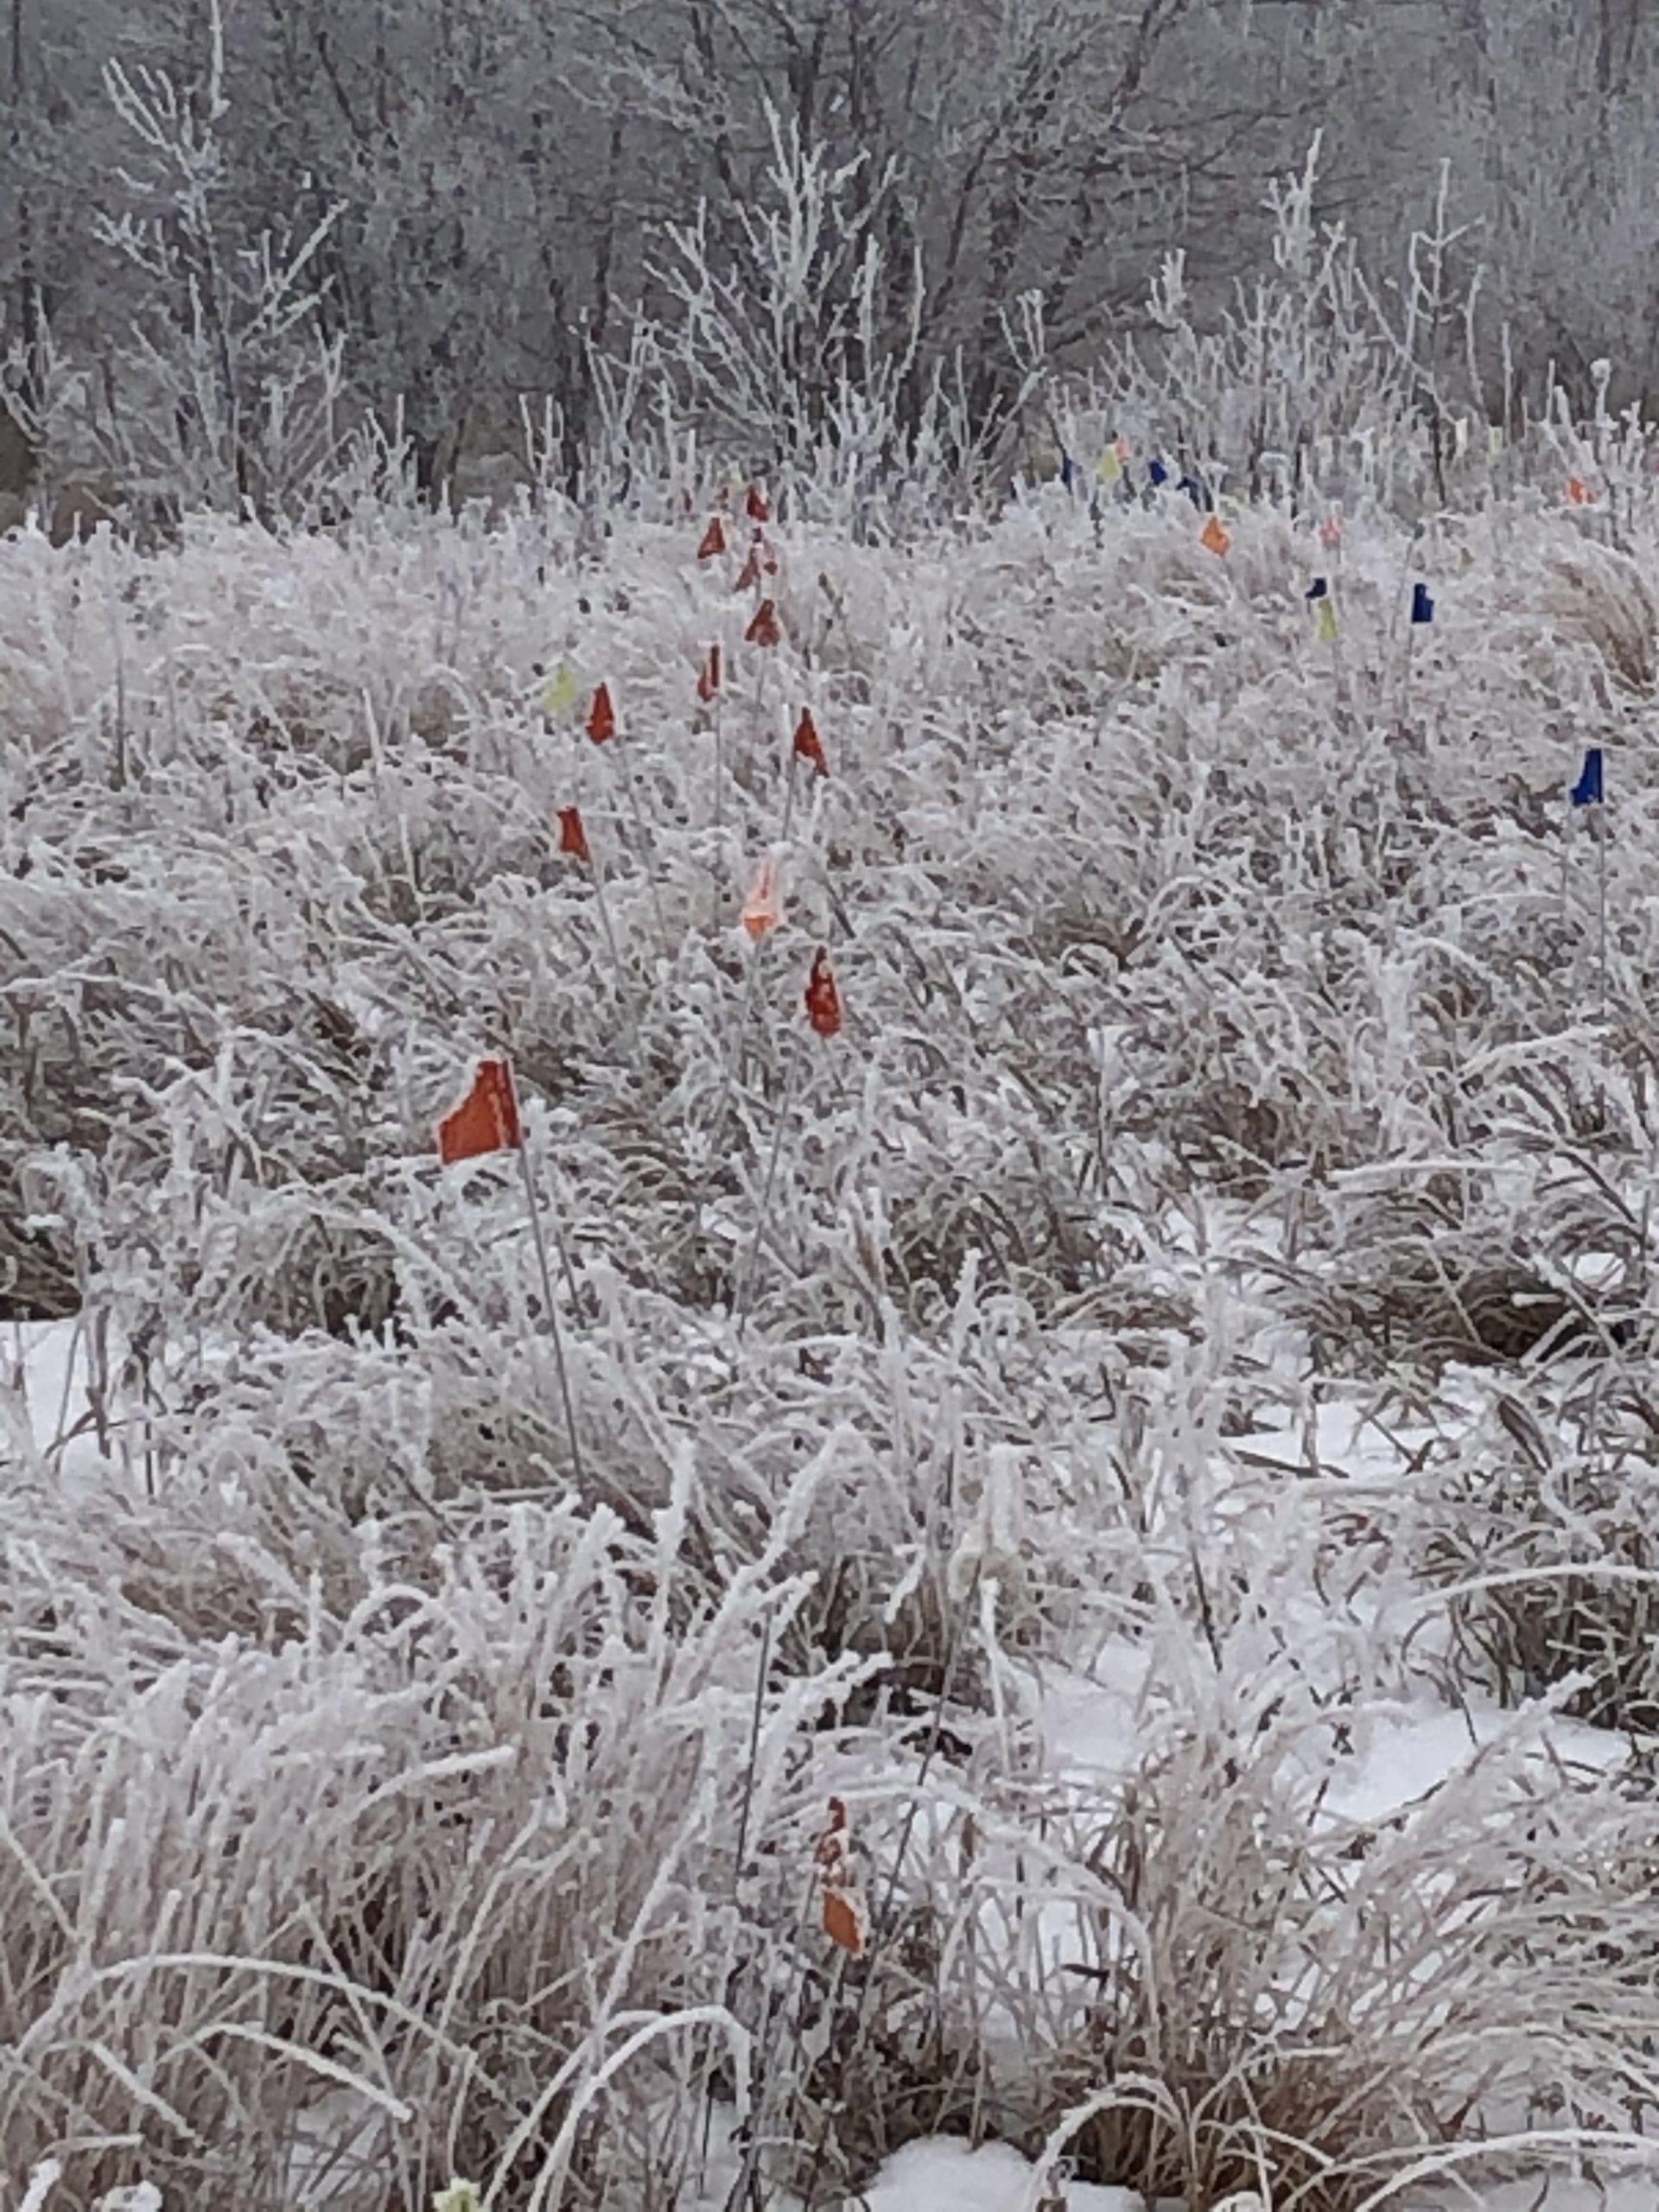 Since 1996, members of Team Echinacea have walked, crawled, and ~sometimes~ run next to rows of Echinacea angustifolia planted in common garden experiments. Although protocol varies depending on the experimental plot, every year team members record flowering phenology data, measuring data, and harvest the heads of the thousands of plants we have in common garden experiments. Note that these experiments are not really gardens. “Common garden” refers to the experimental design. Most of our experimental plots are prairie restorations, a few are abandoned ag fields that are manged as grassland habitat. Some plots have multiple experiments within. The Echinacea Project currently has 10 established experimental plots: exPts01-10. To avoid repetitiveness of reports on yearly phenology, measuring, and harvesting, this project status report will include updates on all experimental plots 1, 2, 4, 5, and 8. Reports for the others will be elsewhere: Amy Dykstra’s plot (exPt03), the hybrid plots (exPt06, exPt07, exPt09), and the West Central Area common garden (exPt10). exPt01: Experimental plot 1 was first planted in 1996 (cleverly termed the 1996 cohort), and has been planted with nine other experiments in subsequent years, with the most recent planting being Amy Waananen’s inter-remnant crosses. It is the largest of the experimental plots, with over 10,000 planted positions; experiments in the plot include testing fitness differences between remnants (1996, 1997, 1999), quantifying effects of inbreeding (inb1, inb2), and assessing quantitative genetic variation (qgen1). There are also a number of smaller experiments in it, including fitness of Hesperostipa spartea, aphid addition and exclusion, and pollen addition and exclusion. In 2020, we visited 4,340 of the original 10,622 planted and found 3,258 alive. Only 484 plants were classified as “flowering” in exPt01 this year. This is a drastic increase from the nearly 70 plants that flowered in summer 2019 – perhaps it is a testament to the benefits of controlled burning (we burned in spring 2020 but not in 2019). In summer 2020, we harvested ~815 total Echinacea heads in exPt01 (I have not finished the reconciliation process). In the fall, we added 484 staples to positions where plants were gone for three straight years, however, we ran out of staples, so 130 of these positions have “flaples” which are bent pin flags. exPt02: Heritability of flowering time is the name of the game in exPt02. Planted in 2006, exPt02 was planted to assess heritability of flowering start date and duration in Echinacea. In summer 2020, we visited 2,010 positions of the 3,961 positions originally planted. We measured 1,638 living plants, of which 444 were flowering. In the fall, we harvested ~626 heads from exPt02. We do not have an exact number of heads harvested from exPt02 yet, as we have not had time to complete head reconciliation. Location: Hegg Lake WMA exPt04: Experimental plot 4 was planted to gauge whether Echinacea from small remnant populations could be genetically rescued via an outcross to larger, more genetically diverse populations. Caroline Ridley and other members planted this plot in 2008. We did not measure exPt04 this year. Location: Hegg Lake WMA exPt05: The only experimental plot planted at Staffanson Prairie Preserve (SPP), exPt05, was planted to compare progeny of maternal plants from burned and unburned sections of SPP. There were 2800 plants planted originally, but high mortality made it impractical to visit the plot row-by-row. Now, we and treat the plot like demography. We use our survey-grade GPS to find plants in exPt05 that have previously flowered and add more plants to the stake file if new plants in the plot flower. In 2020 we found 11 living plants, two of which were flowering! There was only one head to collect, since one of the flowering plants exhibited only vertical development (no head). Location: Staffanson Prairie Preserve exPt08: Team Echinacea established quantitative genetics experiments to quantify additive genetic variance of fitness in Echinacea, with the idea that we can estimate evolutionary potential of study populations. The maternal parents of qGen2 and qGen3 are plants in the 1996, 1997, and 1999 cohorts. These plants were crossed with pollen from plants in remnants to produce seed for qGen2 and qGen3, which now inhabit exPt08. Originally, 12,813 seeds were sown in the common garden. Seeds from the same cross (shared maternal and paternal plants) were sown in meter-long segments between nails. A total of 3,253 seedlings were originally found, but only 562 plants were found alive in 2020. There were 5 flowering plants in 2020, and 5 heads. Note that there were an additional 2 heads collected from transplant plot. Plot management: To ensure that the common garden environment is as similar as possible to the prairie environment we must actively manage it. This management includes removing foreign species and supplementing with natives. One of our main management methods is through fire. We were unable to burn plots this fall however we hope to burn p8 and p1 this spring. We also collected seed to spread after burns including Schizachyrium scoparium, Bouteloua curtipendula, along with multiple species of Solidago and quite a few Asters. Asclepias viridiflora in p1: In 2019, plugs of an uncommon prairie milkweed, Asclepias viridiflora, were planted in Experimental plot 1. The purpose of this experiment is to assess the survival and fitness of A. viridiflora. Assessing vitality will also provide a frame of reference for species conservation across modern prairies. In 2020 a protocol was developed to identify and measure A. viridiflora. These data are waiting to be entered and analyzed. Hesperostipa demography: In 2009 and 2010, porcupine grass (Hesperostipa spartea, a.k.a. “stipa”) was planted in experimental plot 1. In total, 4417 seeds were planted, 1 m apart from each other and all 10 cm north of Echinacea plants. Between 2010 and 2013, each position was checked, and the plant status recorded. Since 2014, we have searched for flowering plants. The data from this summer can be found here cgdata/summer2020/stipaSearch, these data have not been processed yet. Inb1: The INB1 experiment investigates the relationship between inbreeding level and fitness in Echinacea angustifolia. Each plant in experiment INB1 originates from one of three cross types, depending on the relatedness of the parents: between maternal half siblings; between plants from the same remnant, but not sharing a maternal or paternal parent; and between individuals from different remnants. We continued to measure fitness and flowering phenology in these plants. In 2020, of the original 557 plants in INB1, 111 were still alive. Of the plants that were alive this year, 30 (27%) were flowering. This is up from the 4% that were flowering last year. All individuals were planted in 2001. qgen: The qGen1 (quantitative genetics) experiment in p1 was designed to quantify the heritability of traits in Echinacea angustifolia. We are especially interested in Darwinian fitness. Could fitness be heritable? During the summer of 2002 we crossed plants from the 1996 & 1997 cohorts of exPt01. We harvested heads, dissected achenes, and germinated seeds over the winter. In the Spring of 2003 we planted the resulting 4468 seedlings (this great number gave rise to this experiment’s nickname “big batch”). In 2020 we assessed survival and fitness measures of the qGen1 plants. 1,642 plants in qGen1 were alive in 2020. Of those, 17% flowered in 2020. All were planted in 2003. 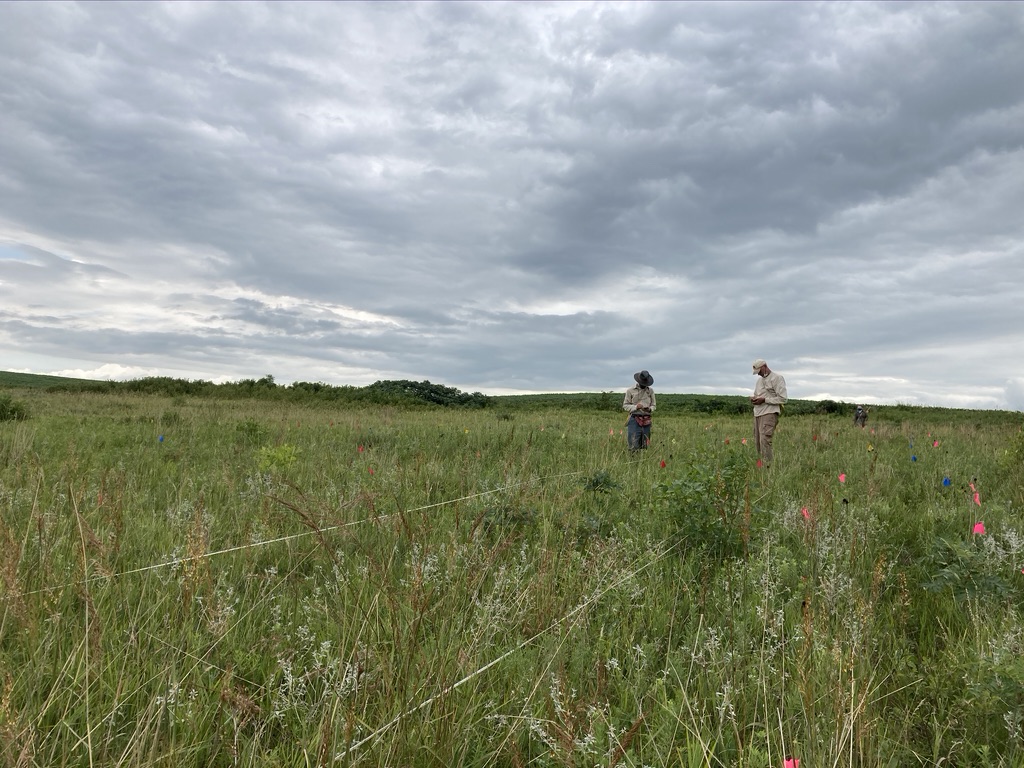 For more information on survival in common garden experiments, see this flog post about survival in common gardens. Start year: Various, see individual listings above. First ever planting was 1996. Location: Various, see above Overlaps with: Pretty much everything we do. Data/ materials collected: Measure data for all plots. All raw measure data available in cgData repository. Processed data should eventually be available in SQL database; ask GK for status of SQL database. GPS points were shot for the exPt09 flowering plant. Find the GPS jobs containing the exPt09 corners here: Dropbox/geospatialDataBackup2020/convertedASVandCSV2020/EXPT9_20200917_DARW.asv The stake file to find exPt5 plants is here: Dropbox/geospatialDataBackup2020/stakeFiles2020/exPt05stakeFile.csv Products: Many publications and independent projects. Since 1996, members of Team Echinacea have walked, crawled, and ~sometimes~ run next to rows of Echinacea angustifolia planted in common garden experiments. Although protocol varies depending on the common garden, every year team members record flowering phenology data, measuring data, and harvest the heads of the thousands of plants we have in common garden experiments. The Echinacea Project currently has 10 established experimental plots: exPts1-10. Due to the repetitiveness of yearly phenology, measuring, and harvesting, this project status report will include updates on all common garden experiments except for Amy Dykstra’s plot (exPt3), qgen2qgen3 (exPt8), and the West Central Area common garden (exPt10). exPt1: Experimental plot 1 was first planted in 1996 (cleverly termed the 1996 cohort), and has been planted numerous times in subsequent years, with the most recent planting being inbreeding 2. It is the largest of the experimental plots, with over 10,000 planted positions; experiments in the plot include testing fitness differences between remnants (1996, 1997, 1999) effects of inbreeding (inb1, inb2), and quantitative genetics experiments (qgen1). There are also a number of smaller experiments in it, including fitness of Hesperostipa spartea, aphid addition/exclusion, and pollen addition/exclusion. In 2019, we visited 4392 of the original 10,622 planted and found 3486 alive. Only 70 plants were classified as “flowering” in exPt1 this year. This is a drastic change from the nearly 1000 plants that flowered in summer 2018 – perhaps it is a testament to the benefits of controlled burning (we burned in spring 2018 but not in 2019). In summer 2019, we harvested 52 total Echinacea heads in exPt1. In the fall, we added 789 staples to positions where plants were gone for three straight years – this was desperately needed because no staples were added to positions with dead plants after 2018. exPt2: Heritability of flowering time is the name of the game in exPt2. Planted in 2006, exPt2 was planted to assess if flowering start date and duration was heritable in Echinacea. In summer 2019, we visited 2050 positions of the 3961 positions originally planted. We measured 1802 living plants, of which 654 were flowering. In the fall, we harvested ~1100 heads from exPt2. We do not have an exact number of heads harvested from exPt2 yet, as we have not had time to complete head reconciliation. Location: Hegg Lake WMA 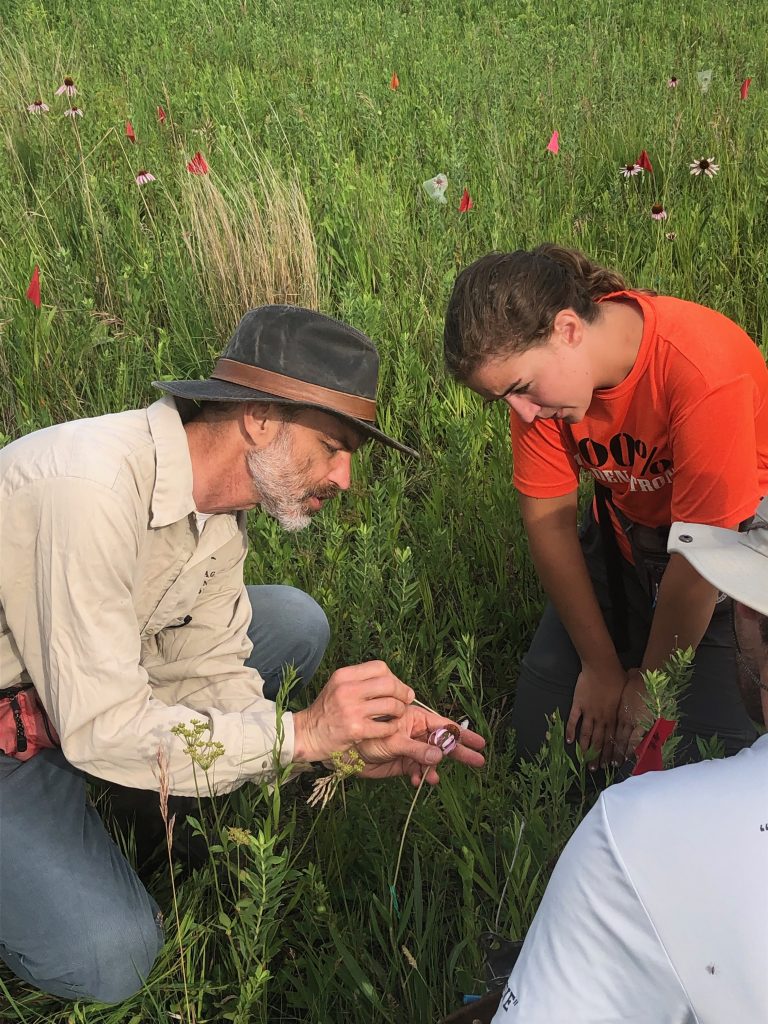 exPt4: Experimental plot 4 was planted to determine if Echinacea from small remnant populations could be genetically rescued via an outcross to larger, more genetically diverse populations. Caroline Ridley and other members of Team Echinacea sowed 3584 achenes at Hegg Lake WMA in 2008, and we have assessed survival and basal plant characters every year since. Survival in exPt4 is incredibly low. We only visited 21 plants in 2019 and only 7 were alive. No plants have flowered in this plot yet. Location: Hegg Lake WMA exPt5: The only experimental plot planted at Staffanson Prairie Preserve (SPP), exPt5, was planted in an attempt to compare progeny of maternal plants from burned and unburned sections of SPP. There were 2800 plants planted originally, but high mortality made it impossible to visit the plot row-by-row. Now, we and treat the plot like demography. We use a GPS to find plants in exPt5 that have previously flowered and add more plants to the stake file if new plants in the plot flower. In 2019, we visited 10 plants in the plot, all of which were alive! There were no plants flowering in exPt5 in 2019, though. Location: Staffanson Prairie Preserve exPt6: Experimental plot 6 was the first E. angustifolia x E. pallida hybrid plot planted by Team Echinacea. A total of 66 Echinacea hybrids were originally planted; all have E. angustifolia dams and E. pallida sires. In 2019, we visited 40 positions and found 28 living plants. No plants have flowered in this plot yet. As of January 2020, all exPt6 measure data through summer 2019 is uploaded to the SQL database. Location: near exPt8 exPt7: Planted in 2013, experimental plot 7 was the second E. pallida x E. angustifolia plot. It contains conspecific crosses of each species as well as reciprocal hybrids. There were 294 plants planted. Out of the 205 plants we visited in 2019, we found 161 plants still alive and basal; there were no flowering plants this year. For some context, survival of pure E. angustifolia crosses was lower than all other cross types. As of January 2020, all exPt7 measure data through summer 2019 is uploaded to the SQL database. Location: Hegg Lake WMA exPt9: Experimental plot 9 is another hybrid plot, but unlike the other two hybrid plots, we do not have a perfect pedigree of the plants. That is because E. angustifolia and E. pallida maternal plants used to generate seedlings for exPt9 were open-pollinated. We need to do paternity analysis to find the true hybrid nature of these crosses (assuming there are any hybrids). There were originally 745 seedlings planted in exPt9, and in 2019 we visited 510 positions. It was one of the harder plots to measure because over half of the positions did not have a plant and we do not use staples at Hegg Lake WMA. We found 308 living plants in 2019, one of which was flowering! We know the flowering plant has an E. pallida mother, but we are still unsure of the paternity of the flowering plant. When we know, we will post an update. As of January 2020, all exPt9 measure data through summer 2019 is uploaded to the SQL database. Location: Hegg Lake WMA 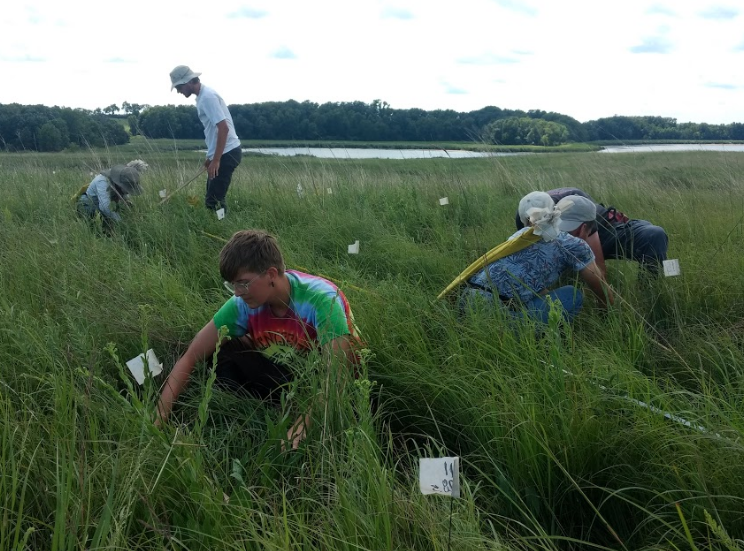 For more information on survival in common garden experiments, see this flog post about survival in common gardens. Start year: Various, see individual listings above. First ever planting was 1996. Location: Various, see above Overlaps with: Pretty much everything we do Data/ materials collected: Measure data for all plots. All raw measure data available in cgData repository. Processed data should eventually be available in SQL database; ask GK for status of SQL database. GPS points were shot for the exPt9 flowering plant, as well as for all surviving plants in exPt4. Find the GPS jobs containing the exPt4 and exPt9 points in ~Dropbox\geospatialDataBackup2019, saved in three formats in temporaryDarwBackups2019, convertedXML2019 and convertedASVandCSV2019. The job name is SURV_20191002_DARW and the points have names that distinguish them by the experimental plot. The stake file to find exPt5 plants is here: ~Dropbox\geospatialDataBackup2019\stakeFiles2019\exPtFiles\exPt05stakeFile.csv Products: Many publications and independent projects. |
|
|||
|
© 2024 The Echinacea Project - All Rights Reserved - Log in Powered by WordPress & Atahualpa |
||||