|
|
Here’s the final dataset for my compatibility experiment. The experiment is officially ended today (I collected the last bit of data). The dataset contains GPS data (column name distBetween). I missed one plant while GPS-ing, so I used the hand-measured data (for flag #6 at Nessman’s). I also corrected several errors in the datasheet.
Data for Analysis — cswitzer — 31 July 2011.csv
We spent some time GPS-ing the plants, so we could get the exact distances between them. Here is a csv file with the gps data.
I have been working on analyzing all my data. I looked at plots of each of my individual sties, as well as all the data combined. The data are almost exactly opposite of what I expected.
Here’s the script I’ve been exploring:
callinCompatRScript31july2011.R
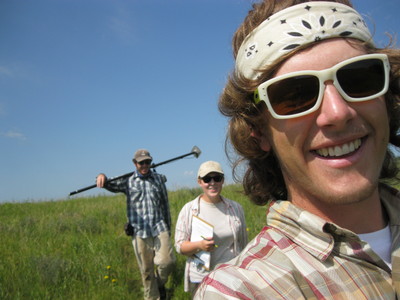
Here’s a picture of Josh, Amber Z, and I out in the field (having a lot of fun).

Edited by cswitzer. 25 July 2011
Characteristics of a good CSV file:
1. Use database format in Excel
See this example: https://echinaceaproject.org/wp-content/uploads/2011/07/preliminary-analysis-for-calli.html
2. Don’t mix text, integer, or numeric fields (you may enter NA in a numeric field to signify missing data)
3. Remove spaces from excel cells
4. No punctuation in each column name
5. Don’t start a column with a number
6. Column names should be in easily typable format — use capitals at new words and use no spaces (called camelback format)
A quick list of flowering plants I noticed while assessing phenology in Jennifer’s experimental plot at Hegg Lake WMA on 10 July. I list only plants observed in the plot. Asclepias speciosa is flowering just outside the SE corner of the plot.
F = flowering
X = done flowering/in fruit
N = not yet
Heliopsis helianthoides F
Amorpha canescens N
Coreopsis palmata F
Rosa arkansana F
Anemone cylindrica X
Silene F
Asclepias syriaca F
Amphicarpea bracteata F
Morning glory sp F
Apocyanum F
Tragopogon F
Cirsium arvense F
Lathyrus venosus XF (almost all done flowering)
Galium boreale F
Psoralea argophylla F
Medicago sativa F
Linum sulcatum F
Carduus acanthoides F
Senecio X
Liatris N
Achillea F
Zizea X
Red field clover F
Yellow fl lactucid F
Potentiall arguta F
Desmodium F
Physalis F
Dichanthelium leibergii XF
No Phlox pilosa in the plot!
Here’s a link to a useful, online statistics textbook.
http://www.statsoft.com/textbook/
InventoryMay2011.doc An inventory of Team E’s side of G-3.
I’ve been working with the Stipa germination data we collected from the common garden over the summer for Stuart’s R class and, among other things, have come up with a little plot of the common garden. Filled-in blue circles are where we found Stipa alive, empty circles had no seedlings. A neat thing would be some kind of heat map for longest leaf or number of leaves, but I’ll try that later.
View image
A .csv file with the list of leftover 14000 tags. These tags were not put out in 2009.
oldTags.csv
This R script, hillaryLookAtAphids.r, allows one to view graphs of growth of aphid clones in Lauren and Hillary’s experiment.
XML is packaged for R via CRAN and is based on RSXML. Perhaps this will make it easier to parse the XML that the Topcon software puts out, or easier than trying to parse it all yourself.
|
|