|
|
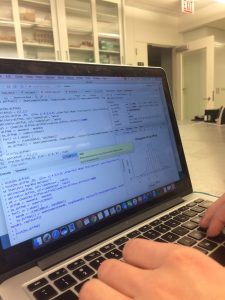
Nina here! To start off the third week of our externship, Trevor and I got back to work in R. We started making our own scripts to try to visualize our data and understand our results. I found a strong correlation between seed-set and fecundity and a correlation between seed-set and achene count (although the R squared value was small). I downloaded a database of plants of Minnesota from the USDA database that included information on whether or not the plants were native, threatened, or endangered as well as their fire tolerance and growth habit. I merged this database with the diversity data collected in the field in order to provide more data about each species. Next, I tried to calculate the percent of invasive and nonnative species for each plot. Meanwhile, Trevor calculated the means for the numbers of achenes in the top, middle, and bottom samples and determined whether or not there was statistical significance between pairwise comparisons of the findings. Next, he looked at confidence intervals for his findings. We both continued our work on our papers, writing up our methods sections specifically. As Trevor meant to say, there’s nowhere to go from here but up!

This summer, we measured open-pollinated hybrid Echinacea plants in experimental plot 9 at Hegg Lake. The table below shows the number of plants found alive during each search since the experiment started in 2014. Of the surviving plants in 2017, 90% had fewer than 3 leaves, the mean length of the longest basal leaf was 25 cm, and only six plants had more than one basal rosette. This year we searched for plants once then rechecked every position where we didn’t find a plant during our first search. No plants flowered this year.
| Year / Event |
Number Alive |
% Original remaining |
% Of previous year |
| Planting (2014) |
746 |
100 |
|
| 2014 |
638 |
85.5 |
85.5 |
| 2015 |
521 |
69.8 |
81.7 |
| 2016 |
493 |
66.1 |
94.6 |
| 2017 |
401 |
53.8 |
81.3 |
This experiment comparing the fitness of Echinacea hybrids with pure-bred E. angustifolia and E. pallida will give insight into the possible consequences of non-native E. pallida being planted in restorations in Minnesota, where E. angustifolia is the only native Echinacea.
 Measuring at Hegg Lake Start year: 2014
Location: Hegg Lake Wildlife Management Area — experimental plot 9
Overlapping experiments: Echinacea hybrids — experimental plot 6, Echinacea hybrids — experimental plot 7
Data collected: Rosette number, length of all leaves, herbivory for each plant collected electronically and exported to CGData. Recheck information for plants not found was also collected electronically and stored in CGData.
You can find out more information about experimental plot 9 and flog posts mentioning the experiment on the background page for the experiment.
Trevor here! Today, Nina and I finished our work in “R” and diverged paths. I recounted Solidago to ensure that my initial counts were accurate. Nina began aggregating her data in “R” and created five extremely beautiful and effective graphs to display her data efficiently. Then, we progressed to the lab meeting, stuffing our faces with salami, cheese, and crackers as we learned about different management methods used with western prairie fringe orchids in Northwest Minnesota. Whilst attempting to answer questions, it seems as if these meetings yield more questions then answers as the intense discussion amongst fellow researchers brings up perspectives not previously contemplated, providing opportunities for future research. Stuffing our faces at lab meeting progressed into stuffing our faces at the holiday party as we joined everyone in the festivities. Highlights include chocolate covered strawberries, mac and cheese, and meatballs. Nina and I, on the recommendation of Leslie and Marty, then proceeded to walk off our meal with a stroll through the garden, visiting the amazing green houses in the Regenstein center. It’s super surreal to be inside a tropical-esque greenhouse in the middle of December! Ending our Friday, we began researching and writing the background information for our future research papers and are excited to continue our writing next week.

This summer, we measured hybrid Echinacea plants in experimental plot 7 at Hegg Lake. 159 of the original 294 planted seedlings (54%) were found this year. We searched 243 of the 294 positions where plants were originally planted (the other 51 positions were not searched because plants have not been found for at least three years in a row). The table below shows the fate of plants in 2017 summarized by cross-type — the first name in the cross type is the maternal species, and the second name is the paternal species (e.g., ‘ang x pal’ is angustifolia mother and pallida father).
| Status 2017 |
ang x ang |
ang x pal |
pal x ang |
pal x pal |
| not found |
53 |
10 |
33 |
35 |
| found |
21 |
18 |
52 |
72 |
Flowering Echinacea angustifolia. Start year: Crossing in 2012, Planting in 2013
Location: Hegg Lake Wildlife Management Area – Experimental Plot 7
Overlaps with: Echinacea hybrids: ex Pt 6; Echinacea hybrids: ex Pt 9
Data collected: Rosette number, length of all leaves, herbivory for each plant collected electronically and exported to CGData. Recheck information for plants not found was also collected electronically and stored in CGData.
Products: Taylor Harris’s 2015 poster demonstrating fitness benefits of pallida parenthood.
You can find more information and links to previous flog entries involving experimental plot 7 on the background page for the experiment.
Nina here! Today, Trevor and I downloaded R and RStudio and started familiarizing ourselves with R by using the tutorial package ‘swirl’ and completing several of the lessons about the basic building blocks, vectors, matrices, data frames, logic, functions, and much more! Thanks in part to Trevor’s donut holes and Tracy and Lea’s support, we powered through and completed the swirl tutorials. Next, I got started with looking at my own data by reading in some of the csv data files into R and trying to get started on viewing them and writing a script to determine species richness. Also, just for fun, here’s a counting timelapse from a couple days ago of an evaluating empty, partially empty, and full achenes!
Hi! Trevor here, reporting on today’s events. Today I finished up my counting and classification of my achenes for both the Liatris and Solidago species. Better yet, Nina also finished her counting of the Echinacea species. Oh my! With our data collection finished, we are moving up the “corporate ladder,” and had our workday filled with enlightening meetings. We began by meeting with Jessa, a lovely 5th year Northwestern grad student. She told us everything from her educational background to her potential future jobs (including the possibility of teaching at the undergraduate level or possibly government work?!). She also explained the realities of being both accepted and working in a graduate environment, specifically at the Chicago Botanic Garden, which was a narrative we had not heard before. After brainstorming potential inquiries and hypotheses that emerged through our research, Nina and I also had a meeting with Stuart, Lea, and Tracie to discuss analyzing these hypotheses.

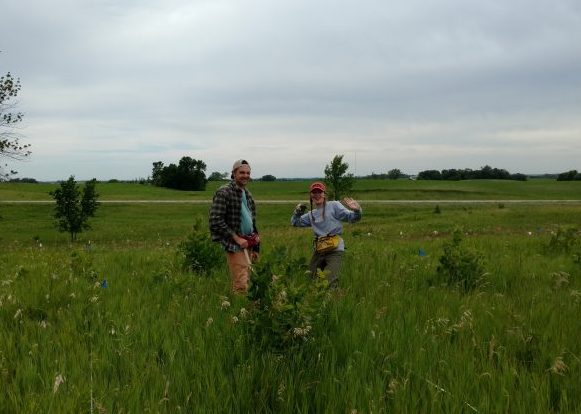
As you can see, we were hard at work (I was taking in the picture, but I promise I was there!). The meeting left us with lots of questions answered, but also lots of other questions to ponder was we begin our data analysis with two preliminary hypotheses we came up with. Tomorrow begins the start of “R.”
Wish us luck!
In 2017, we searched for 56 of the original 66 Echinacea hybrid plants. We found 28 Echinacea hybrids, and 2 of the Echinacea hybrids we found just had dead leaves from this year. This means that 42% of the original cohort is still alive, with the survival rate this winter of 78%. Of the surviving plants, the highest leaf count was 5 leaves, the longest basal leaf was 35cm, and only one plant had more than one basal rosette.
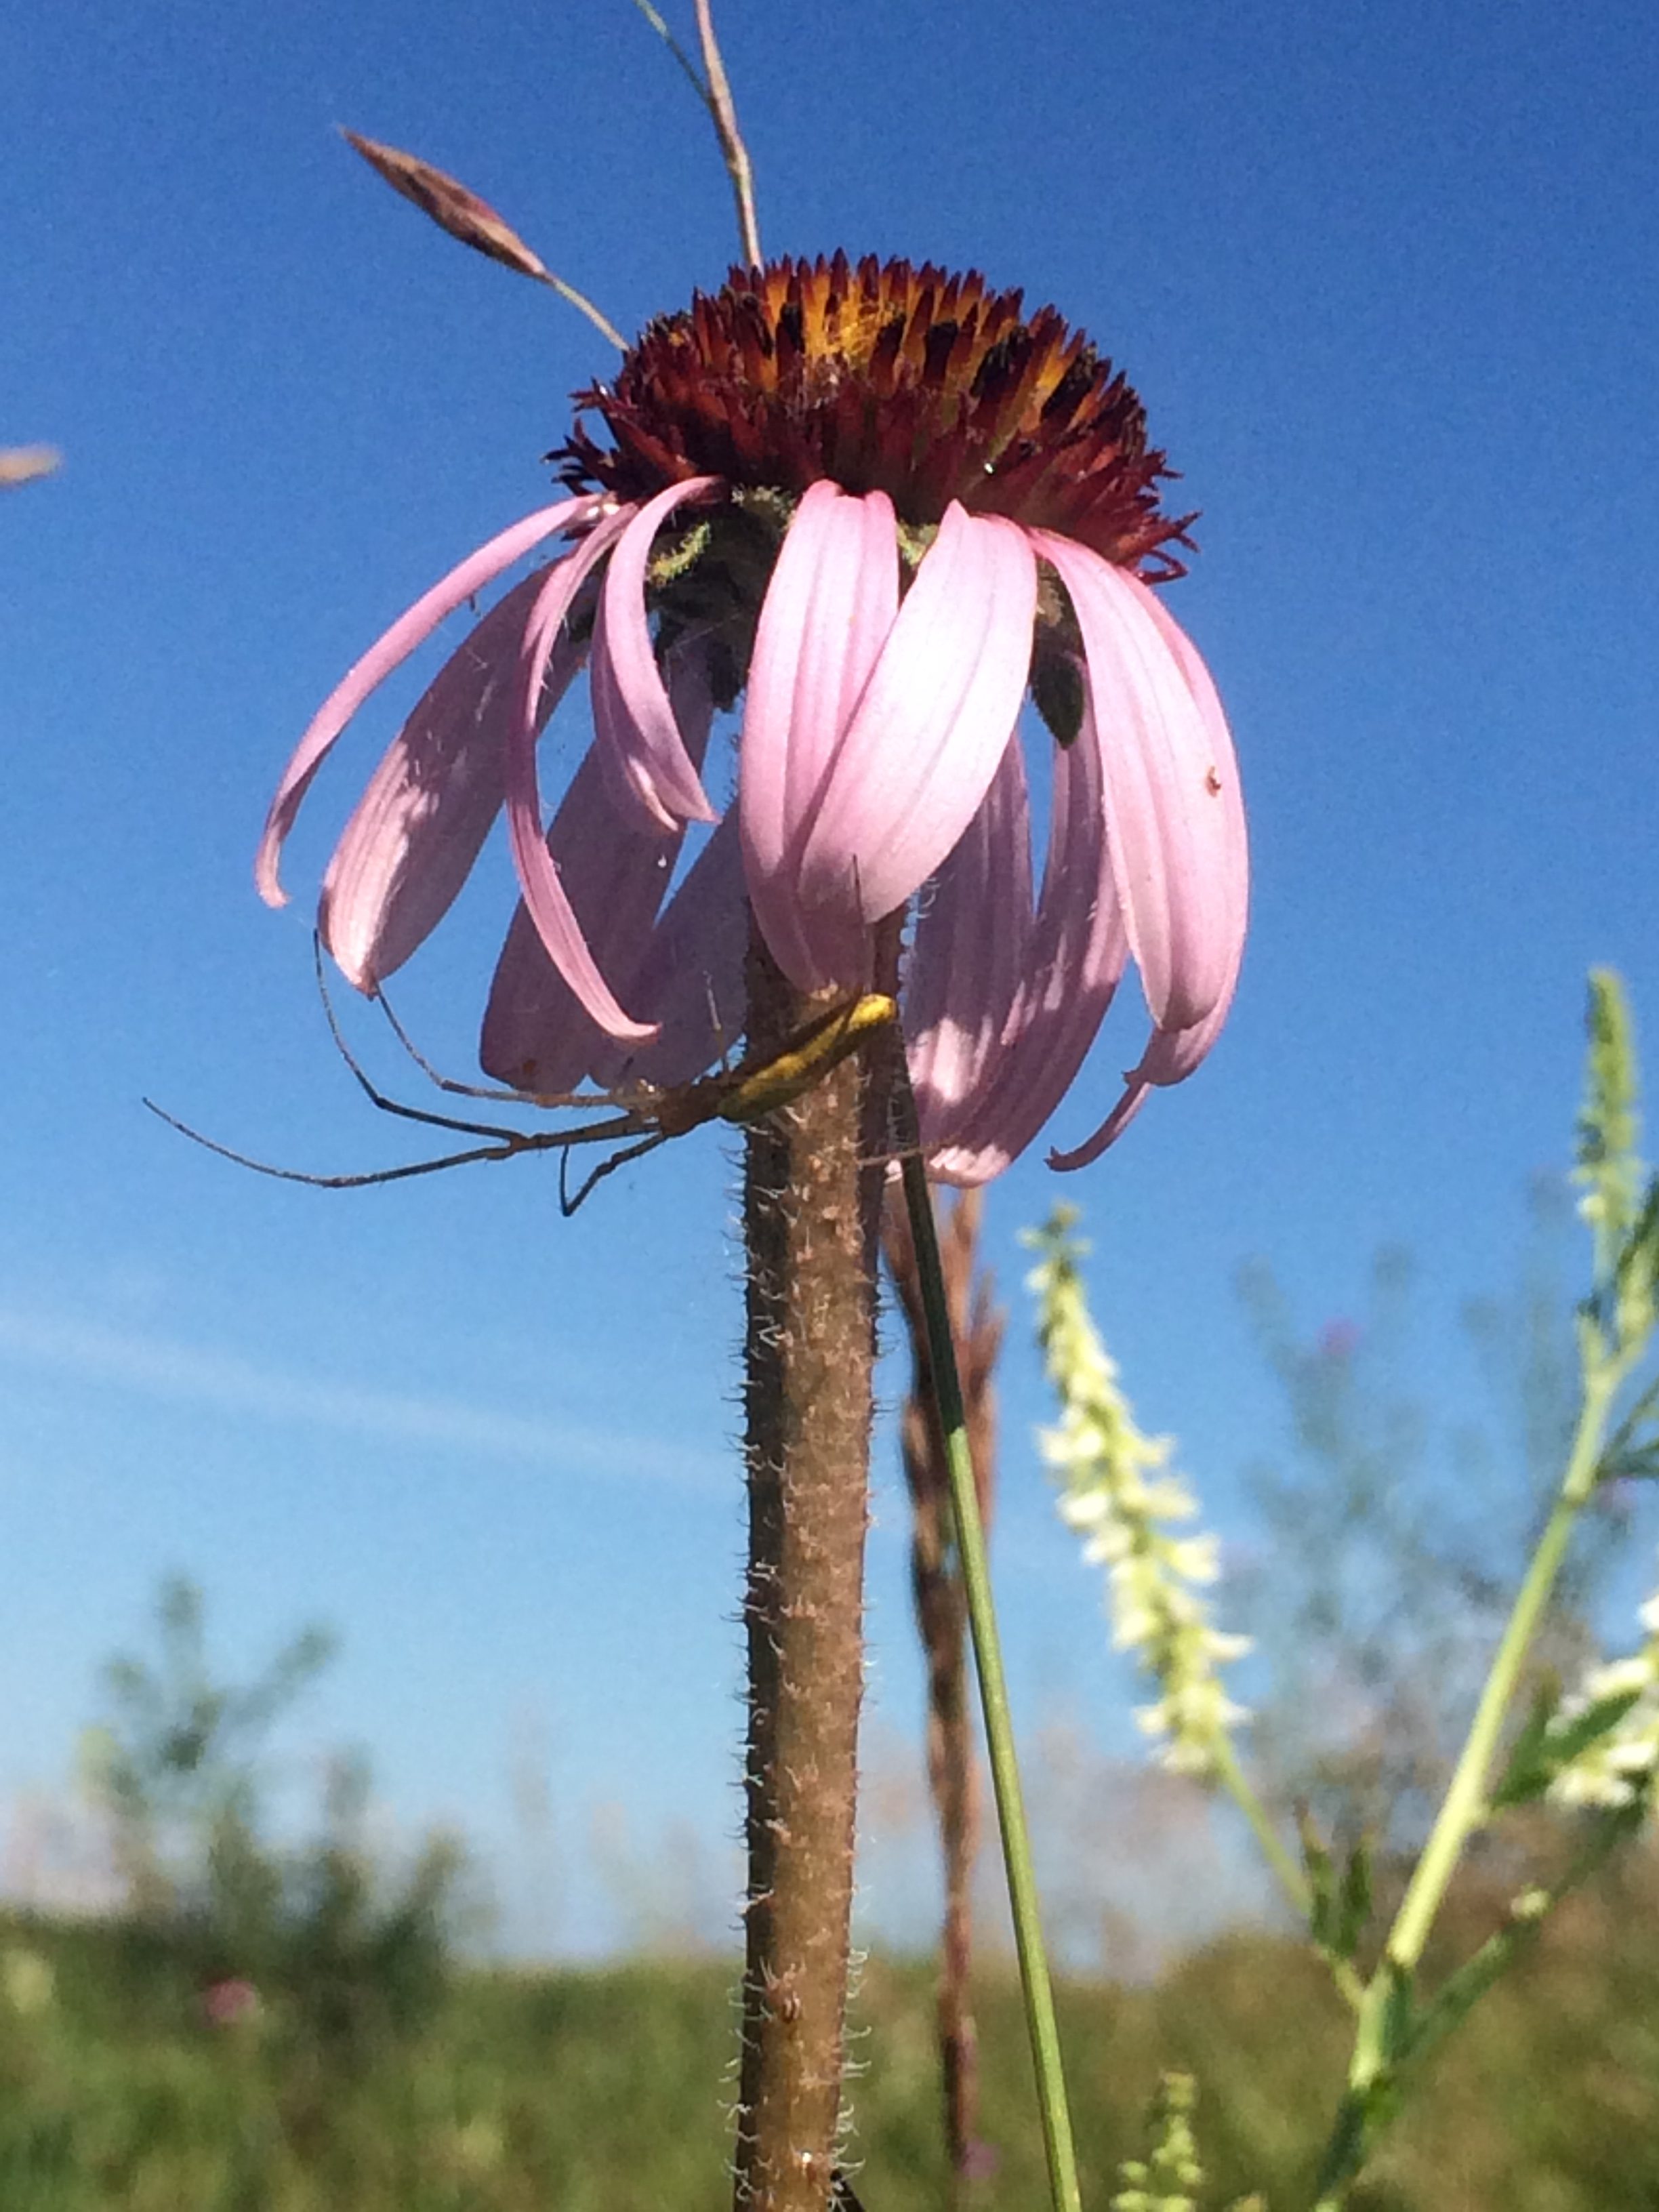
 Most plants we measured in exPt6 looked like this. This plot was originally developed for Josh Drizin’s experiment with exotic grasses, but 66 hybrids of Echinacea angustifolia and Echinacea pallida were also planted in 2012. In 2011, Gretel and Nicholas Goldsmith performed reciprocal crosses between 5 non-native pallida plants found at Hegg Lake and 31 angustifolia plants in P1. These plants have been revisited each summer since then.
Year started: Crossing in 2011, planting in 2012
Location: Experimental Plot 6, on Tower Road
Overlaps with: Echinacea hybrids — ex Pt 7, Echinacea hybrids — ex Pt 9
Data collected: Status, rosette count, longest leaf measurement, and number of leaves for each plant. Exported to CGData.
Products: Nicholas Goldsmith wrote a summary of the crosses he conducted in 2011.
You can find more information about experimental plot 6 and previous flog posts about it on the background page for the experiment.
Nina here! Trevor and I were hard at work today, getting our achenes ready to be X-rayed and counted. I finished randomizing achenes in preparation for X-raying them later, and started counting the achenes in each of my samples. Trevor finished cleaning his achenes, placed them all on X-ray sheets, and X-rayed all his samples. Now he has to count which of the achenes in each of his samples were full and which do not havean embryo. An image of one of his X-ray sheets is below.
Trevor here and reporting that me and Nina are very “hatisfied” with our progress from the day. As we sat alongside each other, working on our various tasks, we invented a new word in the english dictionary: “hatisfied.” It translates to, roughly, being satisfied with being at or around halfway done. I am around halfway done cleaning my solidago samples and will most likely finish tomorrow. After that, I will move on to arranging my baggies on x-ray sheets and then x-raying them to discern if there is an actual embryo in the achene. How exciting!
 On the other hand, Nina moved on to randomizing today to prepare her samples for x-raying, which she admits was a more tedious task than she had initially anticipated. But she is very enamored with her randomization wheel that she has so much that it makes up for the meticulous task it is (see exhibit A to the left). She finished about half of her bags and reports feeling “hatisfied” with her progress. She hopes to be done by tomorrow so she can prepare het sheets for x-raying for Wednesday. She also reports that she is looking forward to counting because it is a beautiful, non thought-provoking task. On the other hand, Nina moved on to randomizing today to prepare her samples for x-raying, which she admits was a more tedious task than she had initially anticipated. But she is very enamored with her randomization wheel that she has so much that it makes up for the meticulous task it is (see exhibit A to the left). She finished about half of her bags and reports feeling “hatisfied” with her progress. She hopes to be done by tomorrow so she can prepare het sheets for x-raying for Wednesday. She also reports that she is looking forward to counting because it is a beautiful, non thought-provoking task.
It seems as if we are nearing the end of phase one for both of our projects and both Nina and I are so excited to see what comes next! See you soon—and remember to stay “hatisfied!”
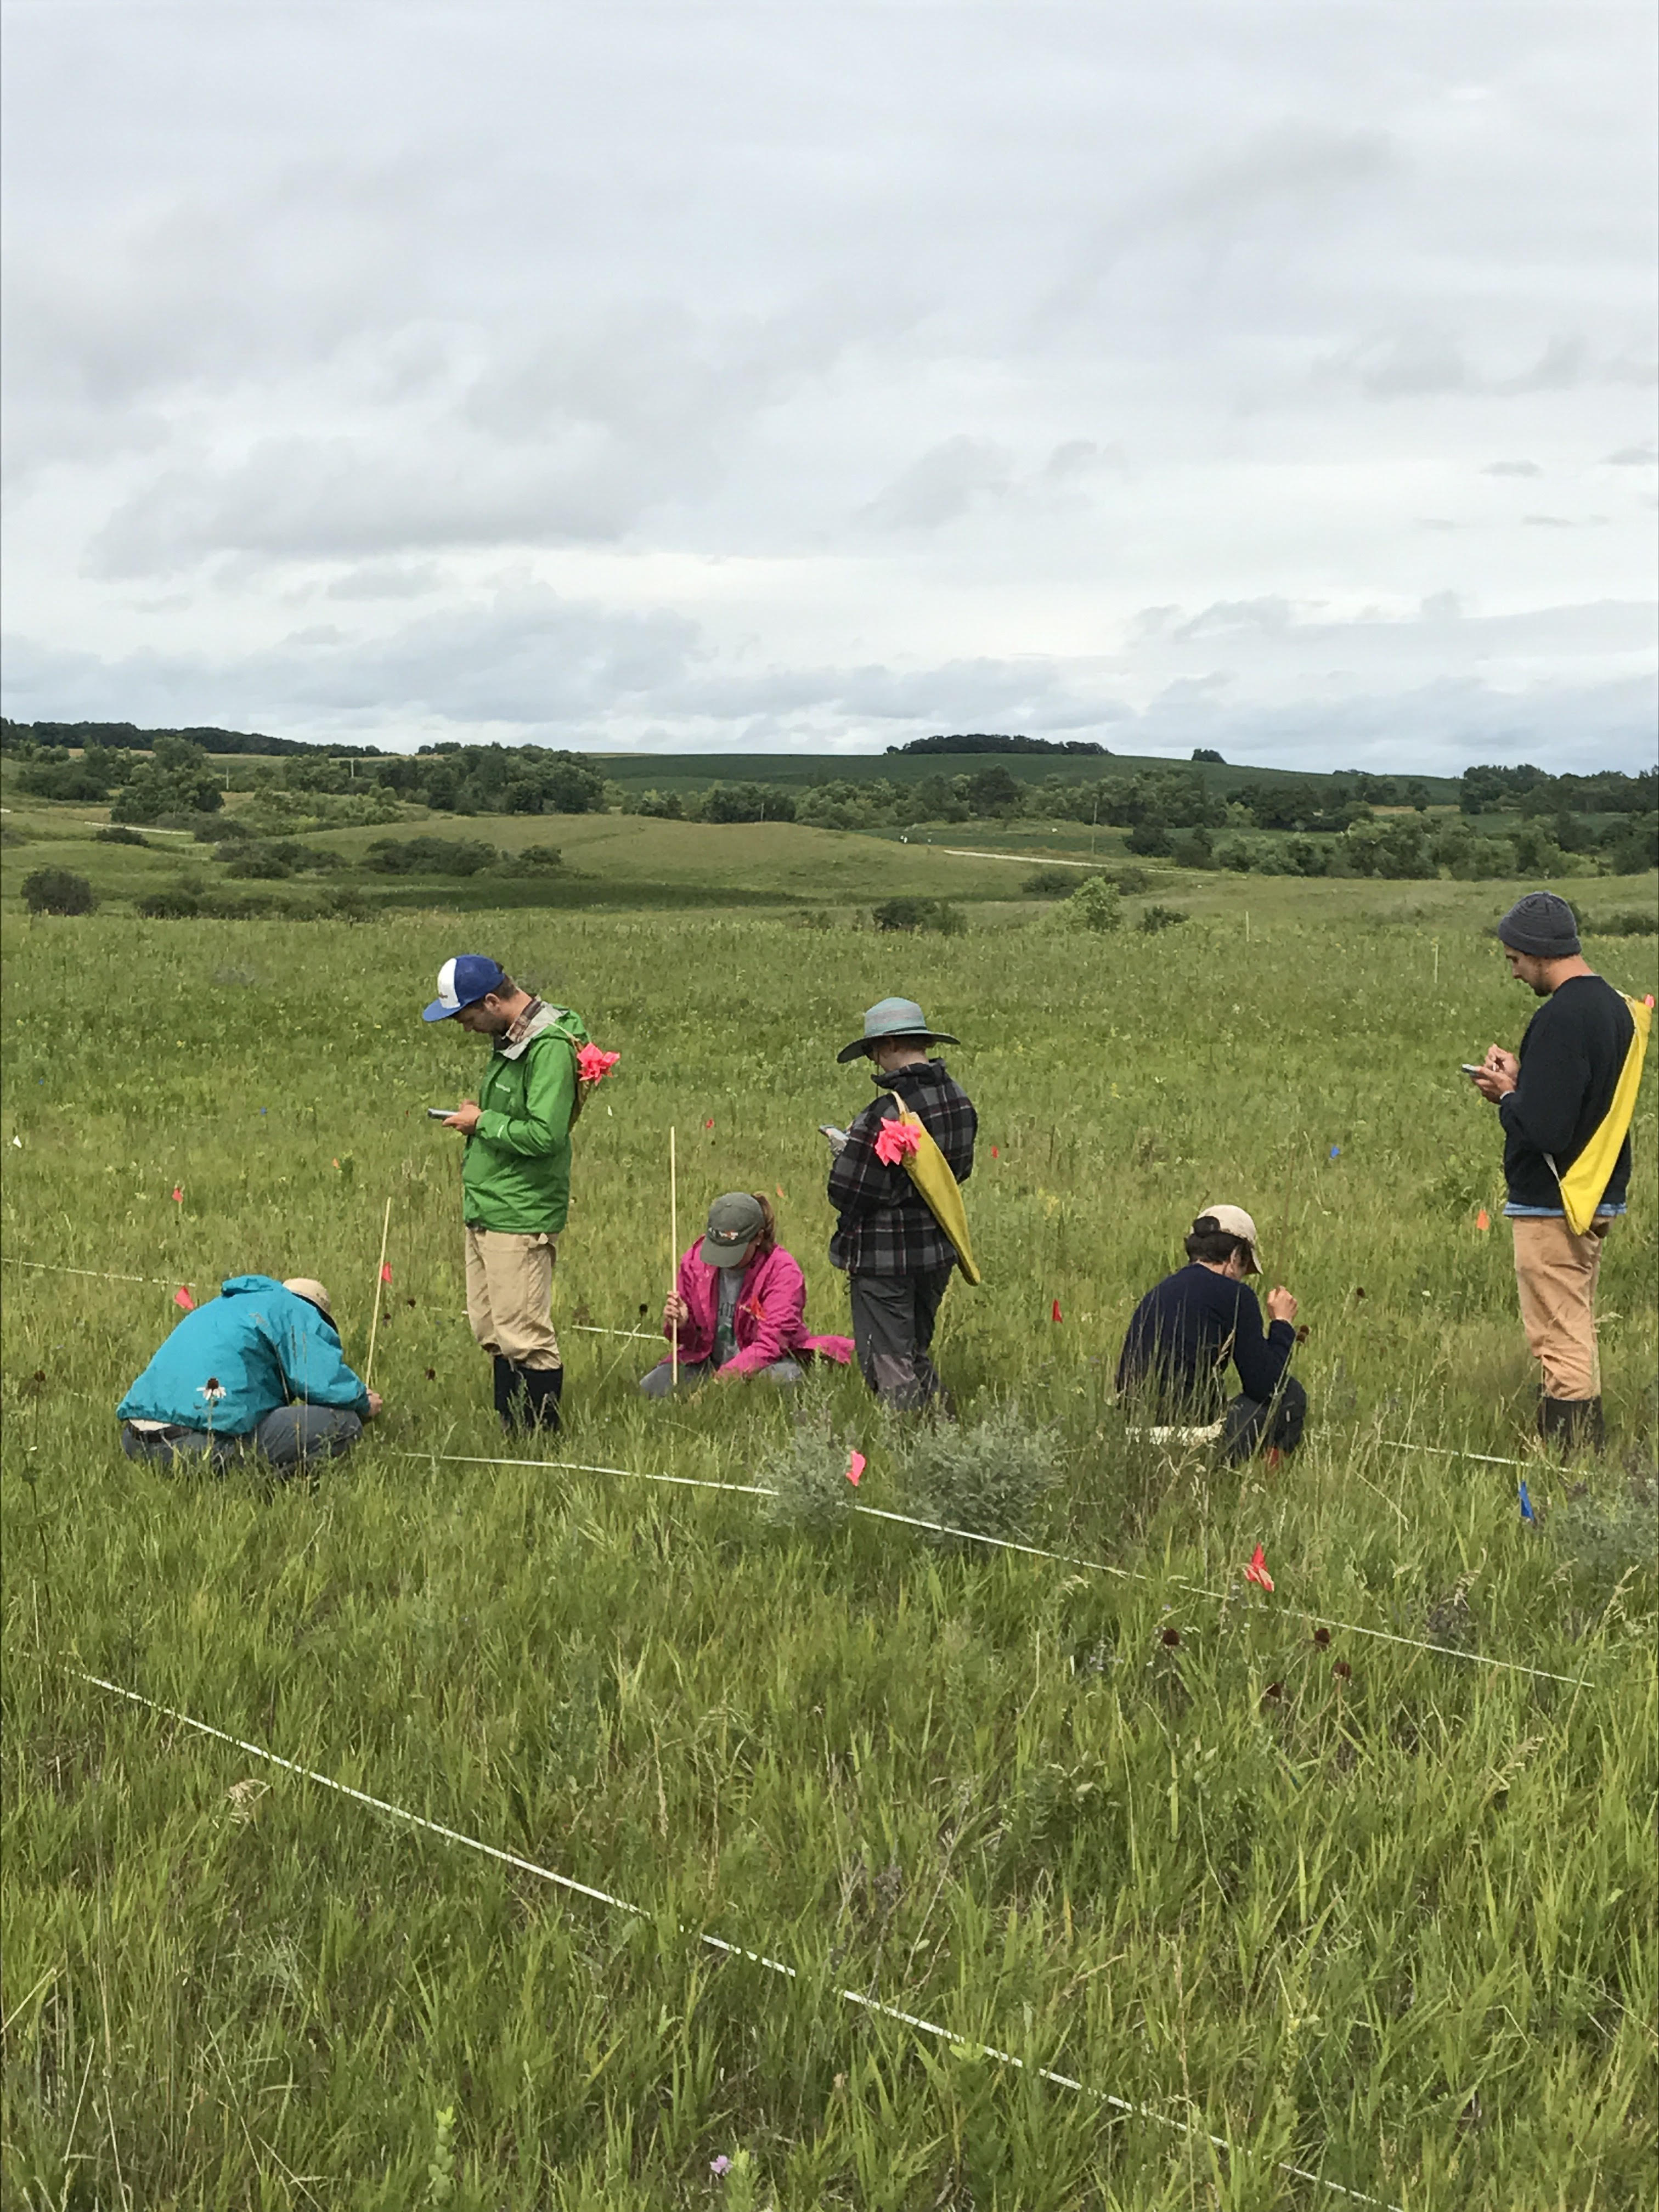
 Alex and Tracie search for juvenile Echinacea plants in experiments qGen2 & qGen3. In 2017, we found 1006 three-year-old plants out of the 2526 original seedlings found in 2014 (we found 1724 plants in 2016) in the qGen2 cohort. In the qGen3 cohort we found 248 of the 644 seedlings.
The main goal of the qGen2 and qGen3 experiments is to quantify the evolutionary potential of two remnant prairie populations of Echinacea angustifolia by estimating the additive genetic variance of fitness. We make estimates for two mating scenarios. The first scenario is an experimental crossing design with all matings among plants from two “core” sites: SPP and LF (core x core). The second design uses sires (pollen donors) from the core and dams from sites peripheral to the core. The crosses performed (core x core, core x periphery) in this experiment will quantify additive genetic variance for fitness in each site and each experimental group. Additionally, we will test for differentiation among families; do progeny from sires differ after accounting for maternal (dam) effects?
Comparing germination and first year survival between the qGen2 & qGen3 cohorts:
| exp |
approxFullAcheneCt |
totalAcheneCt |
seedlingCt |
germination |
firstYrSurvival |
| qGen2 |
6300 |
26144 |
2581 |
41% |
84% |
| qGen3 |
6200 |
19777 |
644 |
10% |
38% |
Start year qGen3: 2015
Start year qGen2: 2013
Location: The sires (pollen donors) are in the remnants Landfill and Staffanson. The dams (seed plants) are in exPt 1 and they originate from remnants. Specifically, the grand-dams (seed plants of dams) are from remnants Landfill (core) & around Landfill (peripheral) and remnants Staffanson (core) & railroad crossing sites (peripheral). All progeny are in exPt 8.
Overlaps with: Heritability of fitness–qGen1
Data collected: We used handheld computers to collect data on juvenile plants.
You can find more information about Heritability of fitness–qGen2 & qGen3 and links to previous flog posts regarding this experiment at the background page for the experiment.
|
|





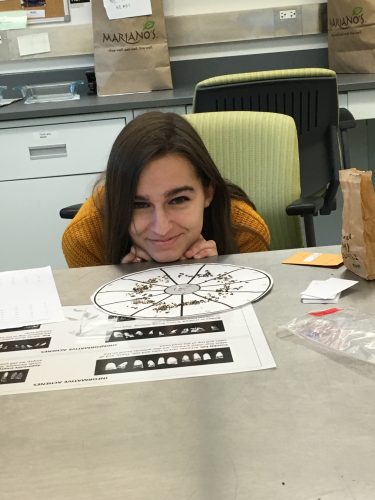 On the other hand, Nina moved on to randomizing today to prepare her samples for x-raying, which she admits was a more tedious task than she had initially anticipated. But she is very enamored with her randomization wheel that she has so much that it makes up for the meticulous task it is (see exhibit A to the left). She finished about half of her bags and reports feeling “hatisfied” with her progress. She hopes to be done by tomorrow so she can prepare het sheets for x-raying for Wednesday. She also reports that she is looking forward to counting because it is a beautiful, non thought-provoking task.