Reproduction in plants can be limited by access to pollen and resources. We previously found that Echinacea plants in the remnants are pollen limited, meaning that if they had access to more pollen, they would produce more seeds. However, the long-term effects of pollen limitation are unknown. Do plants that are super pollen saturated and have high amounts of pollen have a higher lifetime fitness than plants that are pollen limited? Also, we know that the plants in the remnants are pollen limited, but are the plants in the common garden environment also pollen limited? To answer these questions and more, 14 years ago Gretel randomly selected 39 plants from p1; half of these plants were randomly assigned to the pollen addition group, and the others were assigned to pollen exclusion. Every year, plants in the pollen exclusion have their heads bagged and they are not pollinated, while we hand cross every style in the pollen addition group.
In the summer of 2026, NONE of the original 39 addition/exclusion plants were flowering. If any had been flowering, the exclusion treatment plants would be covered with exclusion bags to prevent pollination, and the addition plants would be hand-pollinated multiple times throughout the summer. Of the 25 plants that were identified as alive last year, 24 were successfully found again this year.
Reproduction in plants can be limited by access to pollen and resources. We previously found that Echinacea plants in the remnants are pollen limited, meaning that if they had access to more pollen, they would produce more seeds. However, the long-term effects of pollen limitation are unknown. Do plants that are super pollen saturated and have high amounts of pollen have a higher lifetime fitness than plants that are pollen limited? Also, we know that the plants in the remnants are pollen limited, but are the plants in the common garden environment also pollen limited? To answer these questions and more, 13 years ago Gretel randomly selected 39 plants from p1; half of these plants were randomly assigned to the pollen addition group, and the others were assigned to pollen exclusion. Every year, plants in the pollen exclusion have their heads bagged and they are not pollinated, while we hand cross every style in the pollen addition group. An additional 53 plants in p1 were selected to be part of a control group where pollen was neither added nor excluded.
In the summer of 2024, NONE of the original 39 addition/exclusion plants were flowering. If any had been flowering, the exclusion treatment plants would be covered with exclusion bags to prevent pollination, and the addition plants would be hand-pollinated multiple times throughout the summer. One plant in the control group produced a single flowering head.
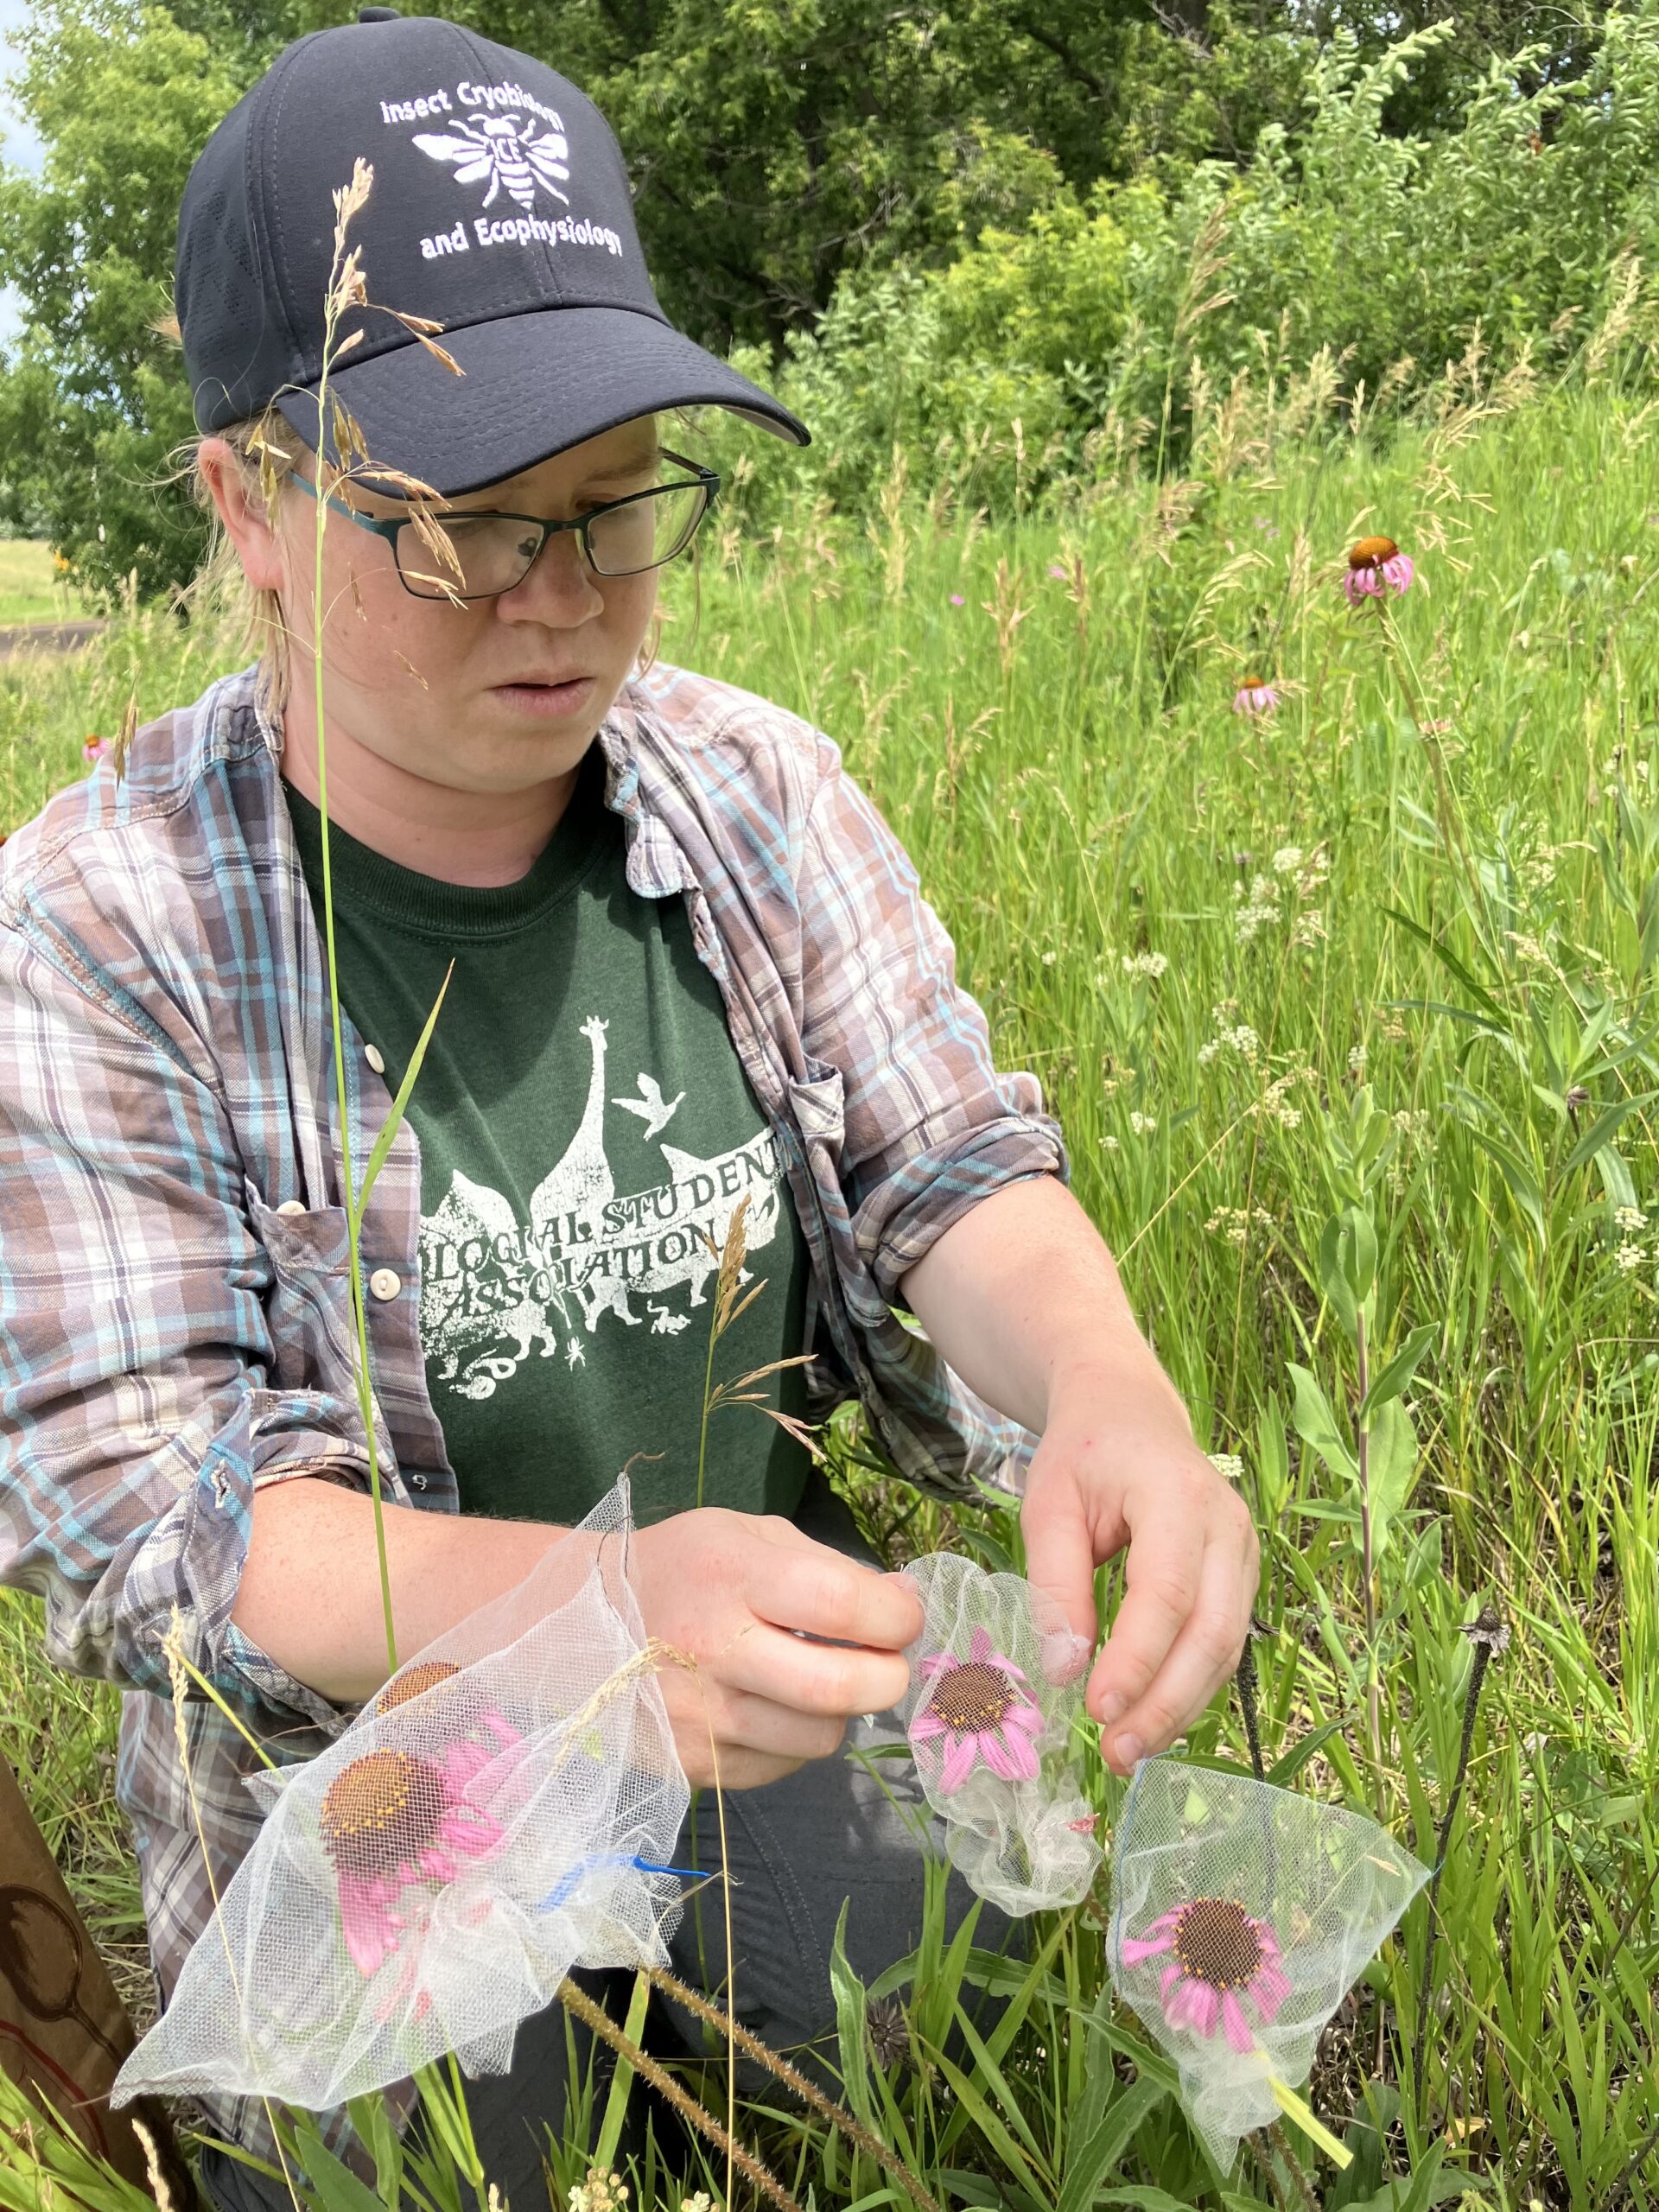
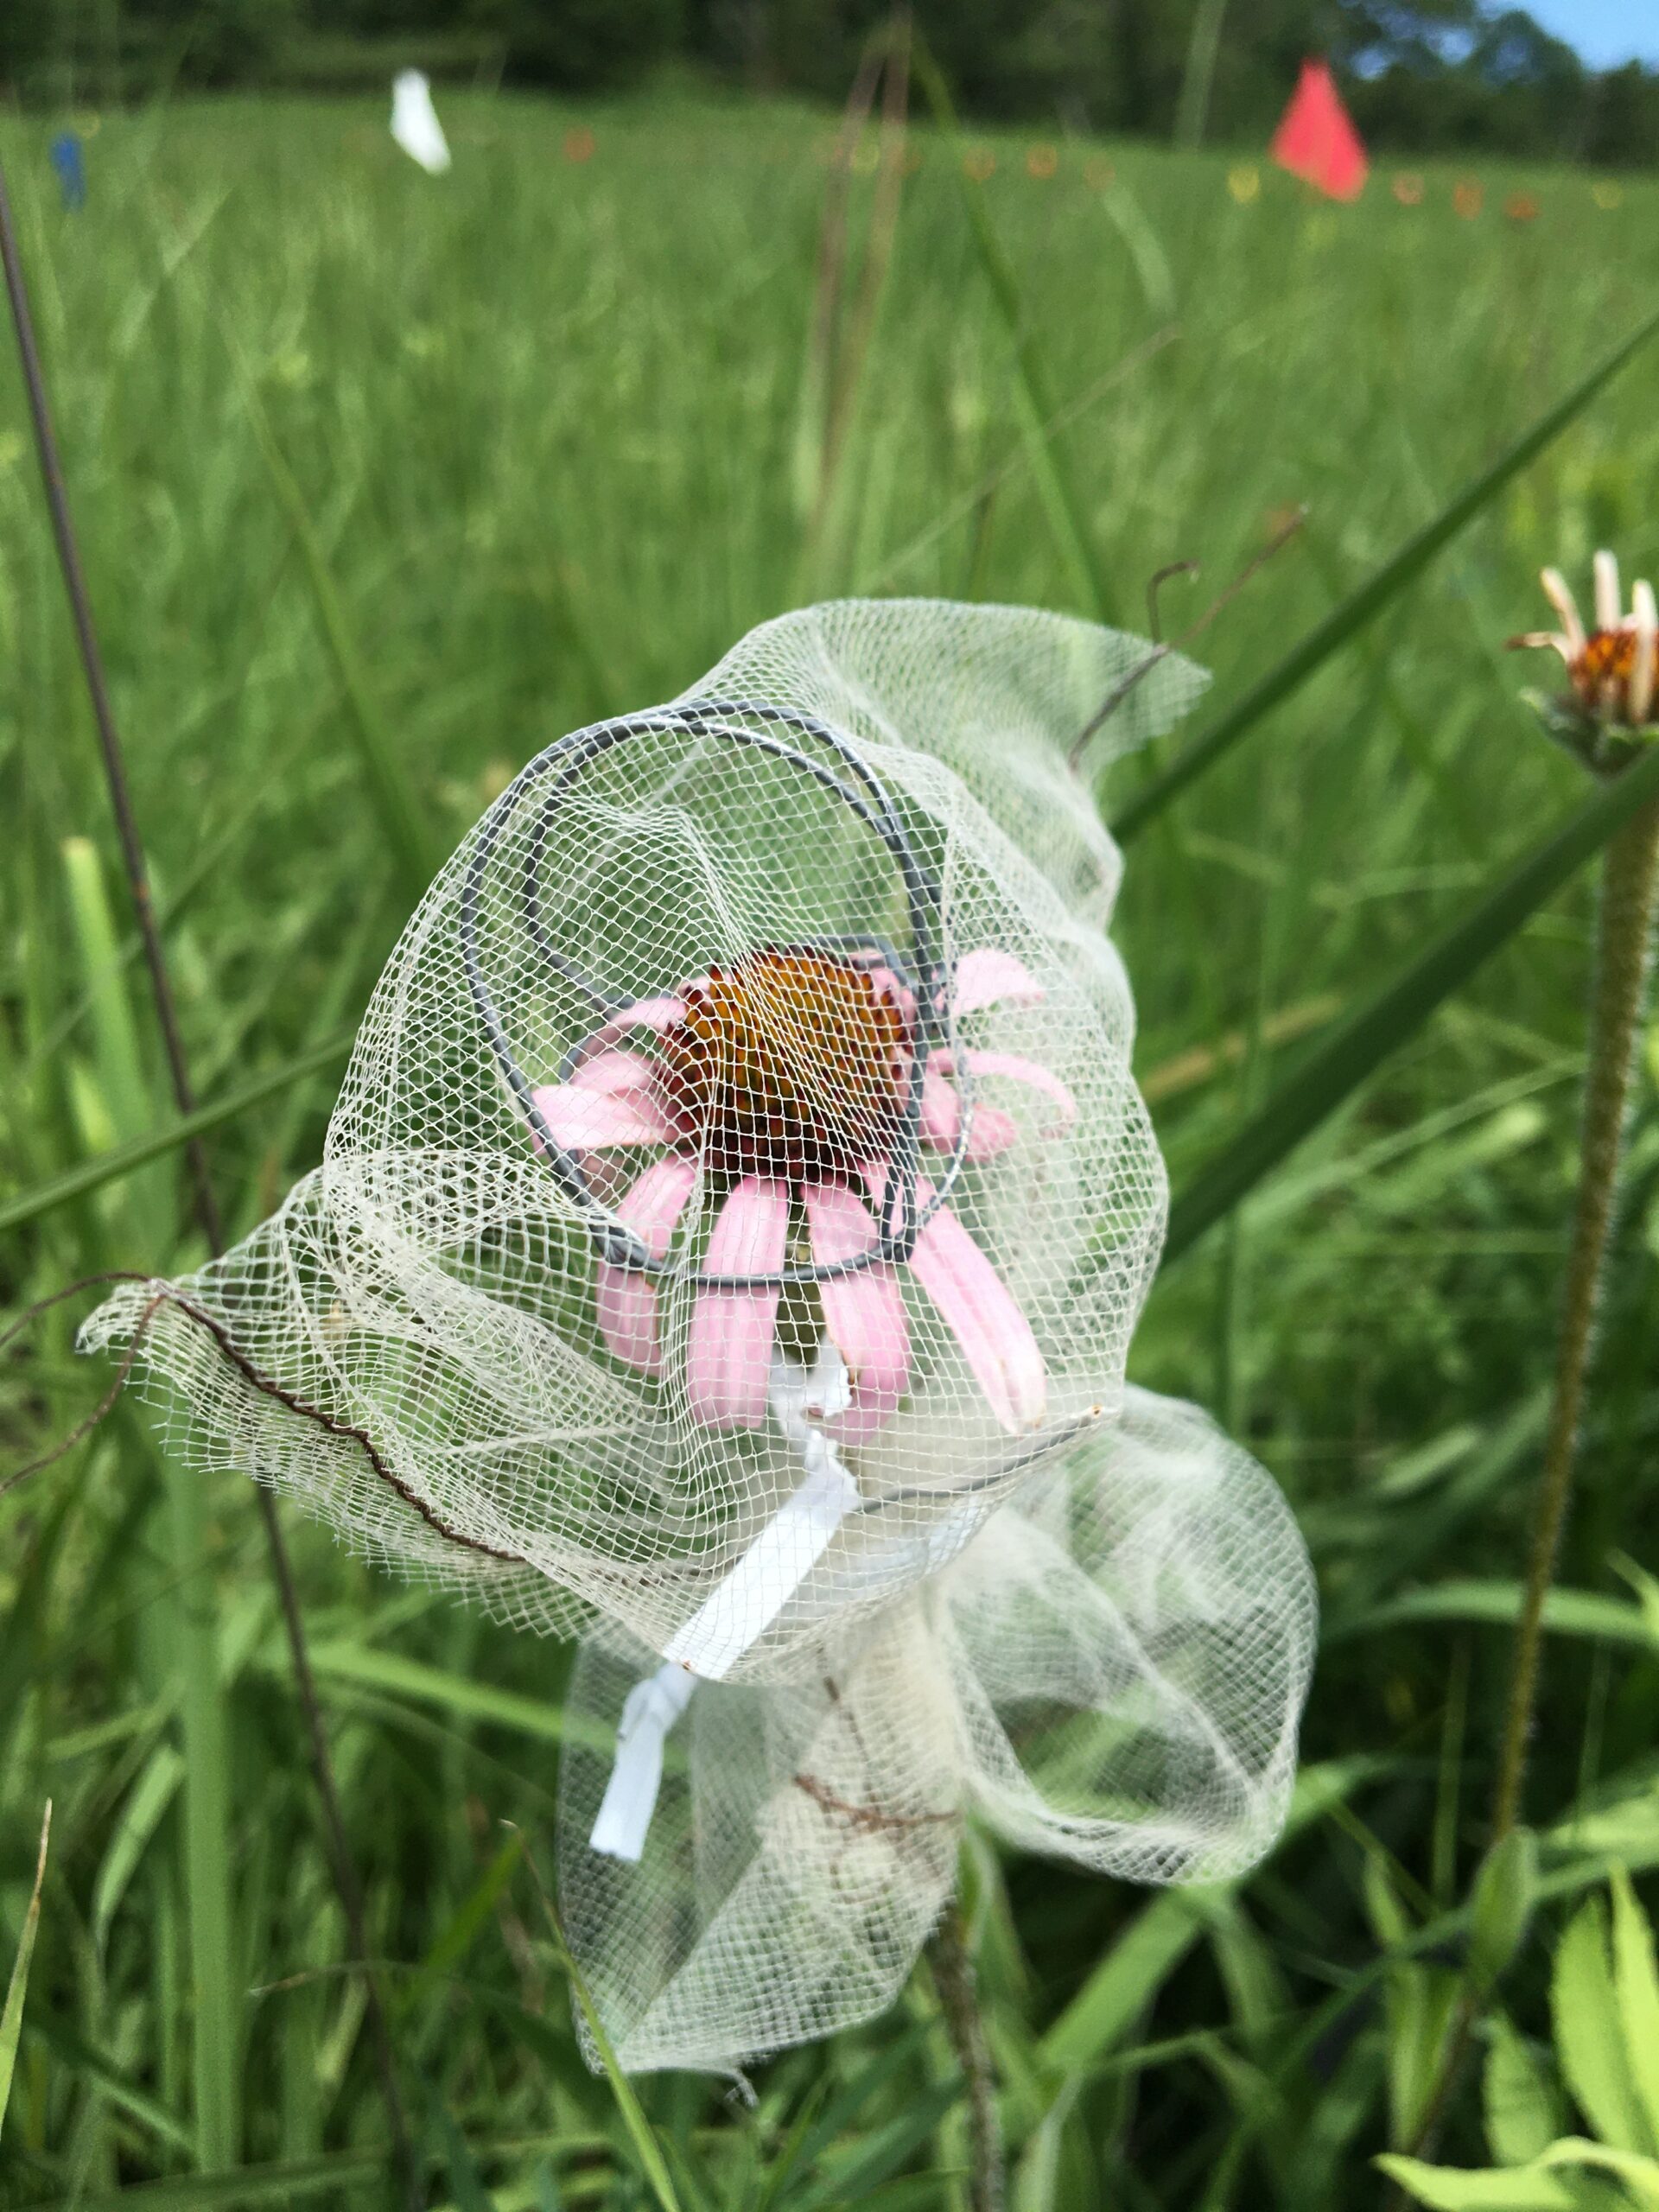
Collaborator and NDSU postdoc Grace Hirzel places pollinator exclusions bags on Echinacea heads in the remnants. If any of the plants in the polLim experiment from the non-control group had flowered this year, it would’ve looked like this!
You can find more information about the pollen addition and exclusion experiment and links to previous flog posts regarding this experiment at the background page for the experiment.
Reproduction in plants can be limited by access to pollen and resources. We previously found that Echinacea plants in the remnants are pollen limited, meaning that if they had access to more pollen, they would produce more seeds. However, the long-term effects of pollen limitation are unknown. Do plants that are super pollen saturated and have high amounts of pollen have a higher lifetime fitness than plants that are pollen limited? Also, we know that the plants in the remnants are pollen limited, but are the plants in the common garden environment also pollen limited? To answer these questions and more, 13 years ago Gretel randomly selected 39 plants from p1; half of these plants were randomly assigned to the pollen addition group, and the others were assigned to pollen exclusion. Every year, plants in the pollen exclusion have their heads bagged and they are not pollinated, while we hand cross every style in the pollen addition group.
In the summer of 2023, six of the original 39 plants were flowering, three from the addition treatment and three from the exclusion treatment. The exclusion treatment plants were covered with exclusion bags to prevent pollination, and the addition plants were hand-pollinated three times throughout the summer.
Start year: 2012
Location: exPt01
Physical specimens: 6 heads harvested from group receiving treatments, and an additional 18 heads harvested from plants in an open, control treatment. Heads are at the Chicago Botanic Garden awaiting processing
Data collected: Plant survival and measurements were recorded as part of our annual surveys in P1 and eventually will be found in the echinaceaLab R package. Data sheets were scanned and entered and can be found here: “~/Dropbox/CGData/115_pollenLimitation/pollenLimitation2023”
You can find more information about the pollen addition and exclusion experiment and links to previous flog posts regarding this experiment at the background page for the experiment.
Every year since 1996, Team Echinacea members record flowering phenology, taking measuring data and harvest heads of thousands of Echinacea angustifolia plants in common garden experiments. These experimental plots are prairie restorations and abandoned agriculture fields that are managed as grassland habitat. Some plots have multiple ongoing experiments within. Currently, the Echinacea Project currently has 10 established experimental plots.
This project status report will contain updates on experimental plots 1, 2, 4, 5 and 8, as well as management updates for all plots. Specific reports for the remaining experimental plots can be found on separate posts including Amy Dykstra’s plot (exPt03), the hybrid plots (exPt06, exPt07, exPt09), and the West Central Area common garden (exPt10).
exPt01: Experimental plot 1 was first planted in 1996 (cleverly termed the 1996 cohort), and has been planted with nine other experiments in subsequent years, with the most recent planting being Amy Waananen’s inter-remnant crosses. It is the largest of the experimental plots, with over 10,000 planted positions; experiments in the plot include testing fitness differences between remnants (1996, 1997, 1999), quantifying effects of inbreeding (inb1, inb2), and assessing quantitative genetic variation (qgen1). There are also a number of smaller experiments in it, including fitness of Hesperostipa spartea, aphid addition and exclusion, and pollen addition and exclusion (the last experiment was continued the summer of 2023 and will have separate update posts). In 2023, we visited 3,699 of the 10,992 positions planted and found 3,118 alive. 560 plants were classified as “flowering” in exPt01 this year. This is a little less than half of the plants that flowered in summer 2022 (1,111) – an interesting note considering exPt01 was burned the spring of both 2022 and 2023. In summer 2023, we harvested 796 total Echinacea heads in exPt01. We also added 270 additional staples to the experimental plot this year, signifying positions were a living plant has not been found for over three years.
Some numbers for experiments within exPt01
Inb1: The INB1 experiment investigates the relationship between inbreeding level and fitness in Echinacea angustifolia. Each plant in experiment INB1 originates from one of three cross types, depending on the relatedness of the parents: between maternal half siblings; between plants from the same remnant, but not sharing a maternal or paternal parent; and between individuals from different remnants. All individuals were planted in 2001. We continued to measure fitness and flowering phenology in these plants. In 2023, of the original 557 plants in INB1, 85 were still alive. Of the plants that were alive this year, 24 of them were flowering; this count is down from summer of 2022 where 40 of the plants were flowering.
qgen: The qGen1 (quantitative genetics) experiment in p1 was designed to quantify the heritability of traits in Echinacea angustifolia. We are especially interested in Darwinian fitness. Could fitness be heritable? During the summer of 2002 we crossed plants from the 1996 & 1997 cohorts of exPt01. We harvested heads, dissected achenes, and germinated seeds over the winter. In the spring of 2003 we planted the resulting 4468 seedlings (this great number gave rise to this experiment’s nickname “big batch”). 1,417 plants in qGen1 were alive in 2023. Of those plants, 298 flowered this summer.
Other plots:
exPt02: To examine the role flowering phenology plays in the reproduction of Echinacea angustifolia, Jennifer Ison planted this plot in 2006 with 3,961 individuals selected for extreme (early or late) flowering timing, or phenology. Using this phenological data, we explore how flowering phenology influences reproductive fitness and estimate the heritability of flowering time in E. angustifolia. In the summer of 2023, we visited 1,855 positions of the 3,961 positions originally planted. We measured 1,283 living plants, of which 118 were flowering, with a total of 148 flowering heads. In the fall, we harvested 67 heads from exPt02. The large difference between the number of heads and the number harvested has to do with high levels of seed predation, mainly by ground squirrels. Last year, Will, Jennifer, and other members of Team Echinacea published a paper in the American Journal of Botany using data from exPt02 – check it out here! Location: Hegg Lake WMA
exPt04: Experimental plot 4 was planted to gauge whether Echinacea from small remnant populations could be genetically rescued via an outcross to larger, more genetically diverse populations. Caroline Ridley and other members planted this plot in 2008. We did not visit exPt04 this year. Location: Hegg Lake WMA
exPt05: The only experimental plot planted at Staffanson Prairie Preserve (SPP), exPt05, was planted to compare progeny of maternal plants from burned and unburned sections of SPP. There were 2800 plants planted originally, but high mortality made it impractical to visit the plot row-by-row. Now, we and treat the plot like demography. We use our survey-grade GPS to find plants in exPt05 that have previously flowered and add more plants to the stake file if new plants in the plot flower. In 2023 we found 11 living plants, none of which were flowering! We did locate one new flowering plant within the plot boundaries. Location: Staffanson Prairie Preserve
exPt08: Team Echinacea established quantitative genetics experiments to quantify additive genetic variance of fitness in Echinacea, with the idea that we can estimate evolutionary potential of study populations. The maternal parents of qGen2 and qGen3 are plants in the 1996, 1997, and 1999 cohorts. These plants were crossed with pollen from plants in remnants to produce seed for qGen2 and qGen3, which now inhabit exPt08. Originally, 12,813 seeds were sown in the common garden. Seeds from the same cross (shared maternal and paternal plants) were sown in meter-long segments between nails. A total of 3,253 seedlings were originally found, but only 385 plants were found alive in 2023. There were 15 flowering plants in 2023, and 15 heads. On a side note, one additional flowering plant was found in t-plot, and we harvested three heads from that. Location: Wagenius property
Experimental plot management:
Burned exPt01 (3 May 2023) and exPt08 (17 May 2023)
Replanted pedicularis in exPt01 and exPt10, augmenting Drake’s experimental treatments (replaced ones that died)
Broadcast seed in p8 after the spring burn and in the fall, including Comandra umbellata
Stuart trimmed flowering A. gerardii and S. nutans just north of tplot
Some plots in hegg (not exPt02) got run over by heavy machinery
We did not:
Treat sumac
Weed in exPt01 (except hawkweed)
Treat ash in exPt08, but we noticed that ash south of plot responded favorably to last year’s treatment
Details
Start year: Differs between experiment, see above. First ever experimental plot was in 1996.
Location: Differs between experiment, see above.
Overlaps with: …everything!
Data collected: Raw measuring data can be found in cgData repository. Processed data will be uploaded to SQL database. Currently, SQL database has measuring data up until 2022.
Samples or specimens collected: See above for total harvested heads in each plot.
Products: Many publications and independent projects.
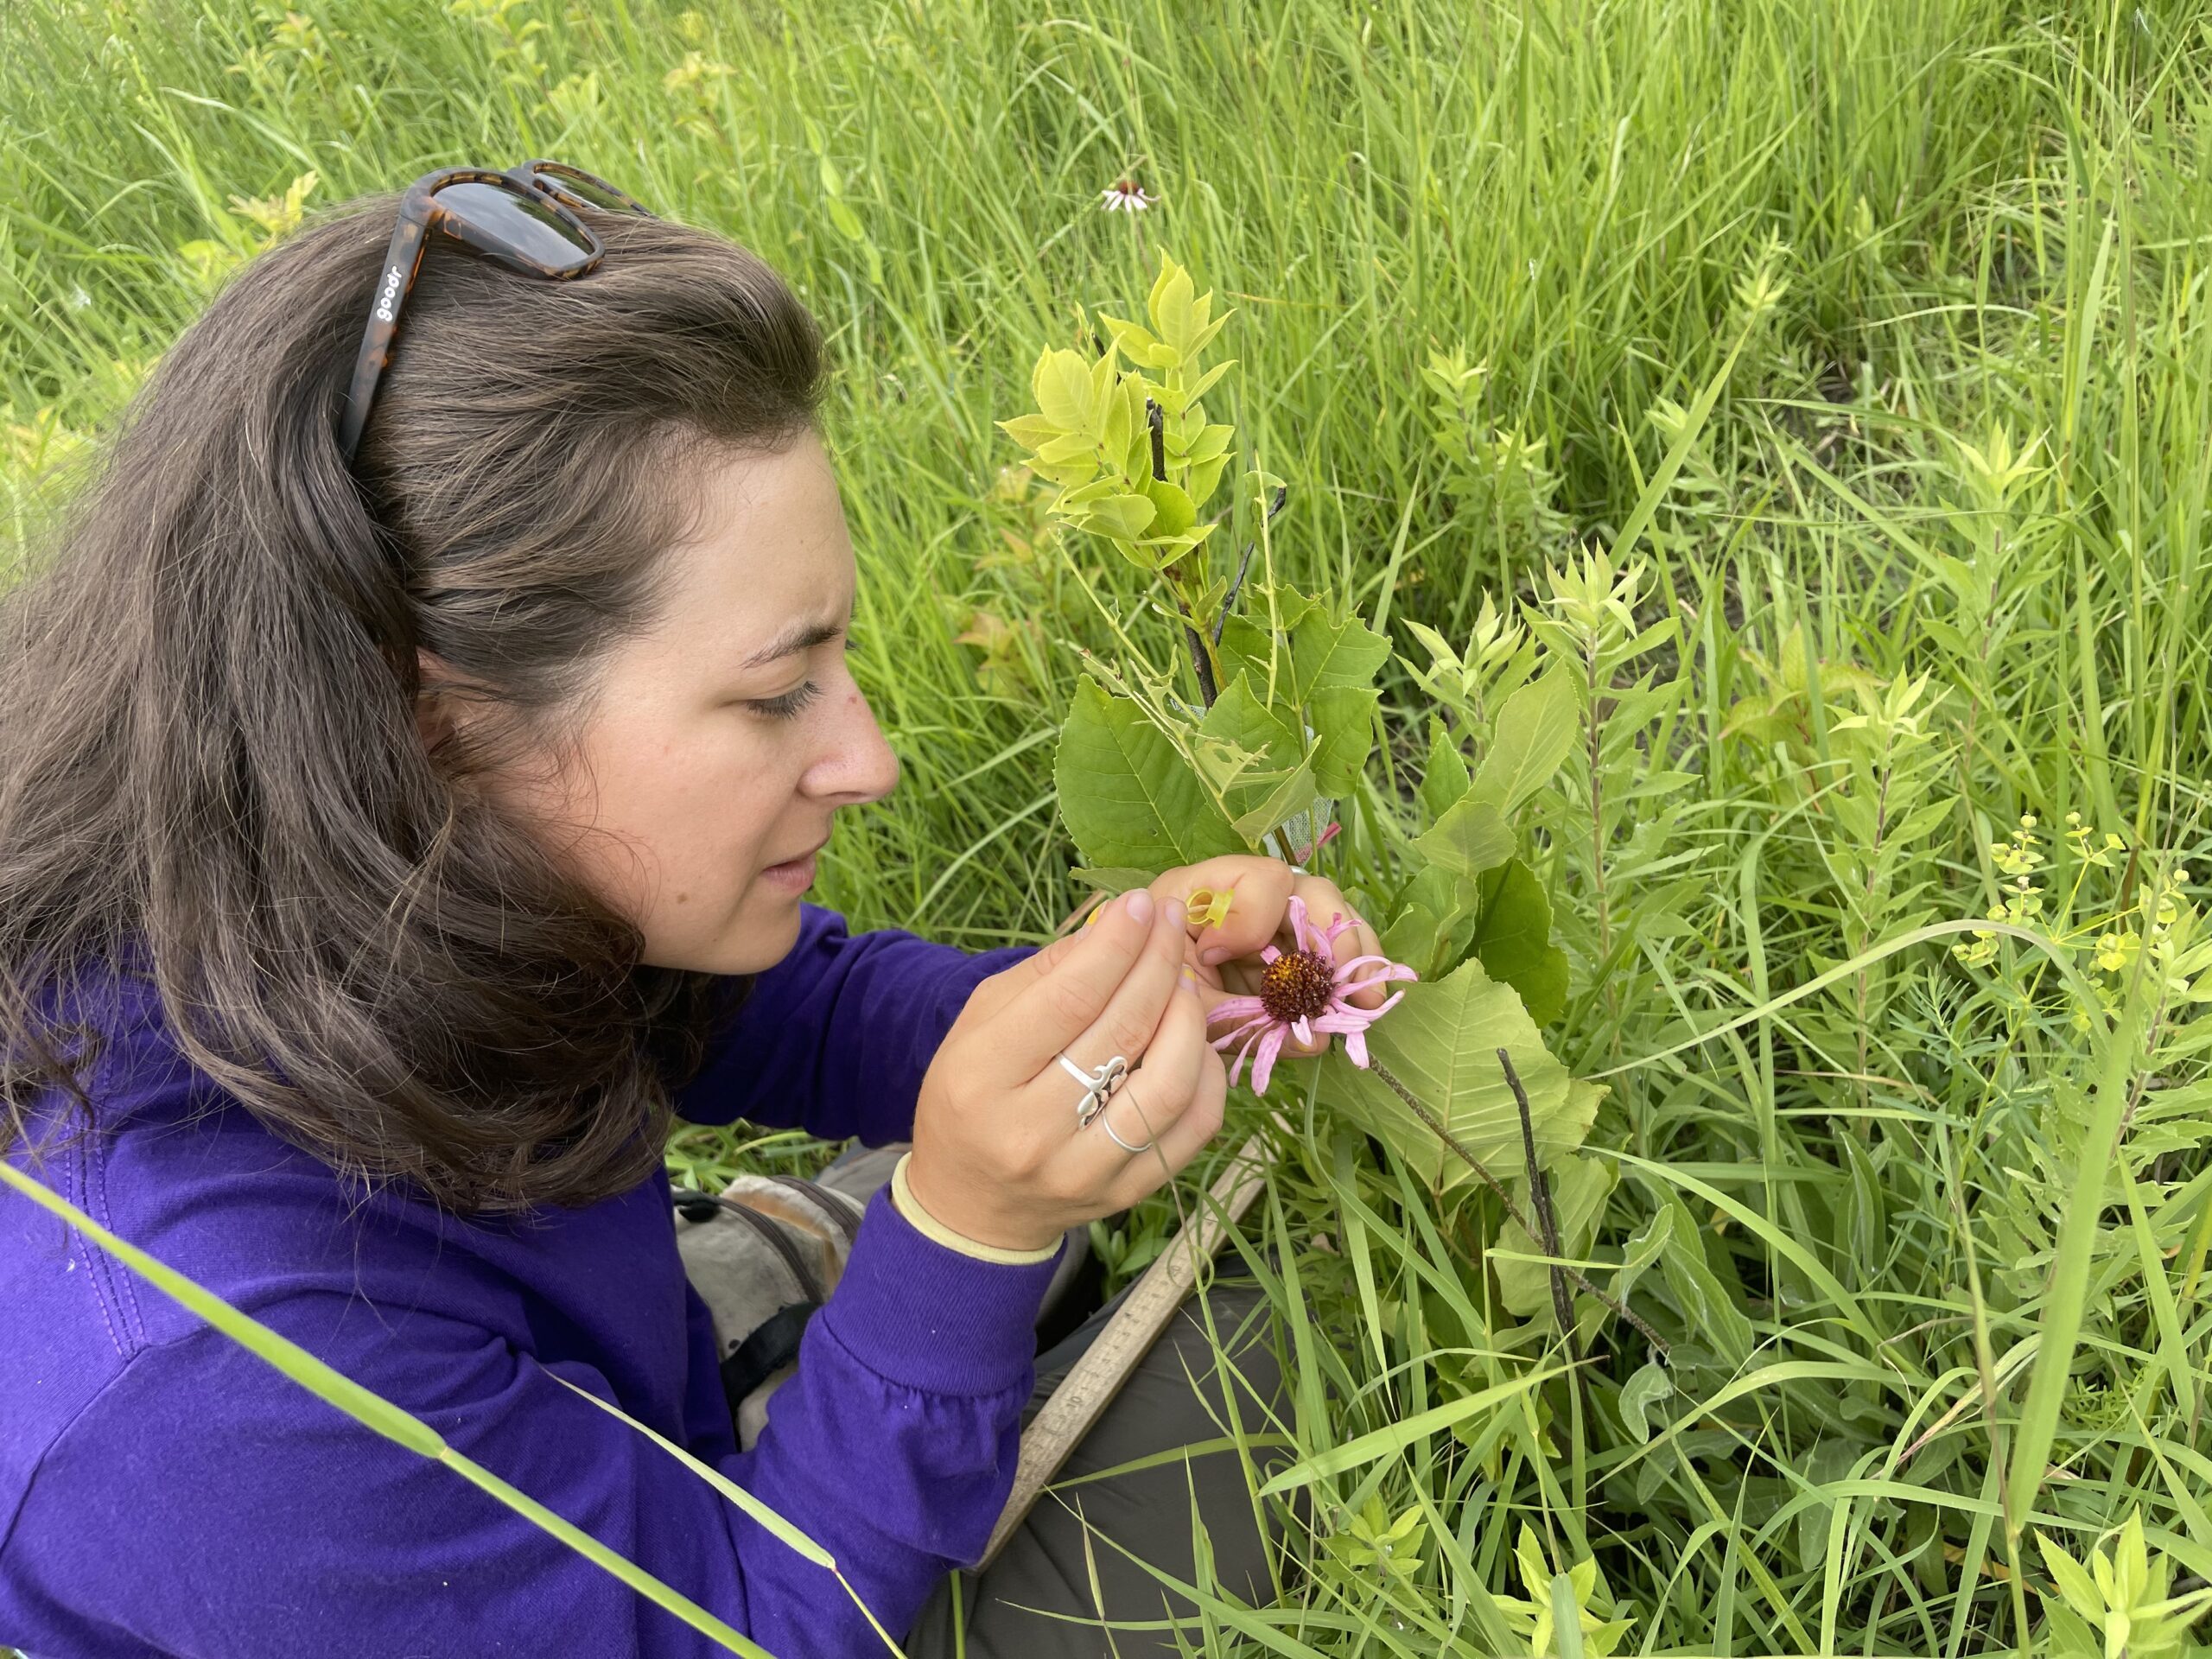
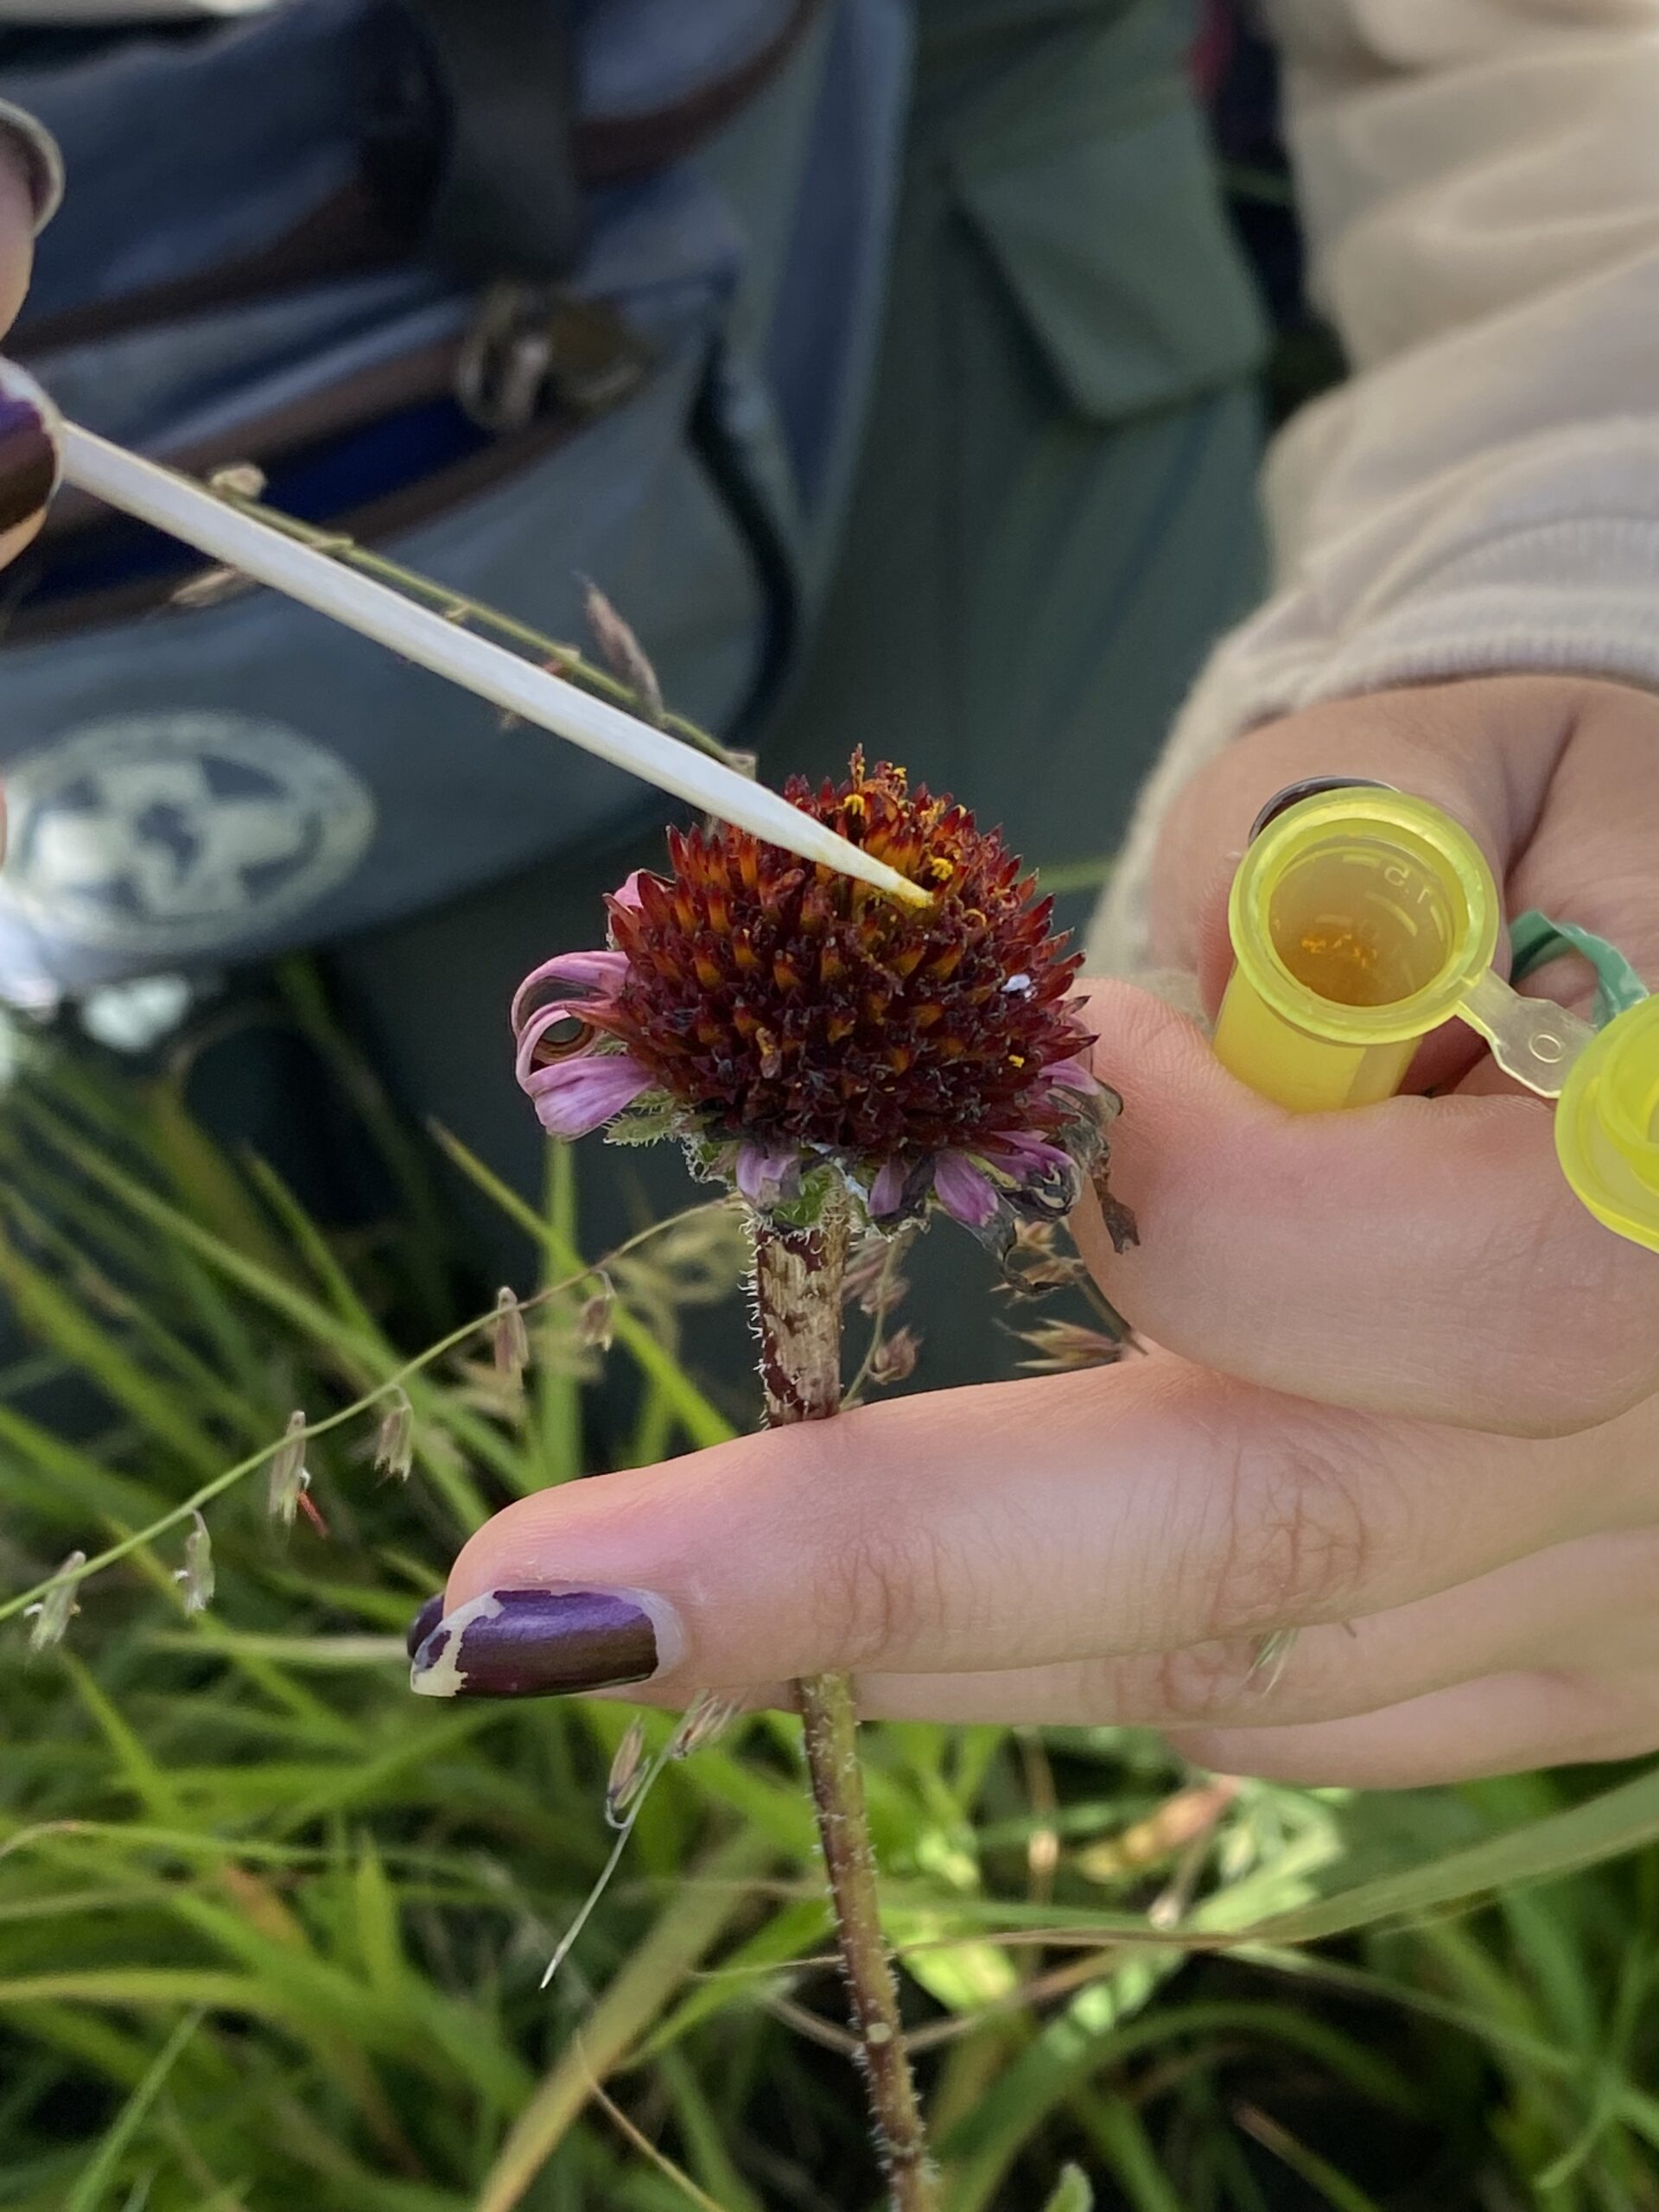
Reproduction in plants can be limited by access to pollen and resources. We previously found that Echinacea plants in the remnants are pollen limited, meaning that if they had access to more pollen, they would produce more seeds. However, the long-term effects of pollen limitation are unknown. Do plants that are super pollen saturated and have high amounts of pollen have a higher lifetime fitness than plants that are pollen limited? Also, we know that the plants in the remnants are pollen limited, but are the plants in the common garden environment also pollen limited? To answer these questions and more, 10 years ago Gretel randomly selected 38 plants from experimental plot 1; half of these plants were randomly assigned to the pollen addition group, and the others were assigned to pollen exclusion. Every year, plants in the pollen exclusion have their heads bagged and they are not pollinated, while we hand cross every style in the pollen addition group (See photos for reference).
In the summer of 2022, 24 of the original 38 plants were found to be living. 6 plants of the addition group were flowering with a total of 17 heads. They received hand pollination throughout their flowering time. 6 plants of the exclusion group were flowering and they received pollinator exclusion bags to remain un-pollinated during their flowering time.
Start year: 2012
Location: exPt 1
Specimens collected: 64 heads were harvested from the addition, exclusion and control group in the 2022 field season.
Data collected: Plant survival and measurements were recorded as part of our annual surveys in P1 and eventually will be found in the R package EchinaceaLab. Data sheets were scanned and entered and can be found here: “~/Dropbox/CGData/115_pollenLimitation/pollenLimitation2022”
You can find more information about the pollen addition and exclusion experiment and links to previous flog posts regarding this experiment at the background page for the experiment.
A pollen exclusion plant with a pollinator exclusion net from the pollen exclusion group. These plants wear crowns 👑Sophia conducting hand pollination on one of the plants in the addition group.
Reproduction in plants can be limited by access to pollen and resources. We previously found that Echinacea plants in the remnants are pollen limited, meaning that if they had access to more pollen, they would produce more seeds. However, the long-term effects of pollen limitation are unknown. Do plants that are super pollen saturated and have high amounts of pollen have a higher lifetime fitness than plants that are pollen limited? Also, we know that the plants in the remnants are pollen limited, but are the plants in the common garden environment also pollen limited? To answer these questions and more, 13 years ago Gretel randomly selected __ plants from p1; half of these plants were randomly assigned to the pollen addition group, and the others were assigned to pollen exclusion. Every year, plants in the pollen exclusion have their heads bagged and they are not pollinated, while we hand cross every style in the pollen addition group.
In the summer of 2021, 23 of the original 39 plants were found to be basal. There were no flowering plants this year, so no crosses occurred.
Start year: 2012
Location: exPt1
Physical specimens: No heads were harvested in 2021.
Data collected: Plant survival and measurements were recorded as part of our annual surveys in P1 and eventually will be found in the R package EchinaceaLab. Data sheets were scanned and entered and can be found here: “~/Dropbox/CGData/115_pollenLimitation/pollenLimitation2021”
You can find more information about the pollen addition and exclusion experiment and links to previous flog posts regarding this experiment at the background page for the experiment.
Reproduction in plants can be limited by access to pollen and resources. We previously found that Echinacea plants in the remnants are pollen limited, meaning that if they had access to more pollen they would produce more seeds. However, the long-term effects of pollen limitation are unknown. Do plants that are super pollen saturated and have high amounts of pollen have a higher lifetime fitness than plants that are pollen limited? Also, we know that the plants in the remnants are pollen limited but are the plants in the common garden environment also pollen limited? To answer these questions and more 13 years ago Gretel randomly selected __ plants from p1 half of these plants were randomly assigned to the pollen addition group and the others were assigned to pollen exclusion. Every year, plants in the pollen exclusion have their heads bagged and they are not pollinate, where we hand cross every style in the pollen addition group.
In the summer of 2020, 27 of the original 39 plants were found to be alive 13 of the alive plants were in the pollen exclusion treatment and 14 were in the pollen addition treatment. There were nine plants that flowered, 5 were in the addition group with 12 heads, and 4 in the exclusion group with 6 heads.
Start year: 2012
Location: exPt1
Physical specimens: We harvested 18 heads, these heads are at CBG and have been inventoried and are waiting to be cleaned.
Data collected: Plants survival and measurements were recorded as part of our annual surveys in P1 and eventually will be found in the R package EchinaceaLab. Data sheets were scanned and entered and can be found here: “~/Dropbox/CGData/115_pollenLimitation/pollenLimitation2020”
You can find more information about the pollen addition and exclusion experiment and links to previous flog posts regarding this experiment at the background page for the experiment.
Supplemental pollen — pollen that an Echinacea head might not otherwise receive—could increase a plant’s fitness. But does this extra pollination lead to a tradeoff in survival or flowering consistency? Since 2012, we have been manipulating the amount of pollen Echinacea plants receive – either no pollen, or lots of pollen – and recording how this affects their fitness and survival. In 2012 and 2013 we identified flowering E. angustifolia plants in experimental plot 1 and randomly assigned one of two treatments to each: pollen addition or pollen exclusion. The team bagged the heads of all plants and hand-pollinated the addition treatment, and did not manipulate the exclusion plants further. Plants receive the same treatment across years.
In summer 2018, 14 of the 26 plants alive in the pollen addition and exclusion experiment flowered, producing a total of 25 heads. This year none of those plants flowered. Of the original 38 plants in this experiment, 12 of the exclusion plants and 14 of the pollen addition plants are still alive. No plants died between 2018 and 2019. This year’s data were unique among the eight years of data collected, because not a single plant in the experiment produced even a single head. The dramatic decrease in flowering rates this year may help or hinder us in analyzing this data set and providing answers to this eight-year question.
Tris did not find significant demographic differences between plants which received pollen exclusion, addition or open pollination treatments.
Start year: 2012
Location: exPt1
Physical specimens: We harvested no specimens this year
Data collected: Plants survival and measurements were recorded as part of our annual surveys in P1 and can be found with the rest of the P1 data in the R package EchinaceaLab.
Michael presented a poster on the polLim experiment at MEEC
2019, which you can find here
Tris also presented a poster on polLim at MEEC 2019, which you can find here
You can find more information about the pollen addition and
exclusion experiment and links to previous flog posts regarding this
experiment at the background page for the experiment.
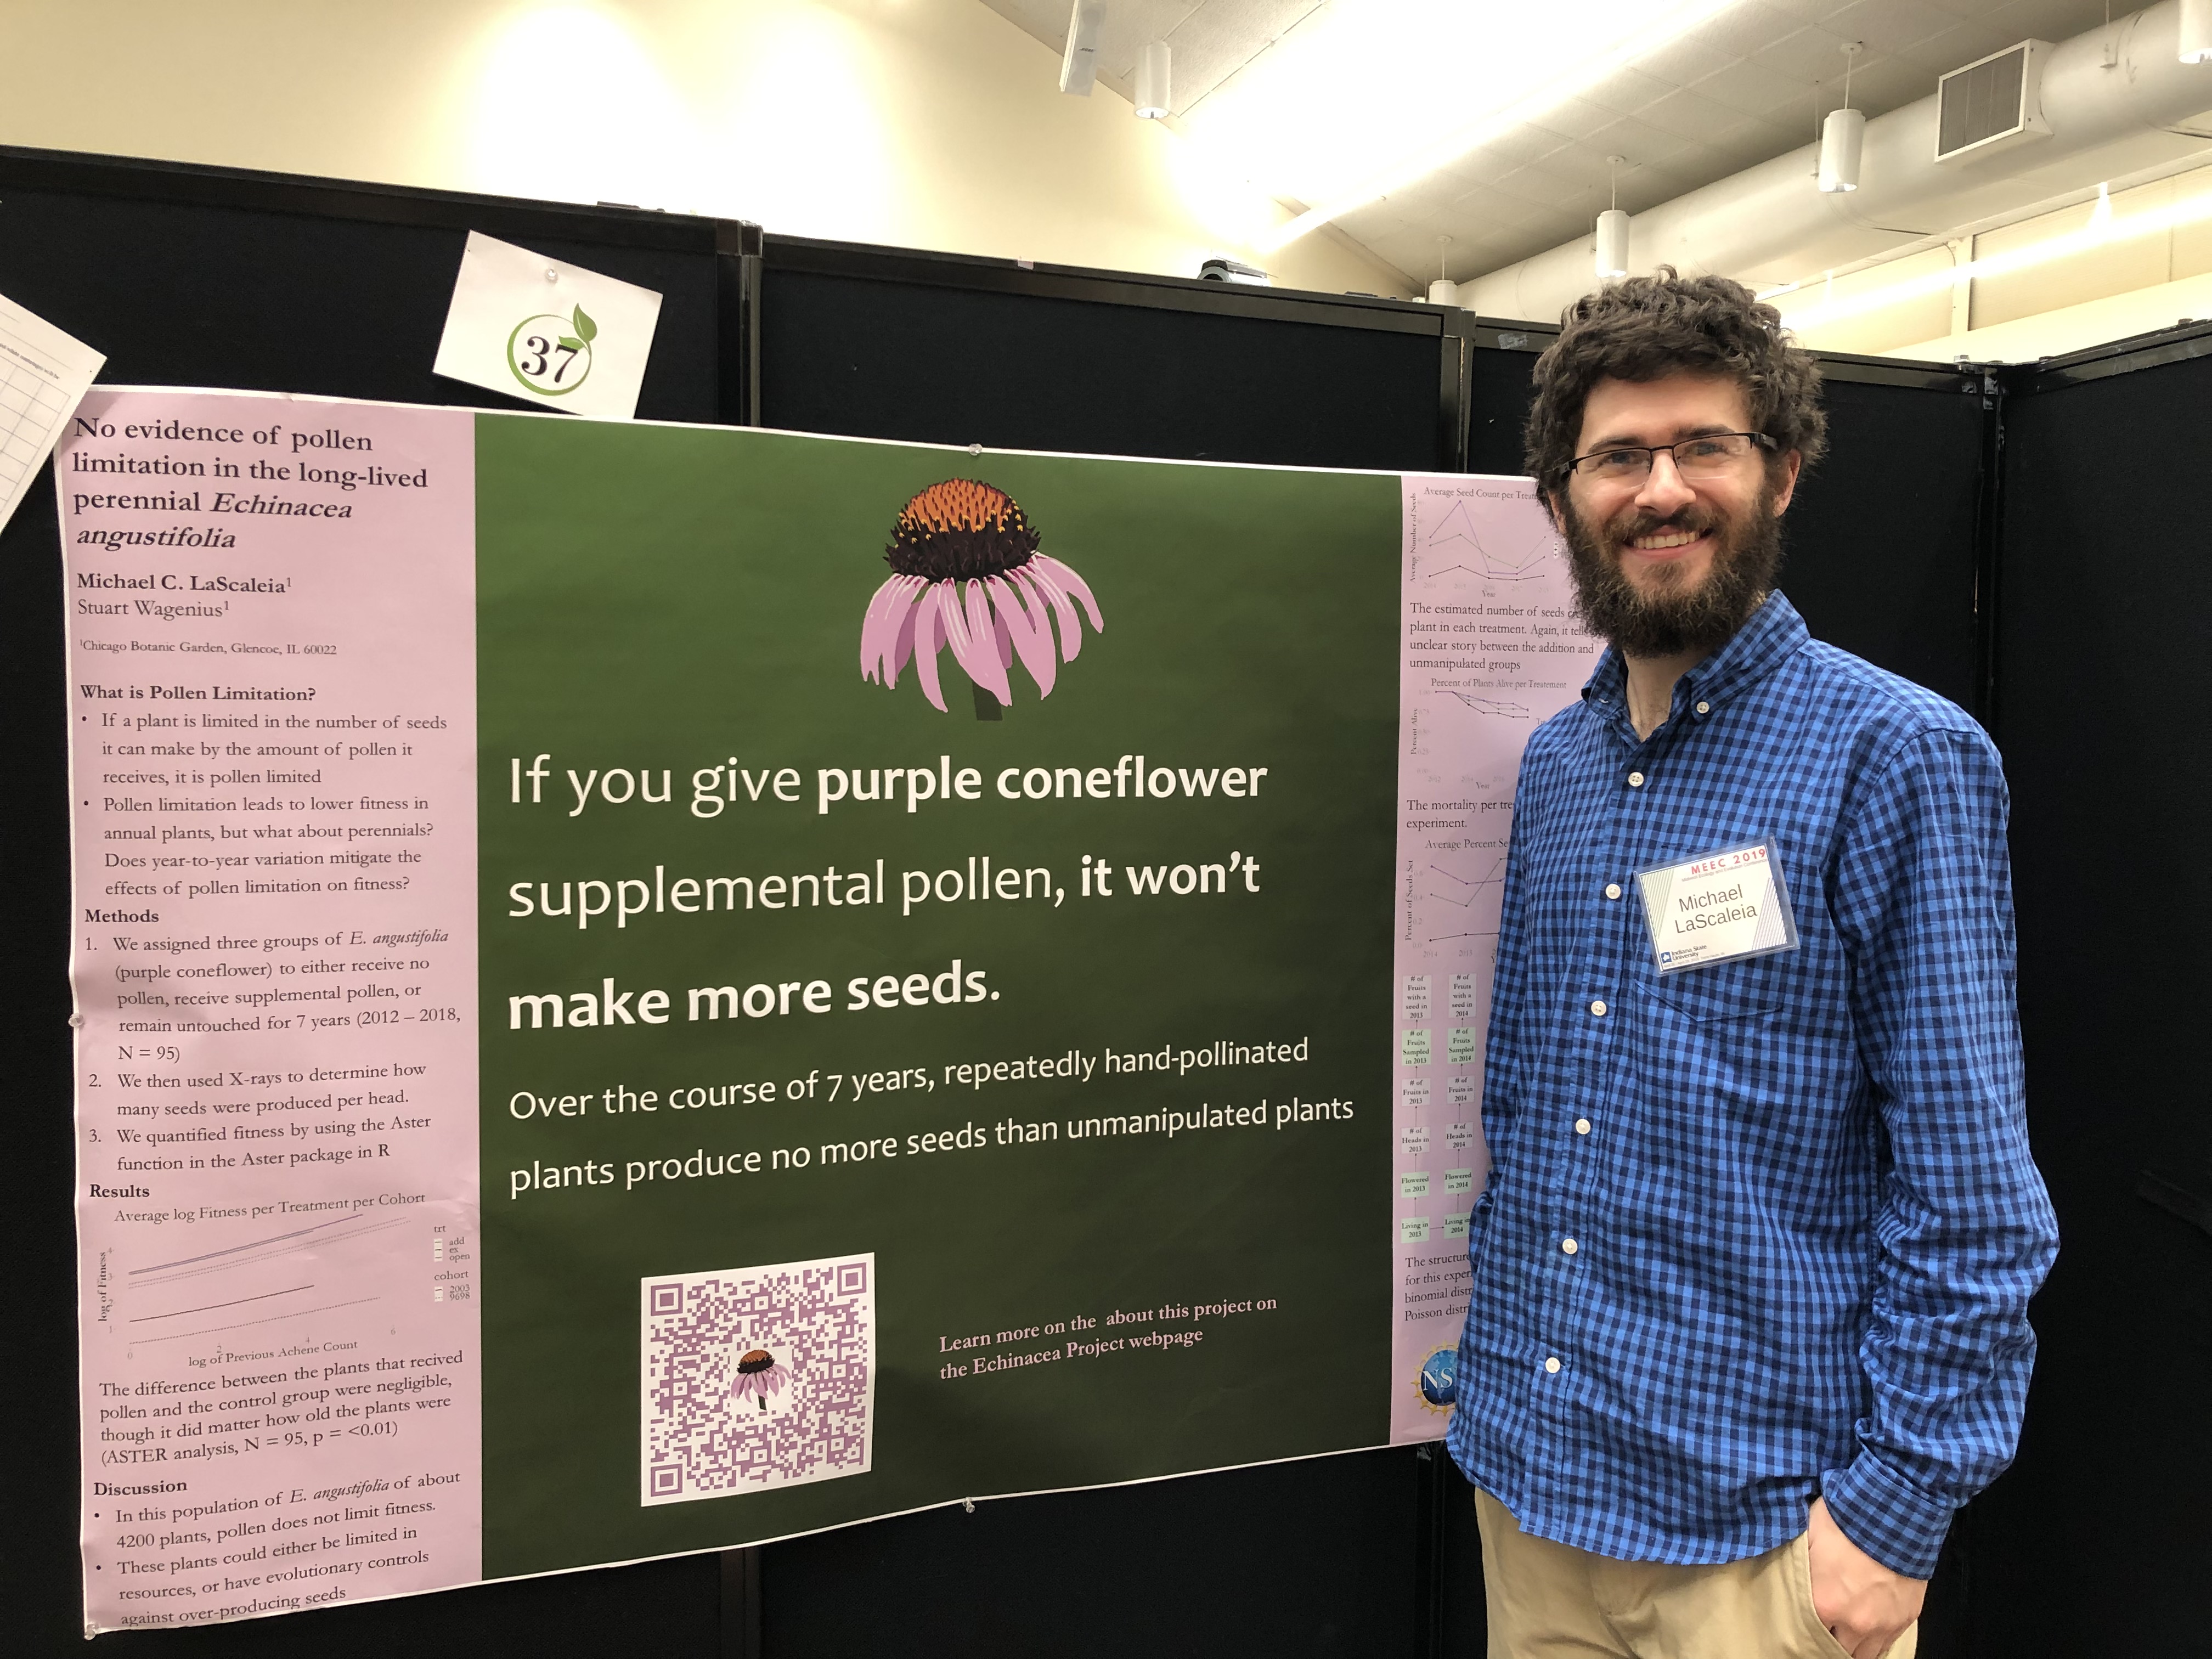
Like Tris, I am also presenting work related to pollen limitation in Echinacea. For my project, I simply tried to find whether pollen limitation is present in Echinacea or not. What I found – it’s not (though, after presenting this poster, there has been some controversy!). It just seems that echinacea produces as much seed as it can up to a certain limit, then stops, regardless of whether more styles were pollinated.
I went a little unorthodox with the way I designed this poster. Instead of the normal “wall of text” design, I instead opted to use the “better poster” design created by Mike Morrison. I really liked using this! It was so incredibly easy to make, and it really facilitated great conversations with everyone who stopped by poster slot #37. I’m very much looking forward to using this poster design each and every time I present from now on.
Michael with his pollen limitation poster
Title: No evidence of pollen limitation in the long-lived perennial Echinacea angustifolia
Presented at: MEEC 2019 at Indiana State University in Terre Haute, IN
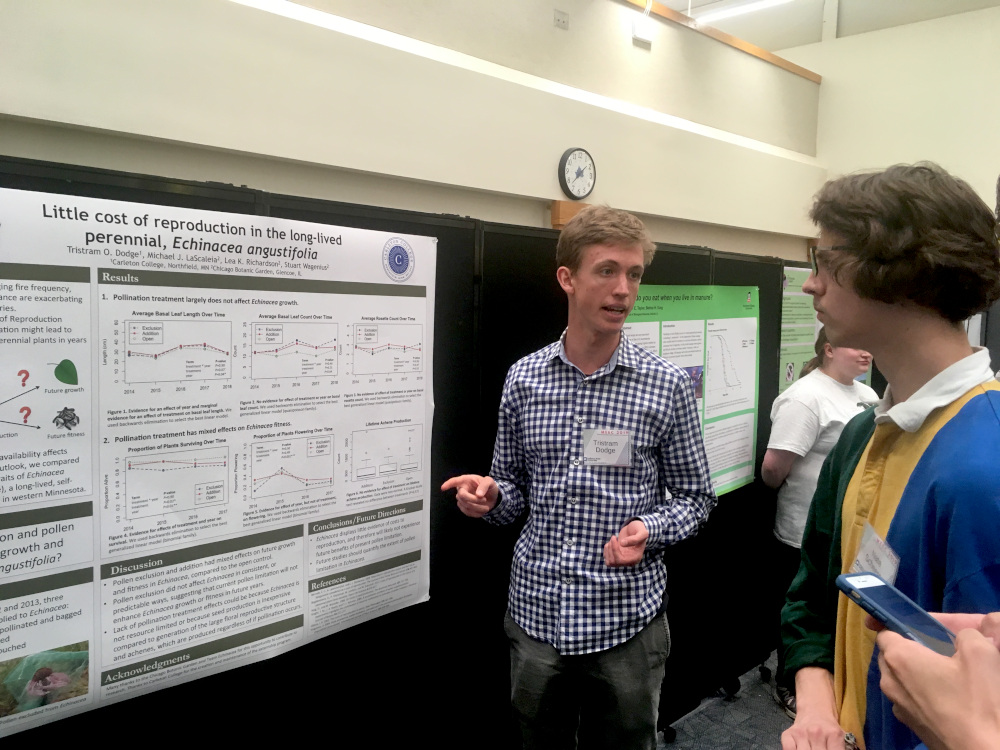
I’m back with more updates from our team trip to Terre Haute for MEEC 2019. Today, I want to show off the incredible pollen limitation study poster presented by Tris Dodge. Tris joined Team echinacea this last November when he was a Carleton Extern at the Chicago Botanic Garden for three weeks before winter break. As an intern, Tris did a lot of work gathering and analyzing data on our pollen limitation study. If you want to learn more about that study, check out our background page. If you want to see the work that Tris did specifically, check out the flog posts that he has written. Tris’s flog posts include a direct link to his poster
In his analysis, Tris found out that creating seeds is basically free for echinacea plants. If they produce a lot of seeds one year, they can produce a lot of seeds the next year as well. This was not what we had predicted! Tris used the data from 7 years of the pollen limitation study to show that plants that had zero reproduction did not turn into big-leafed, multi-head super plants, but instead look exactly the same as those heads that produced many achenes.
Tris presenting his poster to Nate
Title: Little cost of reproduction in the long lived perennial, Echinacea angustifolia
Presented at: MEEC 2019 at Indiana State University in Terre Haute, IN