Amy Waananen’s just had a paper published in New Phytologist. She reports how the difference in flowering time of a plant’s two parents influences the plant’s fitness. Many researchers have investigated how differences in the location of parents (close or far) influences progeny fitness. Few, if any, have investigated how differences in flowering time affects progeny fitness.
Differences in flowering time are not as straightforward as differences in location. In space, parents can be far or close and we use distance to measure it. To state the obvious, negative distances do not makes sense. In time, parents can be far (asynchronous) or near (synchronous). But maternal plants can be earlier or later than paternal plants. This aspect of distance in time is fundamentally different than distance in space. Amy used positive and negative values to indicate which parent flowered earlier. Remarkably, this perspective really mattered to the fitness of progeny. Wow!
Amy’s discovery is really cool, it’s a surprise, and it’s a useful contribution to basic science. Amy also suggested some non-intuitive management strategies that can help promote plant fitness and resilience of populations in the face of changing environments.
Here’s the citation:
Waananen, A., Ison, J.L., Wagenius, S. and Shaw, R.G. 2025. The fitness effects of outcrossing distance depend on parental flowering phenology in fragmented populations of a tallgrass prairie forb. New Phytologist. https://doi.org/10.1111/nph.70240
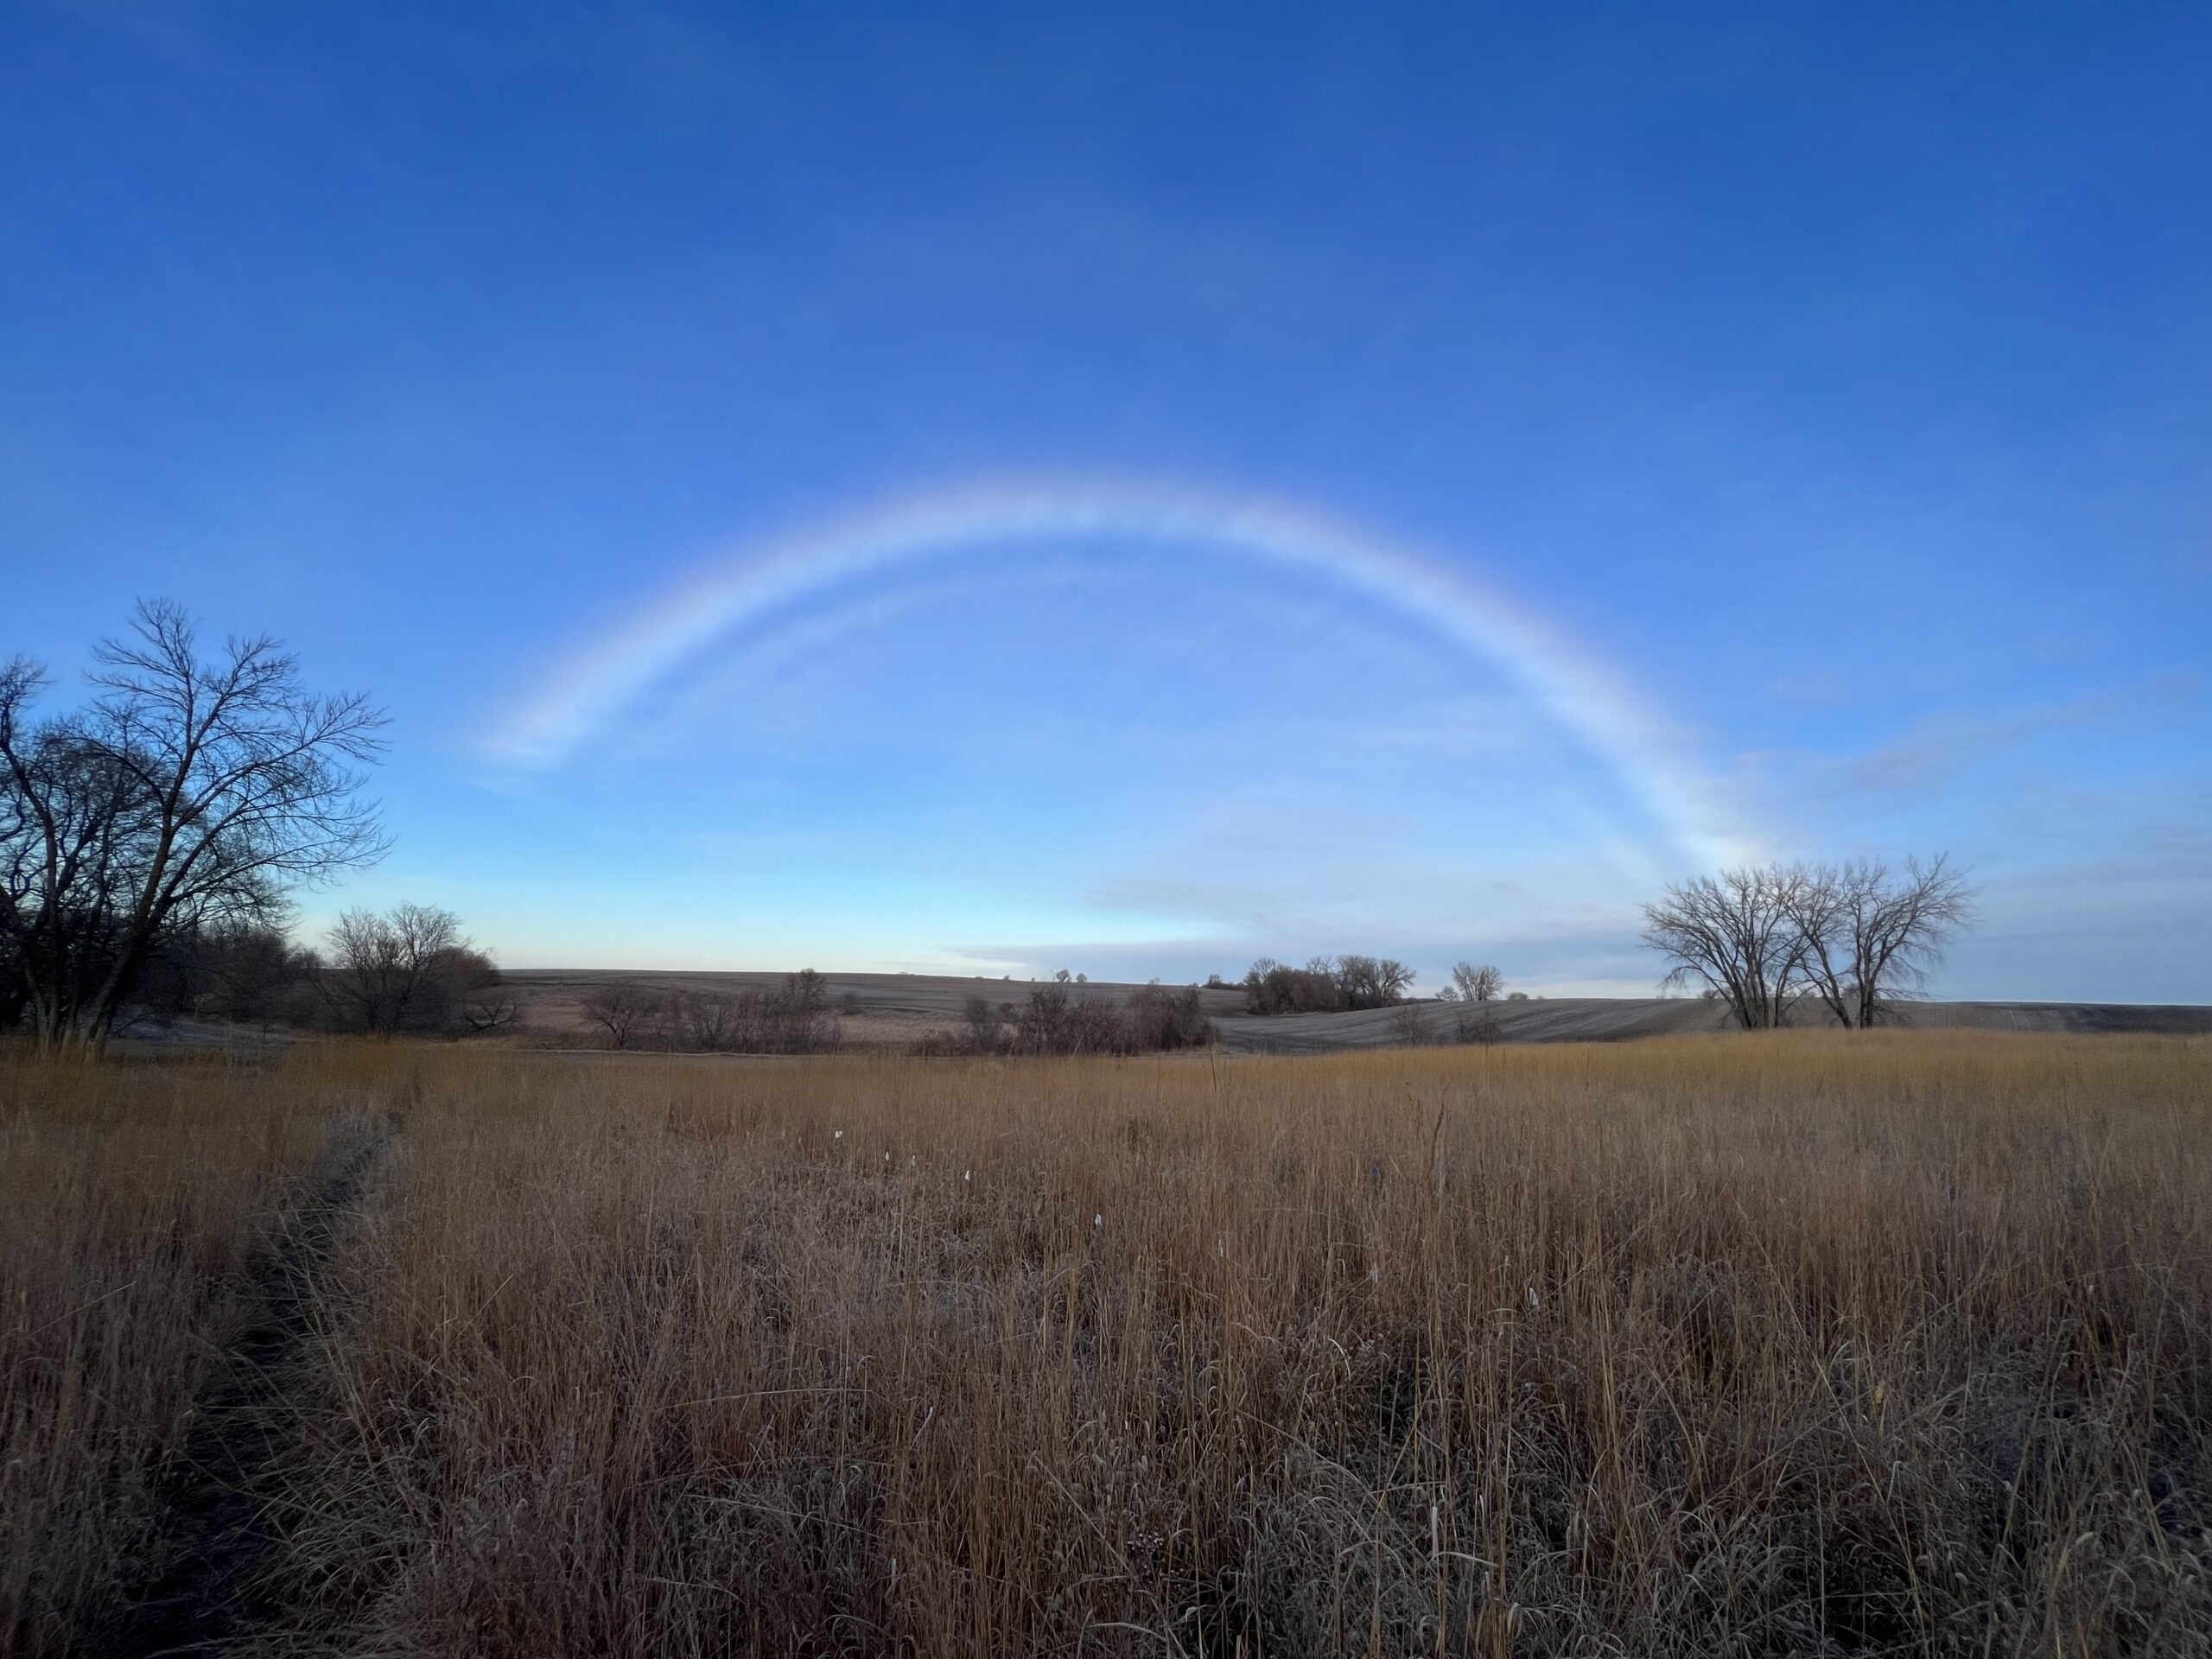
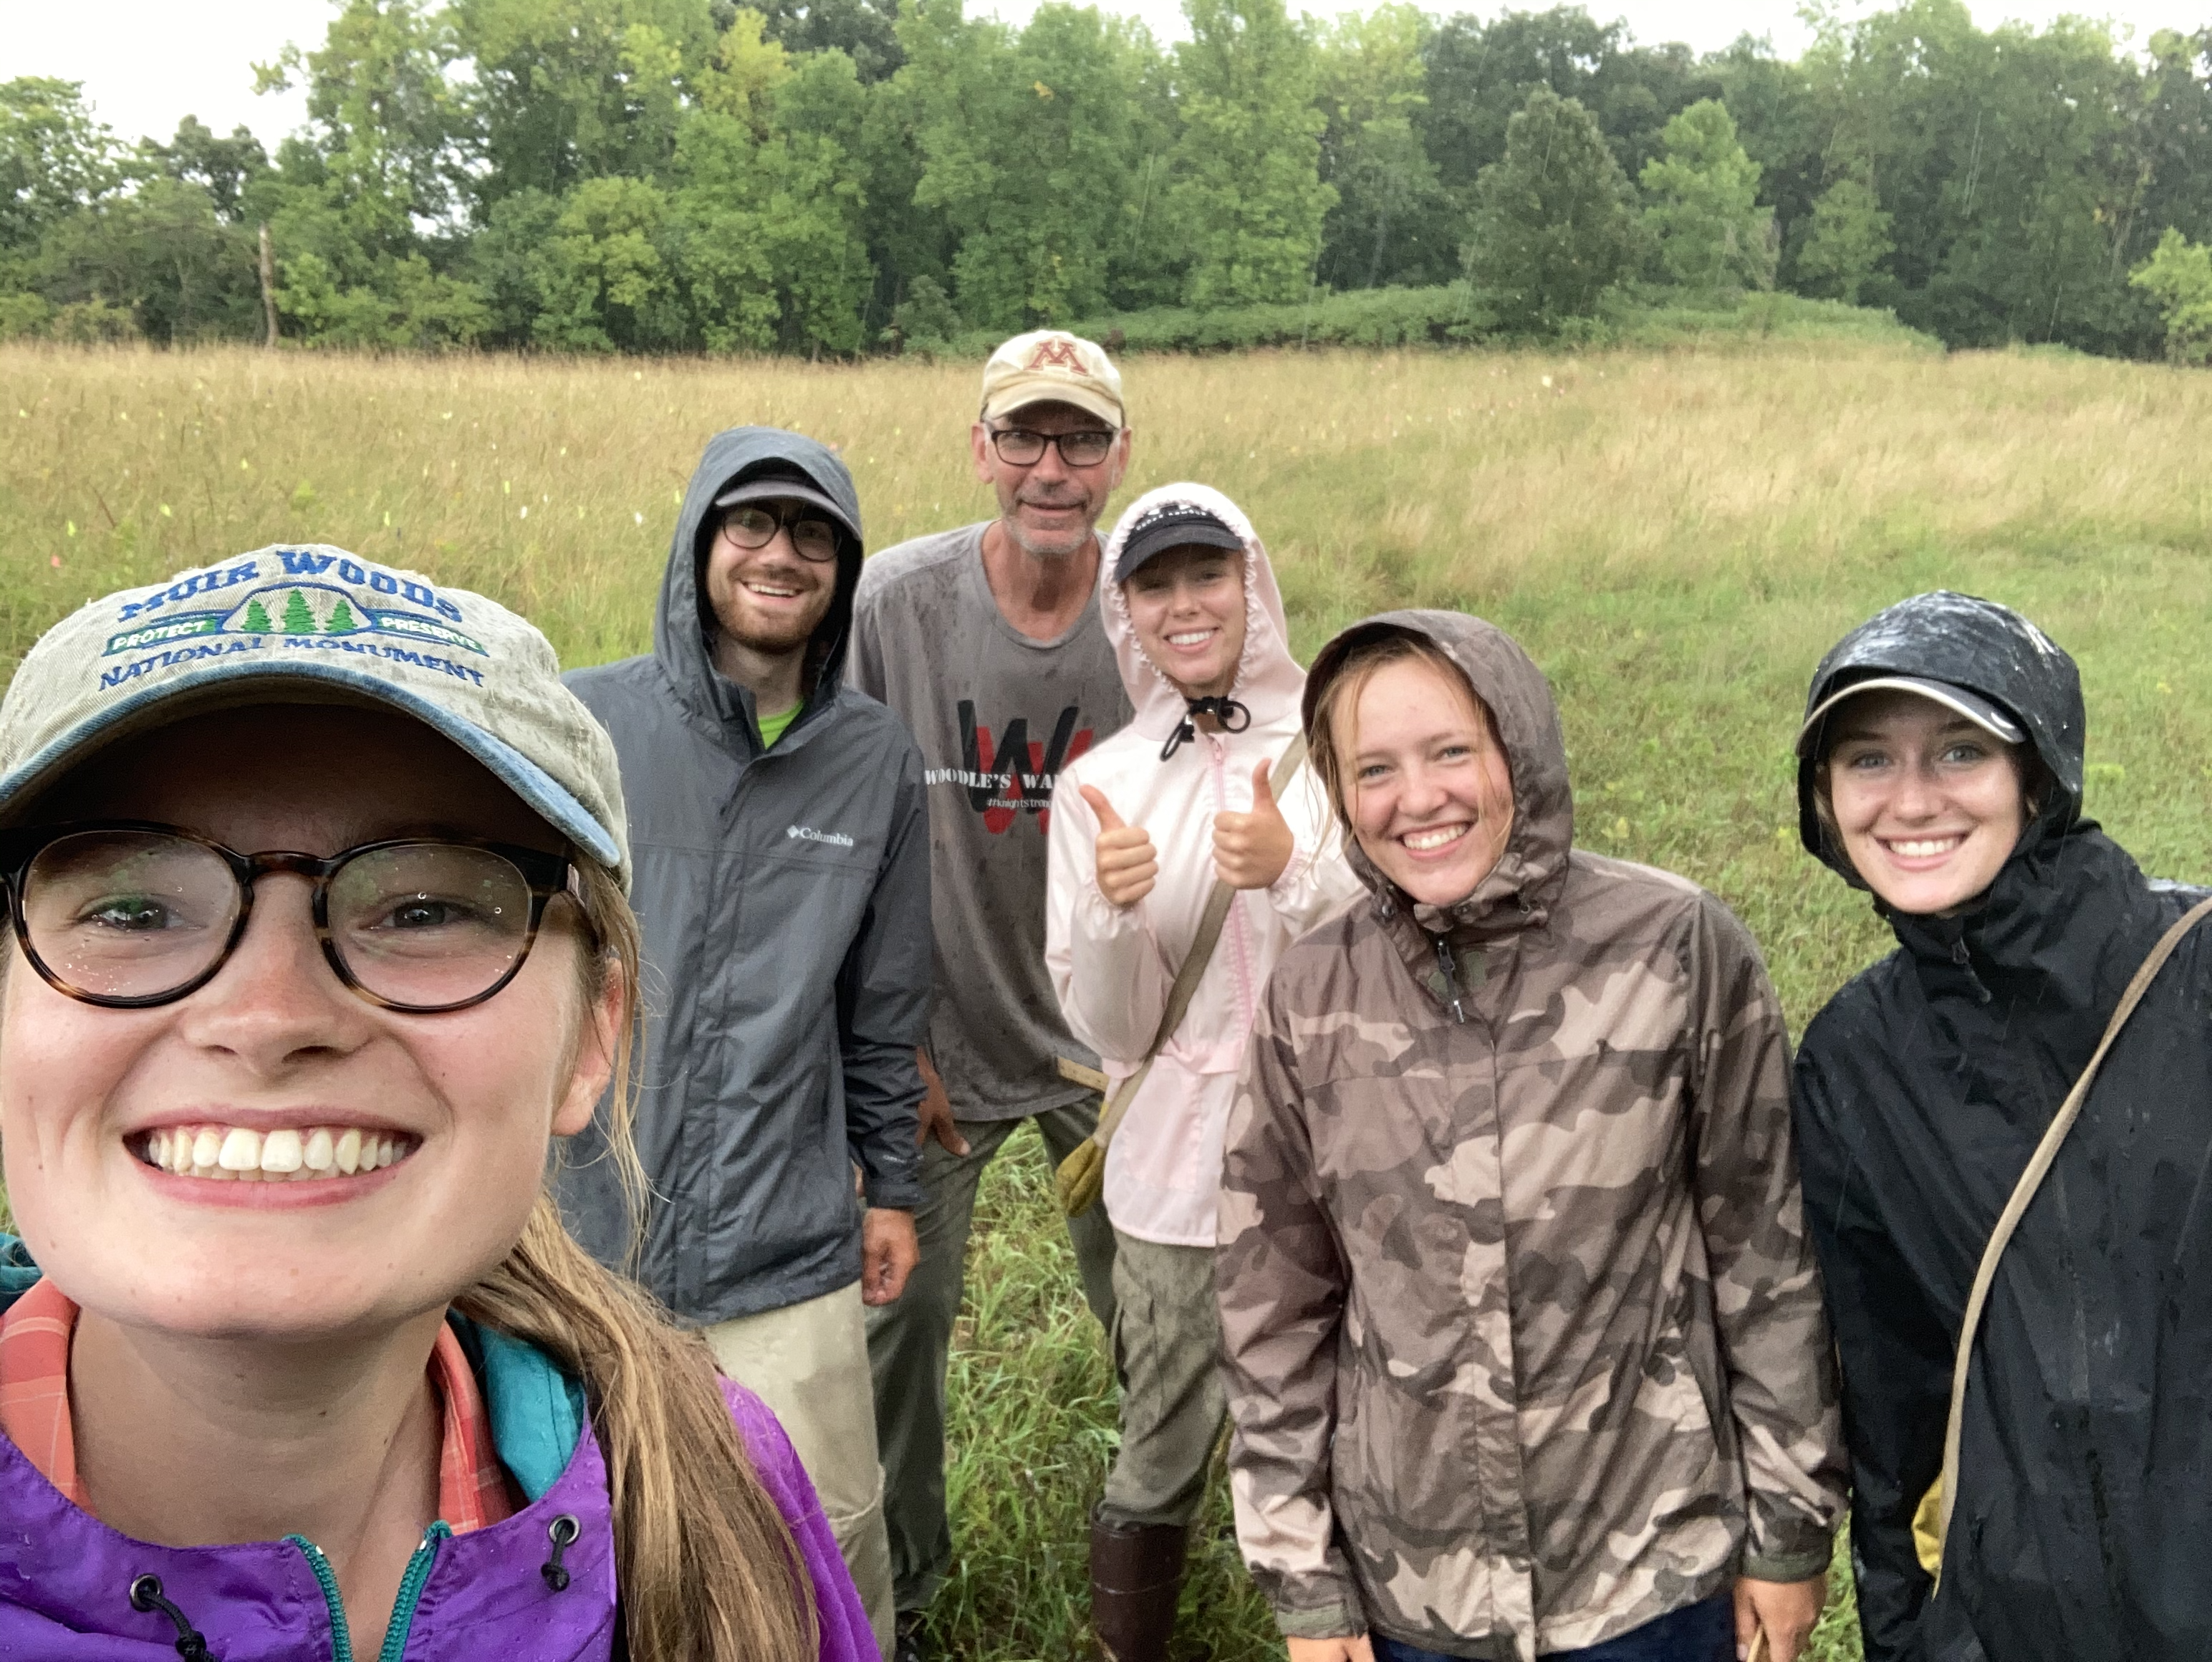
A rainbow-like cloud glows over exPt01 while the team was in MN for fall 2023 burns. A good omen for the field season that followed!
Introduction
Every year since 1996, members of Team Echinacea have recorded flowering phenology, taking measure data and harvested heads from thousands of Echinacea angustifolia plants in plots with “common garden” experimental designs. These experimental plots are located in prairie remnants, restorations, and abandoned agricultural fields that are managed as grassland habitat. Currently, the Echinacea Project has 10 established experimental plots. Some plots have multiple ongoing experiments within.
In the past few years, we have scaled back significantly on taking phenology records in the experimental plots. During 2023 and 2024, our primary goals with phenology were to a) map out the positions of flowering plants/heads within the plots, b) deploy twist ties to all flowering heads to ease measuring and harvesting, and c) to record the day of first flowering for all heads in plots to continue the long-term data collection in a more scaled-back fashion. As a result, we conducted only a few rounds of phenology per plot and did not capture the full range of flowering dates for every head. Phenology info is briefly reported on in each plot’s update along with the location of the data. This applies to the hybrid experimental plots as well.
Crew members Wyatt and Emma search can’t find positions in exPt01
Experimental plot 1 was first planted in 1996 (cleverly termed the 1996 cohort), and has been planted with nine other experiments in subsequent years, with the most recent planting being Amy Waananen’s inter-remnant crosses. It is the largest of the experimental plots, with over 10,000 planted positions; experiments in the plot include testing fitness differences between remnants (1996, 1997, 1999), quantifying effects of inbreeding (inb1, inb2), and assessing quantitative genetic variation (qGen1). It also houses a number of smaller experiments, including fitness of Hesperostipa spartea, aphid addition and exclusion, and pollen addition and exclusion (these experiments have separate posts).
In 2024, we conducted phenology in this plot between July 8th and July 18th. During measure, we visited 3123 of the 10,992 positions planted and found 2728 living plants. 83 plants were classified as “flowering” in exPt01 this year, totally 96 heads. This is a significantly fewer plants than flowered in summer 2023 (560). In summer 2024, we harvested 82 total Echinacea heads in exPt01 (including many from the ever-productive 99 south garden).
ExPt01 is also the only plot to have staples marking positions where plants that have died used to be. We added 67 staples to the experimental plot this year, but only in locations that we couldn’t find staples during measure that were already supposed to be there. We didn’t have time to get to every position with a missing staple (see where we covered here: Dropbox/CGData/125_measure/measure2024/staple2024/2024addStaplesExPt01.pdf). We did not have time to re-search locations that we called plants “can’t finds” at three years in a row in 2023 and 2024. Once these locations receive their final search, hopefully in 2025, we can put staples at them as well.
This experiment was started in 2020 by Amy Waananen to understand how the distance between plants in space and in their timing of flowering influences the fitness of their offspring. If plants that are located close together or flower at the same time are closely related, their offspring might be more closely related and inbred, and have lower fitness than plants that are far apart and/or flower more asynchronously. Plants in this experiment resulted from interremnant hand-crossings from 9 remnants: On27, SGC, GC, NGC, EELR, KJ, NNWLF, NWLF, LF. Crossing took place in 2020 and 2021, and individuals were planted in 2020 (as seed) and 2022 (as plugs). Surviving plants were assigned cgPlaIds in 2023 and incorporated into the p1 workflow. Mortality in this experiment has been high, with 80.3% of positions searched in 2024 resulting in “can’t finds.”. We did not re-search “can’t find” positions in 2024 due to time constraints (with Amy’s approval).
The inb1 experiment investigates the relationship between inbreeding level and fitness in Echinacea angustifolia. Each plant in experiment inb1 originates from one of three cross types, depending on the relatedness of the parents: between maternal half siblings; between plants from the same remnant, but not sharing a maternal or paternal parent; and between individuals from different remnants. All individuals were planted in 2001. We continued to measure fitness and flowering phenology in these plants.
The inb2 experiment investigates the relationship between inbreeding level and fitness in Echinacea angustifolia. Each plant in experiment inb2 originates from one of three cross types, depending on the relatedness of the parents: between maternal half siblings; between plants from the same remnant, but not sharing a maternal or paternal parent; and between individuals from different remnants. All individuals were planted in 2006. We continued to measure fitness and flowering phenology in these plants. In October 2024, former team member Riley Thoen recently published a paper in the Journal of Hereditary on the conservation value of small remnants using results from this experiment.
The qGen1 (quantitative genetics, or just qGen) experiment in p1 was designed to quantify the heritability of traits in Echinacea angustifolia. We are especially interested in Darwinian fitness. Could fitness be heritable? During the summer of 2002 we crossed plants from the 1996 & 1997 cohorts of exPt01. We harvested heads, dissected achenes, and germinated seeds over the winter. In the spring of 2003 we planted the resulting 4468 seedlings (this great number gave rise to this experiment’s nickname “big batch”).
data in cgData repo: ~/cgData/summer2024/exPt01Phenology
Measure data (status, size, etc.)
data in SQL database
Harvest data (IDs of harvested heads, missing achenes, etc)
detailed data in dropbox: dropbox/CGData/140_reconcile/reconcile2024/reconcileOut/2024harvestListReconciledExport.csv
data in SQL database
data in echinaceaLab package (hh.2024)
Samples collected:
82 heads harvested
At cbg for processing (counted, ready to randomize)
Products:
Publications
Thoen, R. D., A. Southgate, G. Kiefer, R.G. Shaw, S. Wagenius, The conservation value of small population remnants: Variability in inbreeding depression and heterosis of a perennial herb, the narrow-leaved purple coneflower (Echinacea angustifolia). 2024. Journal of Heredity esae055. https://doi.org/10.1093/jhered/esae055.
Page, M. L., Ison, J. L., Bewley, A. L., Holsinger, K. M., Kaul, A. D., Koch, K. E., Kolis, K. M., and Wagenius, S. 2019. Pollinator effectiveness in a composite: A specialist bee pollinates more florets but does not move pollen farther than other visitors. American Journal of Botany 106: 1487–1498. PDF
Waananen, A., G. Kiefer, J. L. Ison, and S. Wagenius. 2018. Mating opportunity increases with synchrony of flowering among years more than synchrony within years in a nonmasting perennial. The American Naturalist 192: 379-388. PDF | Appendix | online version
Muller, K. and S. Wagenius. 2016. Echinacea angustifolia and its specialist ant-tended aphid: a multi-year study of manipulated and naturally-occurring aphid infestation. Ecological Entomology 41: 51-60. PDF | online version
Shaw, R. G., S. Wagenius and C. J. Geyer. 2015. The susceptibility of Echinacea angustifolia to a specialist aphid: eco-evolutionary perspective on genotypic variation and demographic consequences. Journal of Ecology 103: 809-818. PDF
Kittelson, P., S. Wagenius, R. Nielsen, S. Qazi, M. Howe, G. Kiefer, and R. G. Shaw. 2015. Leaf functional traits, herbivory, and genetic diversity in Echinacea: Implications for fragmented populations. Ecology 96: 1877–1886. PDF
Ison, J.L., and S. Wagenius. 2014. Both flowering time and spatial isolation affect reproduction in Echinacea angustifolia. Journal of Ecology 102: 920–929. PDF | Supplemental Material | Archived Data
Ison, J.L., S. Wagenius, D. Reitz., M.V. Ashley. 2014. Mating between Echinacea angustifolia (Asteraceae) individuals increases with their flowering synchrony and spatial proximity. American Journal of Botany 101: 180-189. PDF
Ridley CE, Hangelbroek HH, Wagenius S, Stanton-Geddes J, Shaw RG, 2011. The effect of plant inbreeding and stoichiometry on interactions with herbivores in nature: Echinacea angustifolia and its specialist aphid. PLoS ONE 6(9): e24762. http://dx.plos.org/10.1371/journal.pone.0024762
Wagenius, S., H. H. Hangelbroek, C. E. Ridley, and R. G. Shaw. 2010. Biparental inbreeding and interremnant mating in a perennial prairie plant: fitness consequences for progeny in their first eight years. Evolution 64: 761-771. Abstract | PDF
Ruth G. Shaw, Charles J. Geyer, Stuart Wagenius, Helen H. Hangelbroek, and Julie R. Etterson. 2008. Unifying life-history analyses for inference of fitness and population growth. American Naturalist 172: E35 – E47. Abstract | PDF | Supplemental Material
Geyer, C.J., S. Wagenius, and R.G. Shaw. 2007. Aster models for life history analysis. Biometrika 94: 415-426. PDF | Supplemental Material
Grad student work
Drake Mullett’s PhD dissertation (2025)
Wyatt Mosiman’s MS thesis (2024)
Amy Waananen’s paper “The fitness effects of outcrossing distance depend on parental flowering phenology in fragmented populations of a tallgrass prairie forb” (with co-authors Ison, Wagenius, and Shaw) was just accepted by New Phytologist–it includes data from parents in exPt01 and progeny in exPt02.
AKA the heritability of flowering time experiment, exPt02 was designed to examine the role flowering phenology plays in the reproduction of Echinacea angustifolia. Jennifer Ison planted this plot in 2006 with 3,961 individuals selected for extreme (early or late) flowering timing, known as phenology. Using this phenological data, we explore how flowering phenology influences reproductive fitness and estimate the heritability of flowering time in E. angustifolia. In the summer of 2024, we conducted phenology between July 10th and July 19th. During measure, we visited 1,725 positions of the 3,961 positions originally planted. We measured 1,190 living plants, of which 302 were flowering with a total of 402 flowering heads (count excludes vertical developments). In the fall, we harvested 375 heads from exPt02. We observed much lower levels of seed predation by ground squirrels this year than the past few years.
data in cgData repo: ~/cgData/summer2024/exPt02Phenology
Measure data (status, size, etc.)
data in SQL database
Harvest data (IDs of harvested heads, missing achenes, etc)
detailed data in dropbox: dropbox/CGData/140_reconcile/reconcile2024/reconcileOut/2024harvestListReconciledExport.csv
data in SQL database
data in echinaceaLab package (hh.2024)
Samples collected:
375 heads harvested
at CBG for processing
Products:
Papers
Pearson, A.E., Z. Zelman, L.A. Hill, M.A. Stevens, E.X. Jackson, M.M.N. Incarnato, R.M. Johnson, S. Wagenius, and J.L. Ison. 2023. Pollinators differ in their contribution to the male fitness of a self-incompatible composite. American Journal of Botany 110(6): e16190. https://doi.org/10.1002/ajb2.16190
Reed, W. J., J. L. Ison, A. Waananen, F. H. Shaw, S. Wagenius, R. G. Shaw. 2022. Genetic variation in reproductive timing in a long-lived herbaceous perennial. American Journal of Botany 109(11) 1861–1874: https://doi.org/10.1002/ajb2.16072
Page, M. L., Ison, J. L., Bewley, A. L., Holsinger, K. M., Kaul, A. D., Koch, K. E., Kolis, K. M., and Wagenius, S. 2019. Pollinator effectiveness in a composite: A specialist bee pollinates more florets but does not move pollen farther than other visitors. American Journal of Botany 106: 1487–1498. PDF
Grad student work
Wyatt Mosiman’s MS thesis (2024)
Amy Waananen’s paper “The fitness effects of outcrossing distance depend on parental flowering phenology in fragmented populations of a tallgrass prairie forb” (with co-authors Ison, Wagenius, and Shaw) was just accepted by New Phytologist–it includes data from parents in exPt01 and progeny in exPt02.
We may have missed some other products.
exPt05:
The only experimental plot at Staffanson Prairie Preserve (SPP), exPt05 was planted to compare progeny of maternal plants from burned and unburned sections of SPP. There were originally 2800 individuals planted, but high mortality made it impractical to visit the plot row-by-row. Now, we treat the plot like demography. We use our survey-grade GPS to find plants in exPt05 that have previously flowered and add more plants to the stake file if new plants in the plot flower. In 2024, we found 17 living plants in exPt05 during flowering/total demo, 8 of which were flowering! We also observed (but did not take data on) additional basal plants within the plot boundaries that appeared to be growing on a 1×1 meter grid. ExPt05 persists!
Team Echinacea established quantitative genetics experiments to quantify additive genetic variance of fitness in Echinacea, with the idea that we can estimate evolutionary potential of study populations. The plants in qGen2 and qGen3 are plants in the 1996, 1997, and 1999 cohorts. These plants were crossed with pollen from plants in remnants to produce seed for qGen2 and qGen3, which now inhabit exPt08. Originally, 12,813 seeds were sown in the common garden. Seeds from the same cross (shared maternal and paternal plants) were sown in meter-long segments between nails. In the summer of 2024, we conducted phenology between July 10th and July 19th. A total of 3,253 seedlings were originally found, but due to gradual mortality we only searched 448 positions in 2024 for plants, and we found evidence of 314 living individuals. We identified 24 flowering plants in with a total of 29 heads, of which we harvested 23.
data in cgData repo: ~/cgData/summer2024/exPt08Phenology
Measure data (status, size, etc.)
data in SQL database
Harvest data (IDs of harvested heads, missing achenes, etc)
detailed data in dropbox: dropbox/CGData/140_reconcile/reconcile2024/reconcileOut/2024harvestListReconciledExport.csv
data in SQL database
data in echinaceaLab package (hh.2024)
Samples collected:
23 heads harvested
at CBG for processing
Products:
None… yet!
tplot
tplot is located within the bounds of exPt08. Plants of many species here were rescued from the landfill site. They we transferred as chunks of prairie sod, and individual transplants. This year during flowering and total demo, we encountered 14 living Echinacea plants from which we harvest 12 heads.
Demography data: head counts, rosette counts, etc.
demap input files have been updated with 2024
Spatial location for all flowering and some basal (total demo) plants
demap input files have been updated with 2024
Harvest data (IDs of harvested heads, missing achenes, etc)
detailed data in dropbox: dropbox/CGData/140_reconcile/reconcile2024/reconcileOut/2024harvestListReconciledExport.csv
data in echinaceaLab package (hh.2024)
Samples collected:
12 heads harvested
at CBG for processing
Products:
None… yet!
Experimental plot management:
Just like other areas of the prairie, our experimental plots need management! Here’s a list of the stewardship activities that we conducted in or for our plots during 2024:
NU MS student Maddie Sadler shows off our sweet clover haul
None of our experimental plots burned in the fall or spring prior to the 2024 growing season
Collected seed to plant in p1, p2, & p8, including:
1) Elise collected Carex brevior, Carex bicknellii, and Carex gravida from several sites and from plants that we established a few years ago near exPt01
2) Liam established Viola pedatifida production tub,
3) We collected a few additional species (including Galium boreale, Solidago missouriensis, Astragalus adsurgens, Dichanthelium leibergii, and Bromus kalmii) we plan to establish via plug in spring 2025
Psst – next year person writing this report; I ran my numbers using the script Dropbox/echProjAdmin/projectStatusReports/psr2024/wmGatherDataForReports2024.R. Maybe this can help you out.
Every year since 1996, Team Echinacea members record flowering phenology, taking measuring data and harvest heads of thousands of Echinacea angustifolia plants in common garden experiments. These experimental plots are prairie restorations and abandoned agriculture fields that are managed as grassland habitat. Some plots have multiple ongoing experiments within. Currently, the Echinacea Project currently has 10 established experimental plots.
This project status report will contain updates on experimental plots 1, 2, 4, 5 and 8, as well as management updates for all plots. Specific reports for the remaining experimental plots can be found on separate posts including Amy Dykstra’s plot (exPt03), the hybrid plots (exPt06, exPt07, exPt09), and the West Central Area common garden (exPt10).
exPt01: Experimental plot 1 was first planted in 1996 (cleverly termed the 1996 cohort), and has been planted with nine other experiments in subsequent years, with the most recent planting being Amy Waananen’s inter-remnant crosses. It is the largest of the experimental plots, with over 10,000 planted positions; experiments in the plot include testing fitness differences between remnants (1996, 1997, 1999), quantifying effects of inbreeding (inb1, inb2), and assessing quantitative genetic variation (qgen1). There are also a number of smaller experiments in it, including fitness of Hesperostipa spartea, aphid addition and exclusion, and pollen addition and exclusion (the last experiment was continued the summer of 2023 and will have separate update posts). In 2023, we visited 3,699 of the 10,992 positions planted and found 3,118 alive. 560 plants were classified as “flowering” in exPt01 this year. This is a little less than half of the plants that flowered in summer 2022 (1,111) – an interesting note considering exPt01 was burned the spring of both 2022 and 2023. In summer 2023, we harvested 796 total Echinacea heads in exPt01. We also added 270 additional staples to the experimental plot this year, signifying positions were a living plant has not been found for over three years.
Some numbers for experiments within exPt01
Inb1: The INB1 experiment investigates the relationship between inbreeding level and fitness in Echinacea angustifolia. Each plant in experiment INB1 originates from one of three cross types, depending on the relatedness of the parents: between maternal half siblings; between plants from the same remnant, but not sharing a maternal or paternal parent; and between individuals from different remnants. All individuals were planted in 2001. We continued to measure fitness and flowering phenology in these plants. In 2023, of the original 557 plants in INB1, 85 were still alive. Of the plants that were alive this year, 24 of them were flowering; this count is down from summer of 2022 where 40 of the plants were flowering.
qgen: The qGen1 (quantitative genetics) experiment in p1 was designed to quantify the heritability of traits in Echinacea angustifolia. We are especially interested in Darwinian fitness. Could fitness be heritable? During the summer of 2002 we crossed plants from the 1996 & 1997 cohorts of exPt01. We harvested heads, dissected achenes, and germinated seeds over the winter. In the spring of 2003 we planted the resulting 4468 seedlings (this great number gave rise to this experiment’s nickname “big batch”). 1,417 plants in qGen1 were alive in 2023. Of those plants, 298 flowered this summer.
Other plots:
exPt02: To examine the role flowering phenology plays in the reproduction of Echinacea angustifolia, Jennifer Ison planted this plot in 2006 with 3,961 individuals selected for extreme (early or late) flowering timing, or phenology. Using this phenological data, we explore how flowering phenology influences reproductive fitness and estimate the heritability of flowering time in E. angustifolia. In the summer of 2023, we visited 1,855 positions of the 3,961 positions originally planted. We measured 1,283 living plants, of which 118 were flowering, with a total of 148 flowering heads. In the fall, we harvested 67 heads from exPt02. The large difference between the number of heads and the number harvested has to do with high levels of seed predation, mainly by ground squirrels. Last year, Will, Jennifer, and other members of Team Echinacea published a paper in the American Journal of Botany using data from exPt02 – check it out here! Location: Hegg Lake WMA
exPt04: Experimental plot 4 was planted to gauge whether Echinacea from small remnant populations could be genetically rescued via an outcross to larger, more genetically diverse populations. Caroline Ridley and other members planted this plot in 2008. We did not visit exPt04 this year. Location: Hegg Lake WMA
exPt05: The only experimental plot planted at Staffanson Prairie Preserve (SPP), exPt05, was planted to compare progeny of maternal plants from burned and unburned sections of SPP. There were 2800 plants planted originally, but high mortality made it impractical to visit the plot row-by-row. Now, we and treat the plot like demography. We use our survey-grade GPS to find plants in exPt05 that have previously flowered and add more plants to the stake file if new plants in the plot flower. In 2023 we found 11 living plants, none of which were flowering! We did locate one new flowering plant within the plot boundaries. Location: Staffanson Prairie Preserve
exPt08: Team Echinacea established quantitative genetics experiments to quantify additive genetic variance of fitness in Echinacea, with the idea that we can estimate evolutionary potential of study populations. The maternal parents of qGen2 and qGen3 are plants in the 1996, 1997, and 1999 cohorts. These plants were crossed with pollen from plants in remnants to produce seed for qGen2 and qGen3, which now inhabit exPt08. Originally, 12,813 seeds were sown in the common garden. Seeds from the same cross (shared maternal and paternal plants) were sown in meter-long segments between nails. A total of 3,253 seedlings were originally found, but only 385 plants were found alive in 2023. There were 15 flowering plants in 2023, and 15 heads. On a side note, one additional flowering plant was found in t-plot, and we harvested three heads from that. Location: Wagenius property
Experimental plot management:
Burned exPt01 (3 May 2023) and exPt08 (17 May 2023)
Replanted pedicularis in exPt01 and exPt10, augmenting Drake’s experimental treatments (replaced ones that died)
Broadcast seed in p8 after the spring burn and in the fall, including Comandra umbellata
Stuart trimmed flowering A. gerardii and S. nutans just north of tplot
Some plots in hegg (not exPt02) got run over by heavy machinery
We did not:
Treat sumac
Weed in exPt01 (except hawkweed)
Treat ash in exPt08, but we noticed that ash south of plot responded favorably to last year’s treatment
Details
Start year: Differs between experiment, see above. First ever experimental plot was in 1996.
Location: Differs between experiment, see above.
Overlaps with: …everything!
Data collected: Raw measuring data can be found in cgData repository. Processed data will be uploaded to SQL database. Currently, SQL database has measuring data up until 2022.
Samples or specimens collected: See above for total harvested heads in each plot.
Products: Many publications and independent projects.
Since 1996, members of Team Echinacea have walked, crawled, and ~sometimes~ run next to rows of Echinacea angustifolia planted in common garden experiments. Although protocol varies depending on the experimental plot, every year team members record flowering phenology data, measuring data, and harvest the heads of the thousands of plants we have in common garden experiments.
Note that these experiments are not really gardens. “Common garden” refers to the experimental design. Most of our experimental plots are prairie restorations, a few are abandoned ag fields that are manged as grassland habitat. Some plots have multiple experiments within. The Echinacea Project currently has 10 established experimental plots:
exPts01-10. To avoid repetitiveness of reports on yearly phenology, measuring, and harvesting, this project status report will include updates on all experimental plots 1, 4, 5, and 8. Reports for the others will be elsewhere: Jennifer’s plot (exPt02) Amy Dykstra’s plot (exPt03), the hybrid plots (exPt06, exPt07, exPt09), and the West Central Area common garden (exPt10).
exPt01: Experimental plot 1 was first planted in 1996 (cleverly termed the 1996 cohort), and has been planted with nine other experiments in subsequent years, with the most recent planting being Amy Waananen’s inter-remnant crosses. It is the largest of the experimental plots, with over 10,000 planted positions; experiments in the plot include testing fitness differences between remnants (1996, 1997, 1999), quantifying effects of inbreeding (inb1, inb2), and assessing quantitative genetic variation (qgen1). There are also a number of smaller experiments in it, including fitness of Hesperostipa spartea, aphid addition and exclusion, and pollen addition and exclusion. In 2021, we visited 6,673 of the original 10,673 planted and found 3,085 alive. Only 79 plants were classified as “flowering” in exPt01 this year. This is a drastic decrease from the 484 plants that flowered in summer 2020– perhaps it is a testament to the benefits of controlled burning (we burned in spring 2020 but not in 2021). In summer 2021, we harvested 77 total Echinacea heads in exPt01 (we have not finished the inventory process). In the fall, we added 403 staples to positions where plants were gone for three straight years. We also converted the flaple>s (pin flags bent in half in spots where we ran out of staples) into regular old staples. There are no more flaples in p1!
exPt04: Experimental plot 4 was planted to gauge whether Echinacea from small remnant populations could be genetically rescued via an outcross to larger, more genetically diverse populations. Caroline Ridley and other members planted this plot in 2008. We did not measure exPt04 this year, but there were no flowering plants. Location: Hegg Lake WMA
exPt05: The only experimental plot planted at Staffanson Prairie Preserve (SPP), exPt05, was planted to compare progeny of maternal plants from burned and unburned sections of SPP. There were 2800 plants planted originally, but high mortality made it impractical to visit the plot row-by-row. Now, we and treat the plot like demography. We use our survey-grade GPS to find plants in exPt05 that have previously flowered and add more plants to the stake file if new plants in the plot flower. In 2021 we found 11 living plants, three of which were flowering! There was only twohead to collect, one head was toppled. Location: Staffanson Prairie Preserve
exPt08: Team Echinacea established quantitative genetics experiments to quantify additive genetic variance of fitness in Echinacea, with the idea that we can estimate evolutionary potential of study populations. The maternal parents of qGen2 and qGen3 are plants in the 1996, 1997, and 1999 cohorts. These plants were crossed with pollen from plants in remnants to produce seed for qGen2 and qGen3, which now inhabit exPt08. Originally, 12,813 seeds were sown in the common garden. Seeds from the same cross (shared maternal and paternal plants) were sown in meter-long segments between nails. A total of 3,253 seedlings were originally found, but only 443 plants were found alive in 2021. There were 28 flowering plants in 2021, and 32 heads. This is the most flowering heads in p8 we have ever seen, the first year plants flowered in p8 was 2019 and in 2020 five plants flowered. Note that there were an additional 14 heads collected from transplant plot.
Plot management: To ensure that the common garden environment is as similar as possible to the prairie environment we must actively manage it. This management includes removing foreign species and supplementing with natives. One of our main management methods is through fire. We were able to burn burn p8 this spring and hope to burn p1 this spring. We also collected seed to spread after burns including Schizachyrium scoparium, Bouteloua curtipendula, along with multiple species of Solidago and quite a few Asters.
Asclepias viridiflora in p1: In 2019, plugs of an uncommon prairie milkweed, Asclepias viridiflora, were planted in Experimental plot 1. The purpose of this experiment is to assess the survival and fitness of A. viridiflora. Assessing vitality will also provide a frame of reference for species conservation across modern prairies. We did not assess the A. viridiflora plants this year.
Hesperostipa demography: In 2009 and 2010, porcupine grass (Hesperostipa spartea, a.k.a. “stipa”) was planted in experimental plot 1. In total, 4417 seeds were planted, 1 m apart from each other and all 10 cm north of Echinacea plants. Between 2010 and 2013, each position was checked, and the plant status recorded. Since 2014, we have searched for flowering plants. The data from this summer can be found here cgdata/summer2021/stipaSearch & Dropbox/CGData/Stipa/225_measure/measure2021 in addition to data in these locations there may be paper data sheets that may or may not have been entered yet. These data have not been processed yet.
Inb1: The INB1 experiment investigates the relationship between inbreeding level and fitness in Echinacea angustifolia. Each plant in experiment INB1 originates from one of three cross types, depending on the relatedness of the parents: between maternal half siblings; between plants from the same remnant, but not sharing a maternal or paternal parent; and between individuals from different remnants. We continued to measure fitness and flowering phenology in these plants. In 2021, of the original 557 plants in INB1, 95were still alive. Of the plants that were alive this year, there was only one flowering plant. All individuals were planted in 2001.
qgen: The qGen1 (quantitative genetics) experiment in p1 was designed to quantify the heritability of traits in Echinacea angustifolia. We are especially interested in Darwinian fitness. Could fitness be heritable? During the summer of 2002 we crossed plants from the 1996 & 1997 cohorts of exPt01. We harvested heads, dissected achenes, and germinated seeds over the winter. In the Spring of 2003 we planted the resulting 4468 seedlings (this great number gave rise to this experiment’s nickname “big batch”). In 2021 we assessed survival and fitness measures of the qGen1 plants. 1,519 plants in qGen1 were alive in 2021. Of those, 2.4% flowered in 2021, this is down from 17% last year. All were planted in 2003.
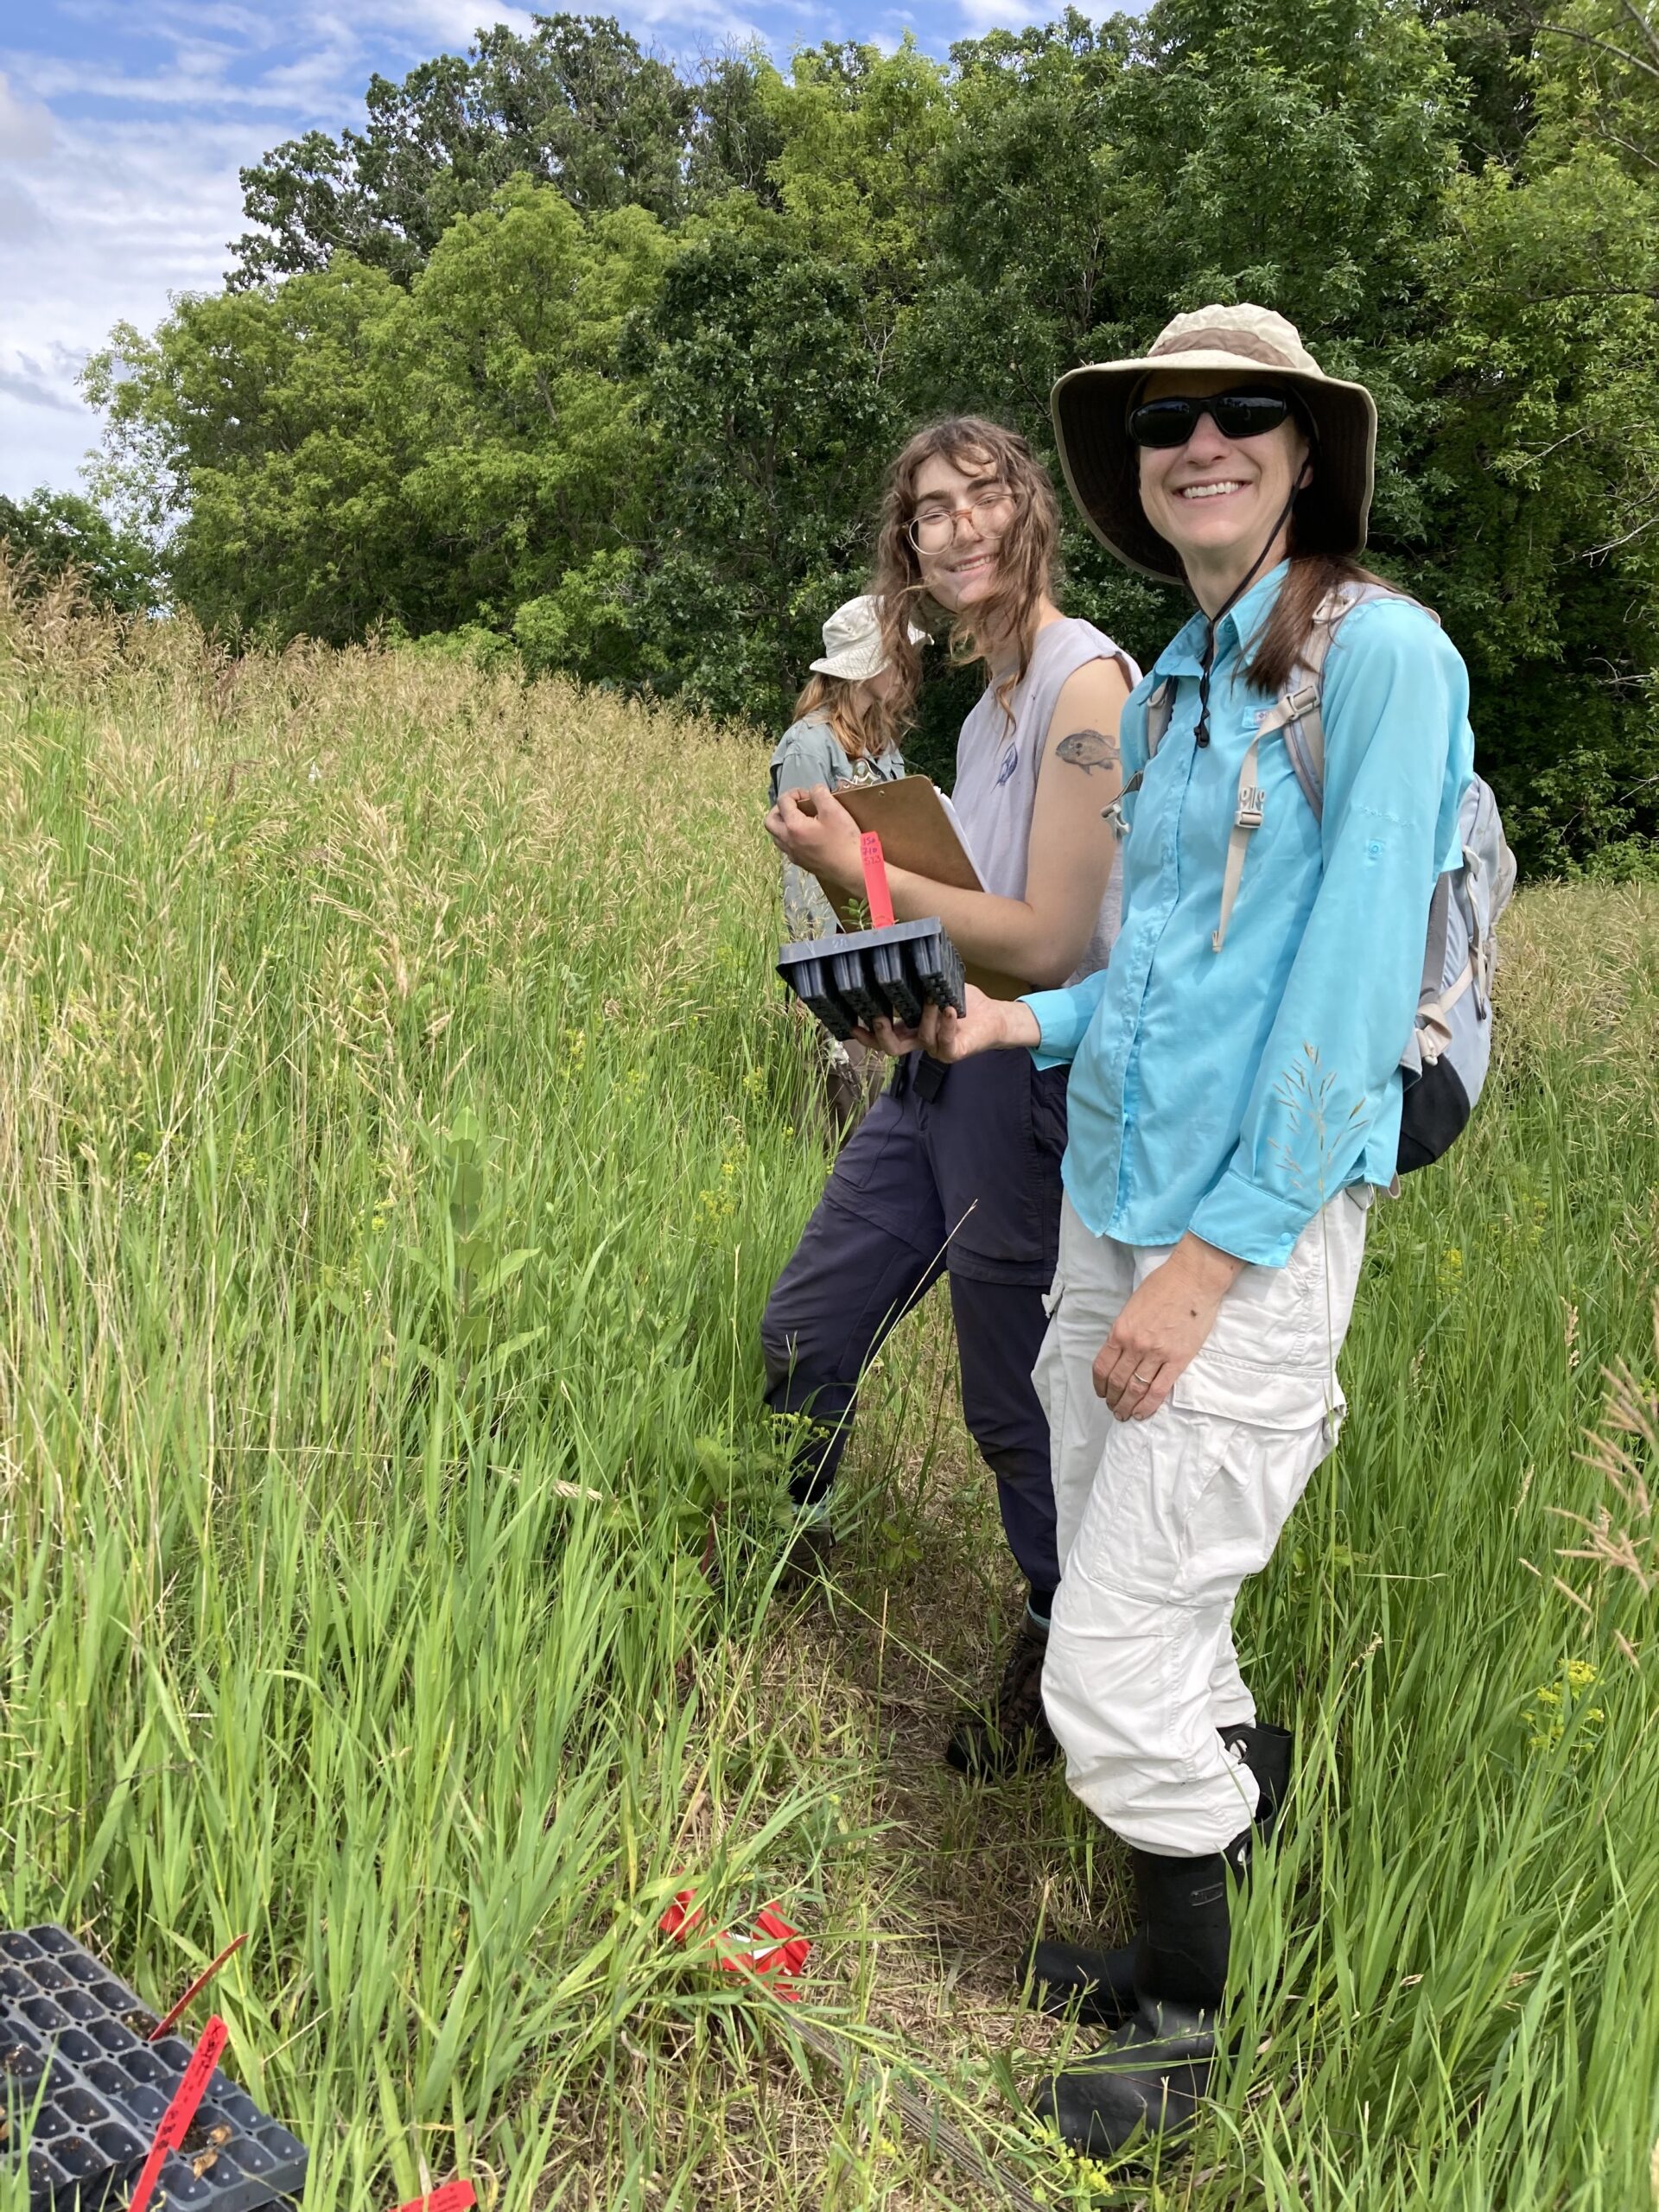
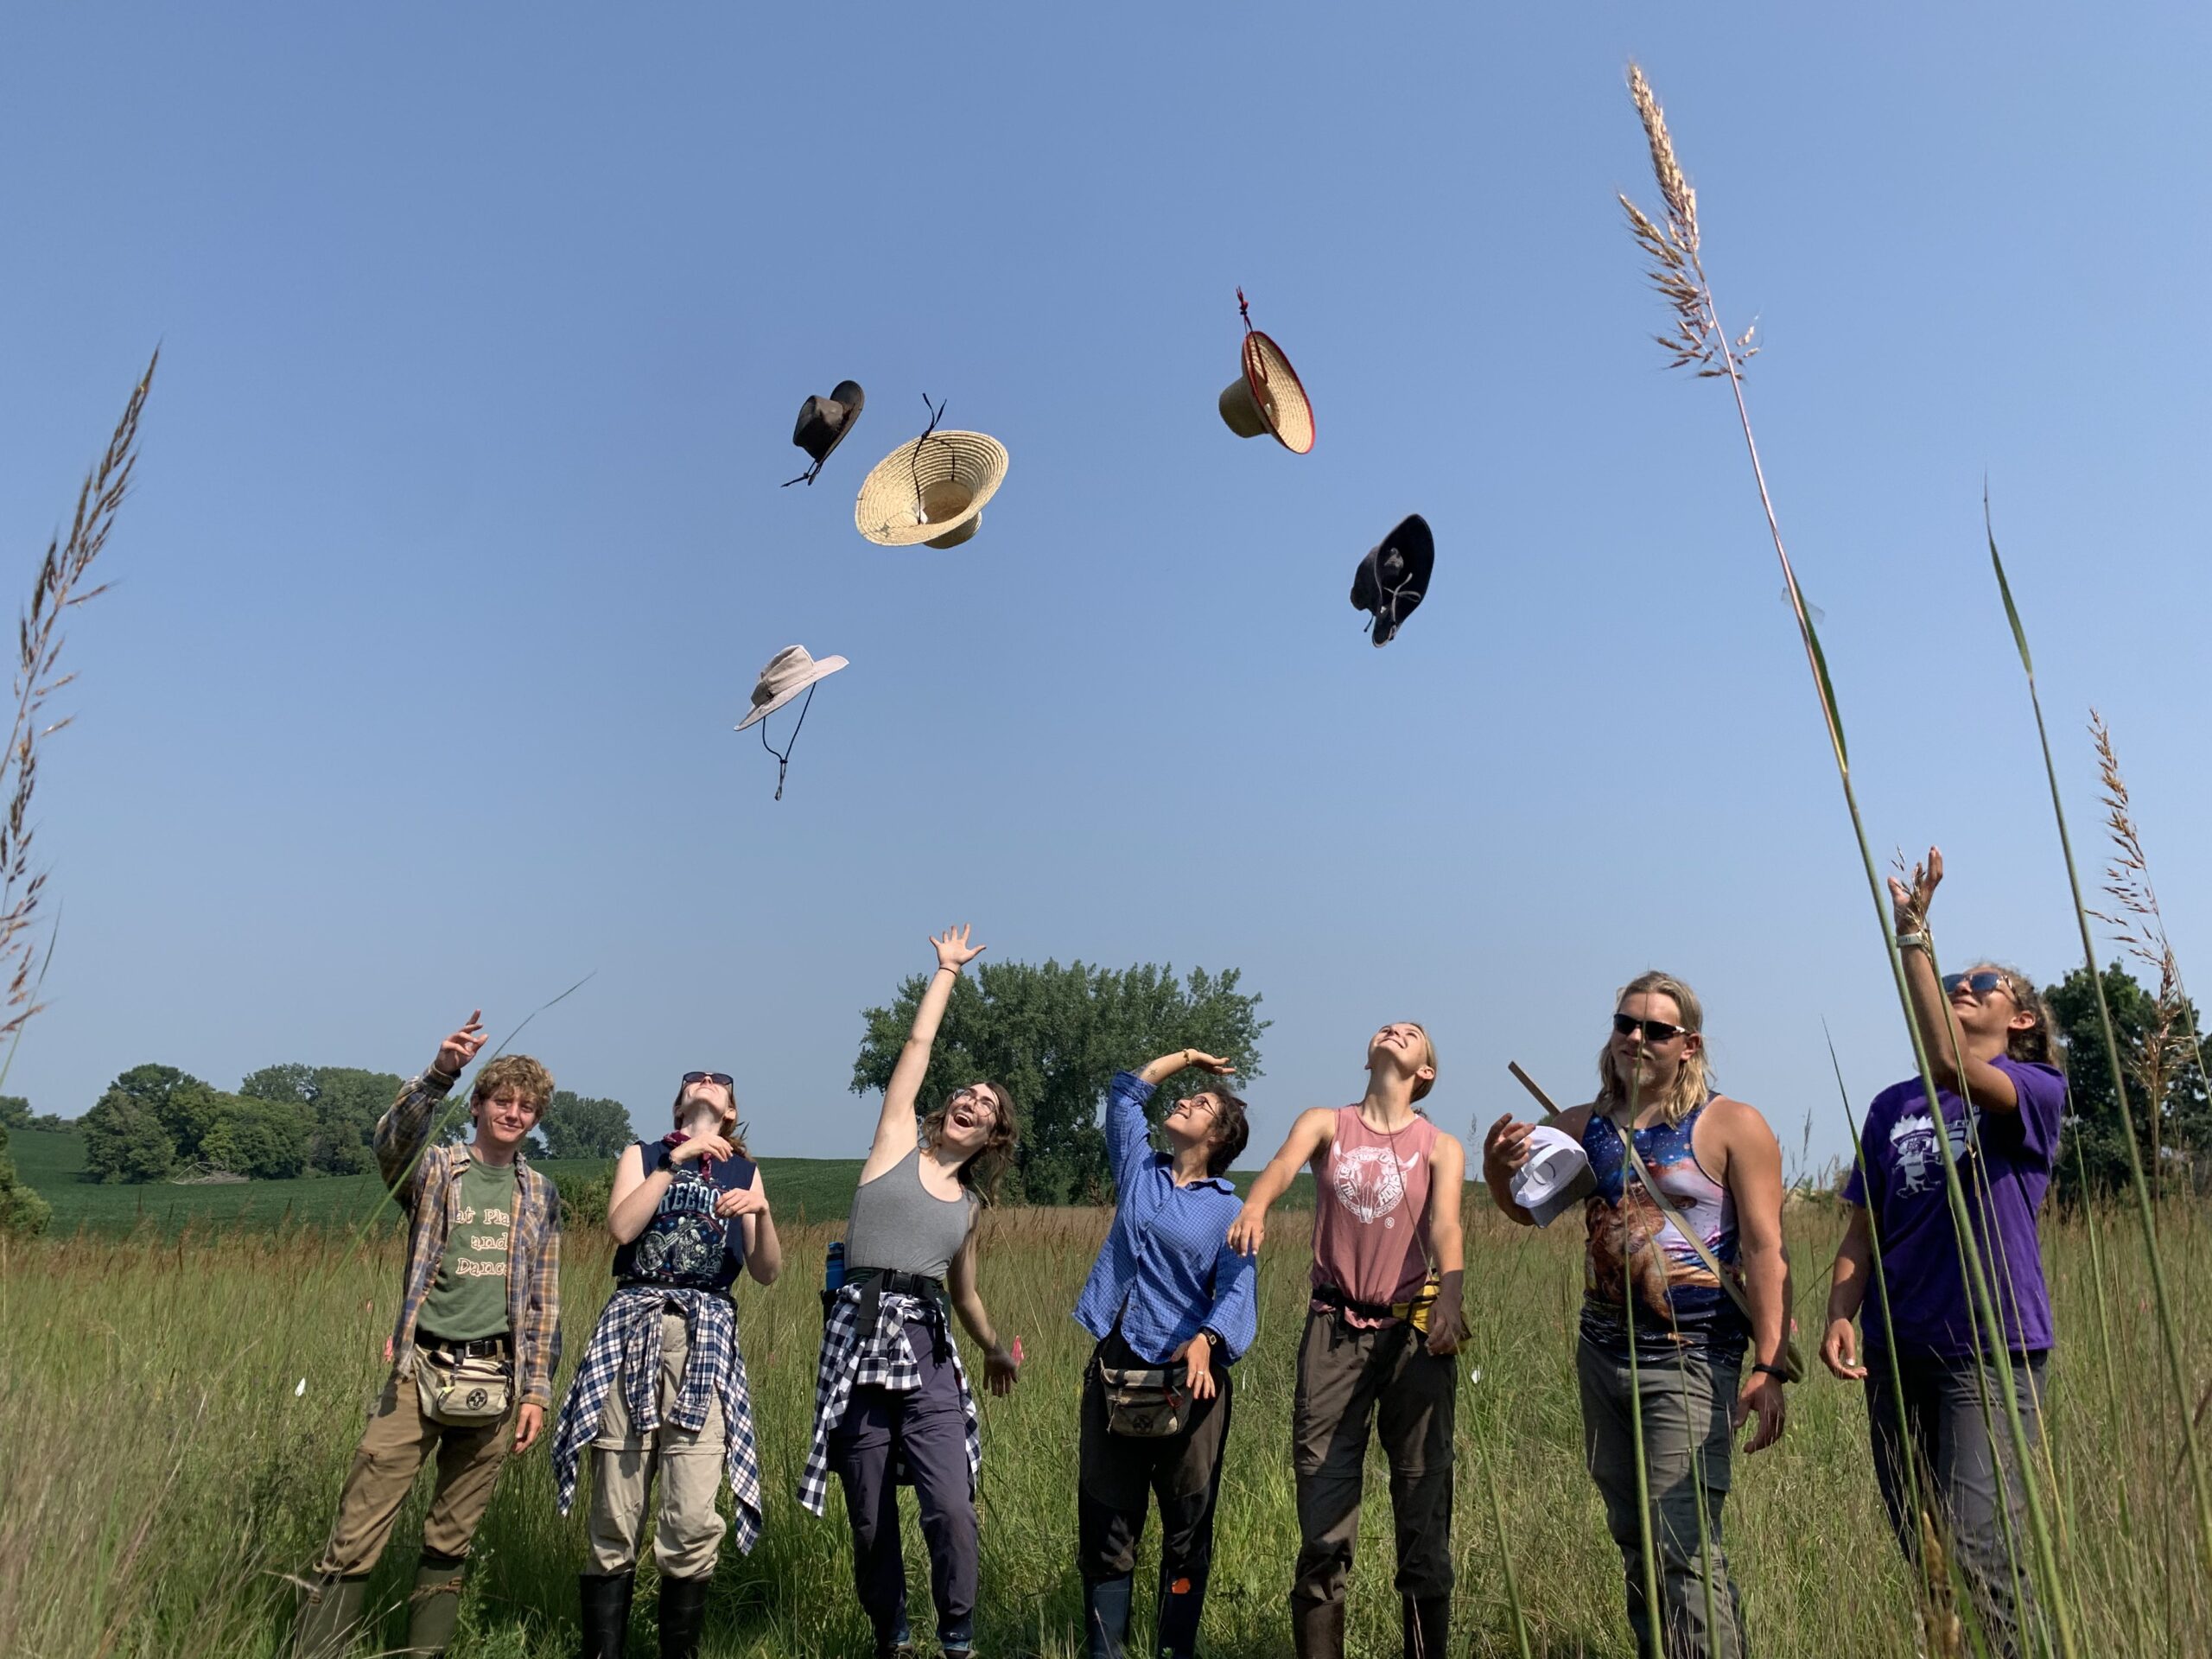
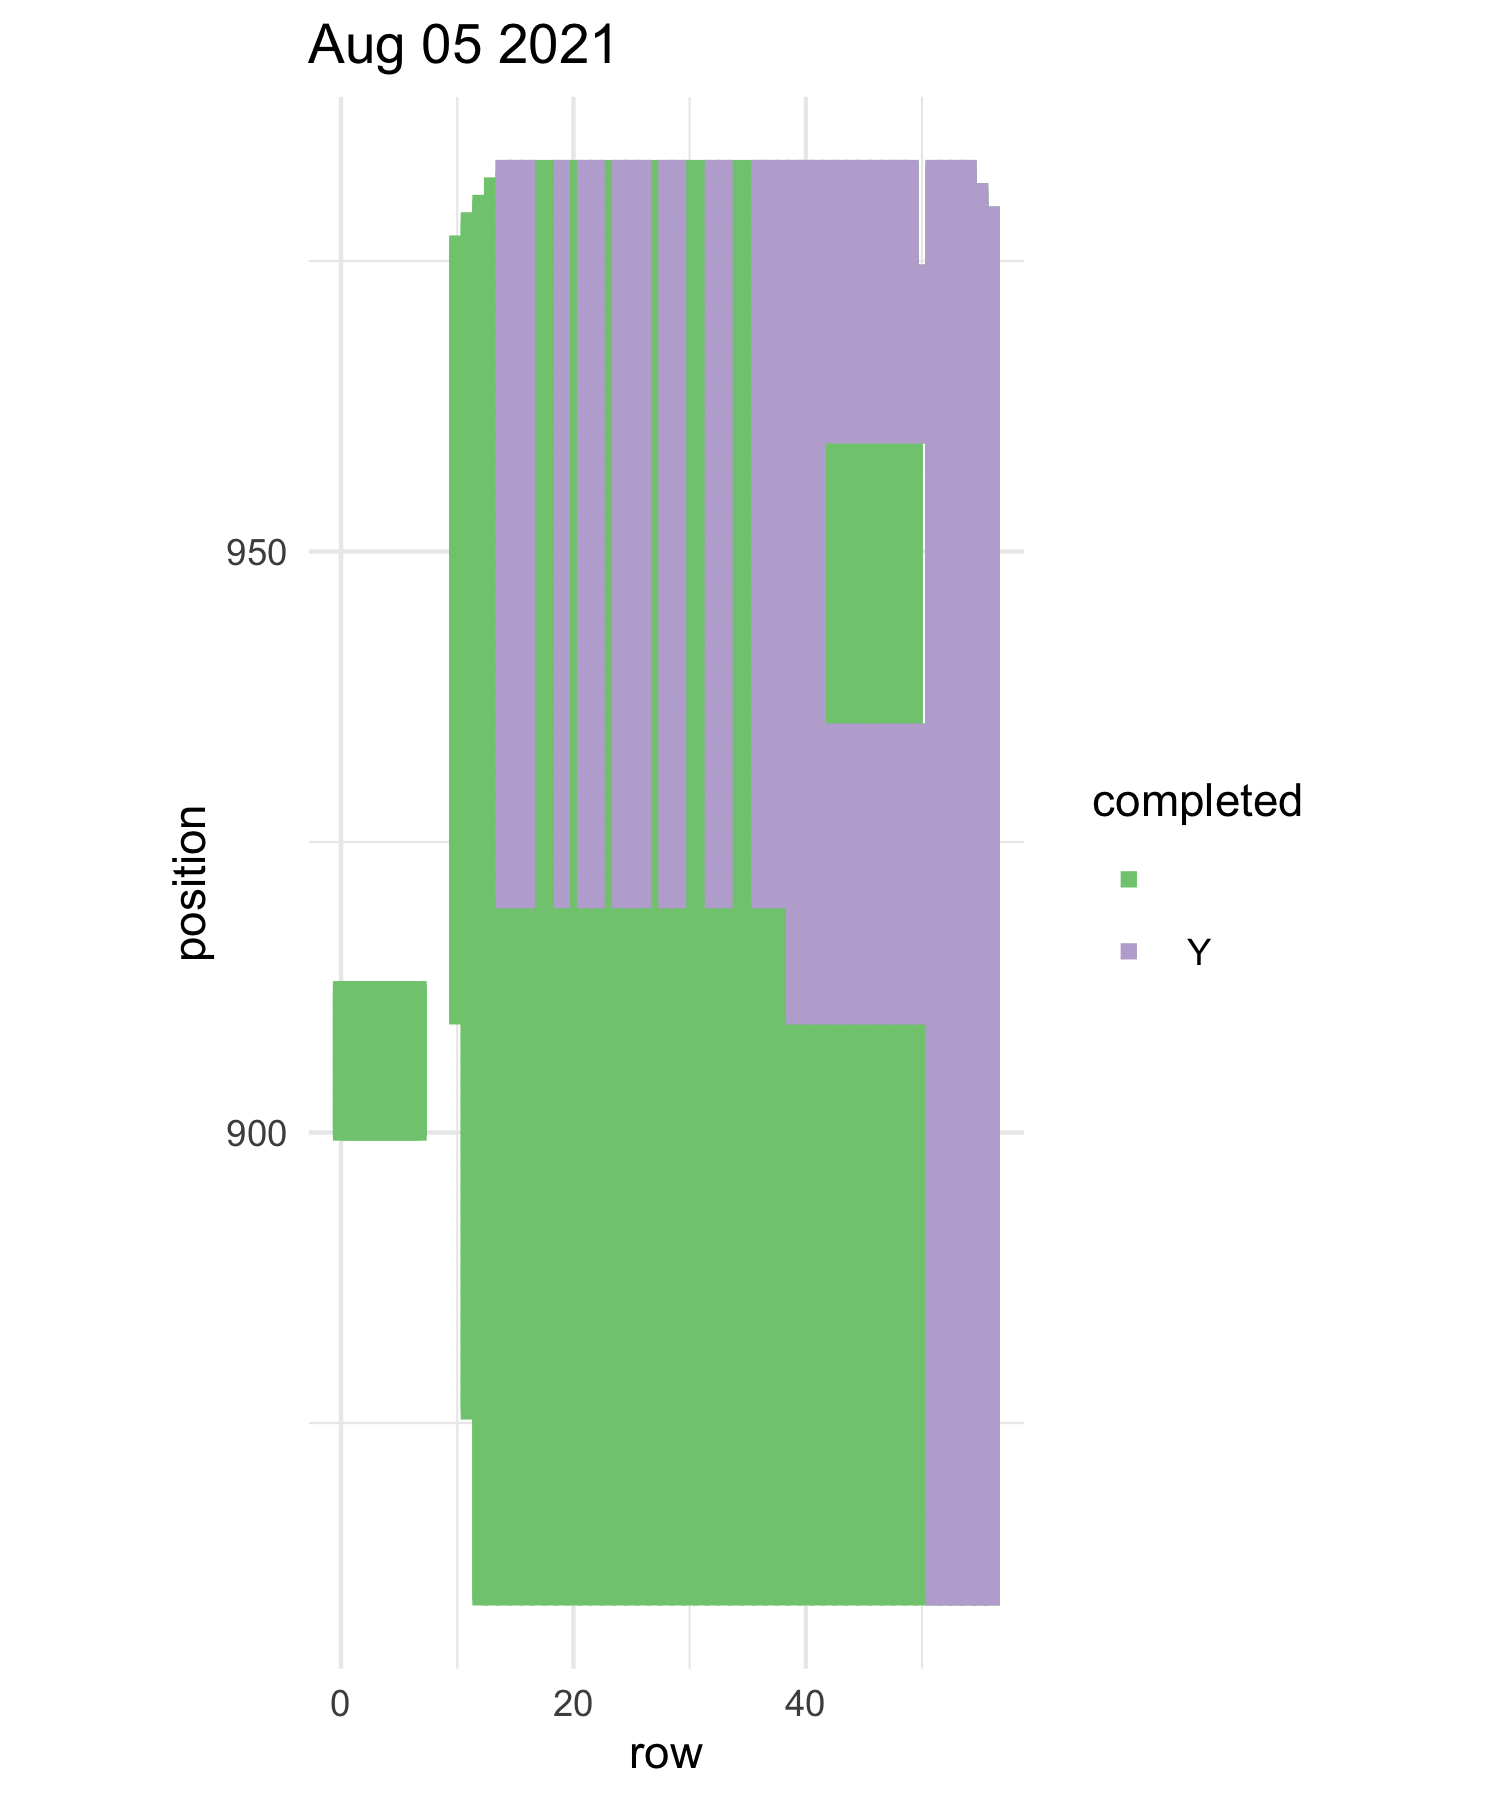
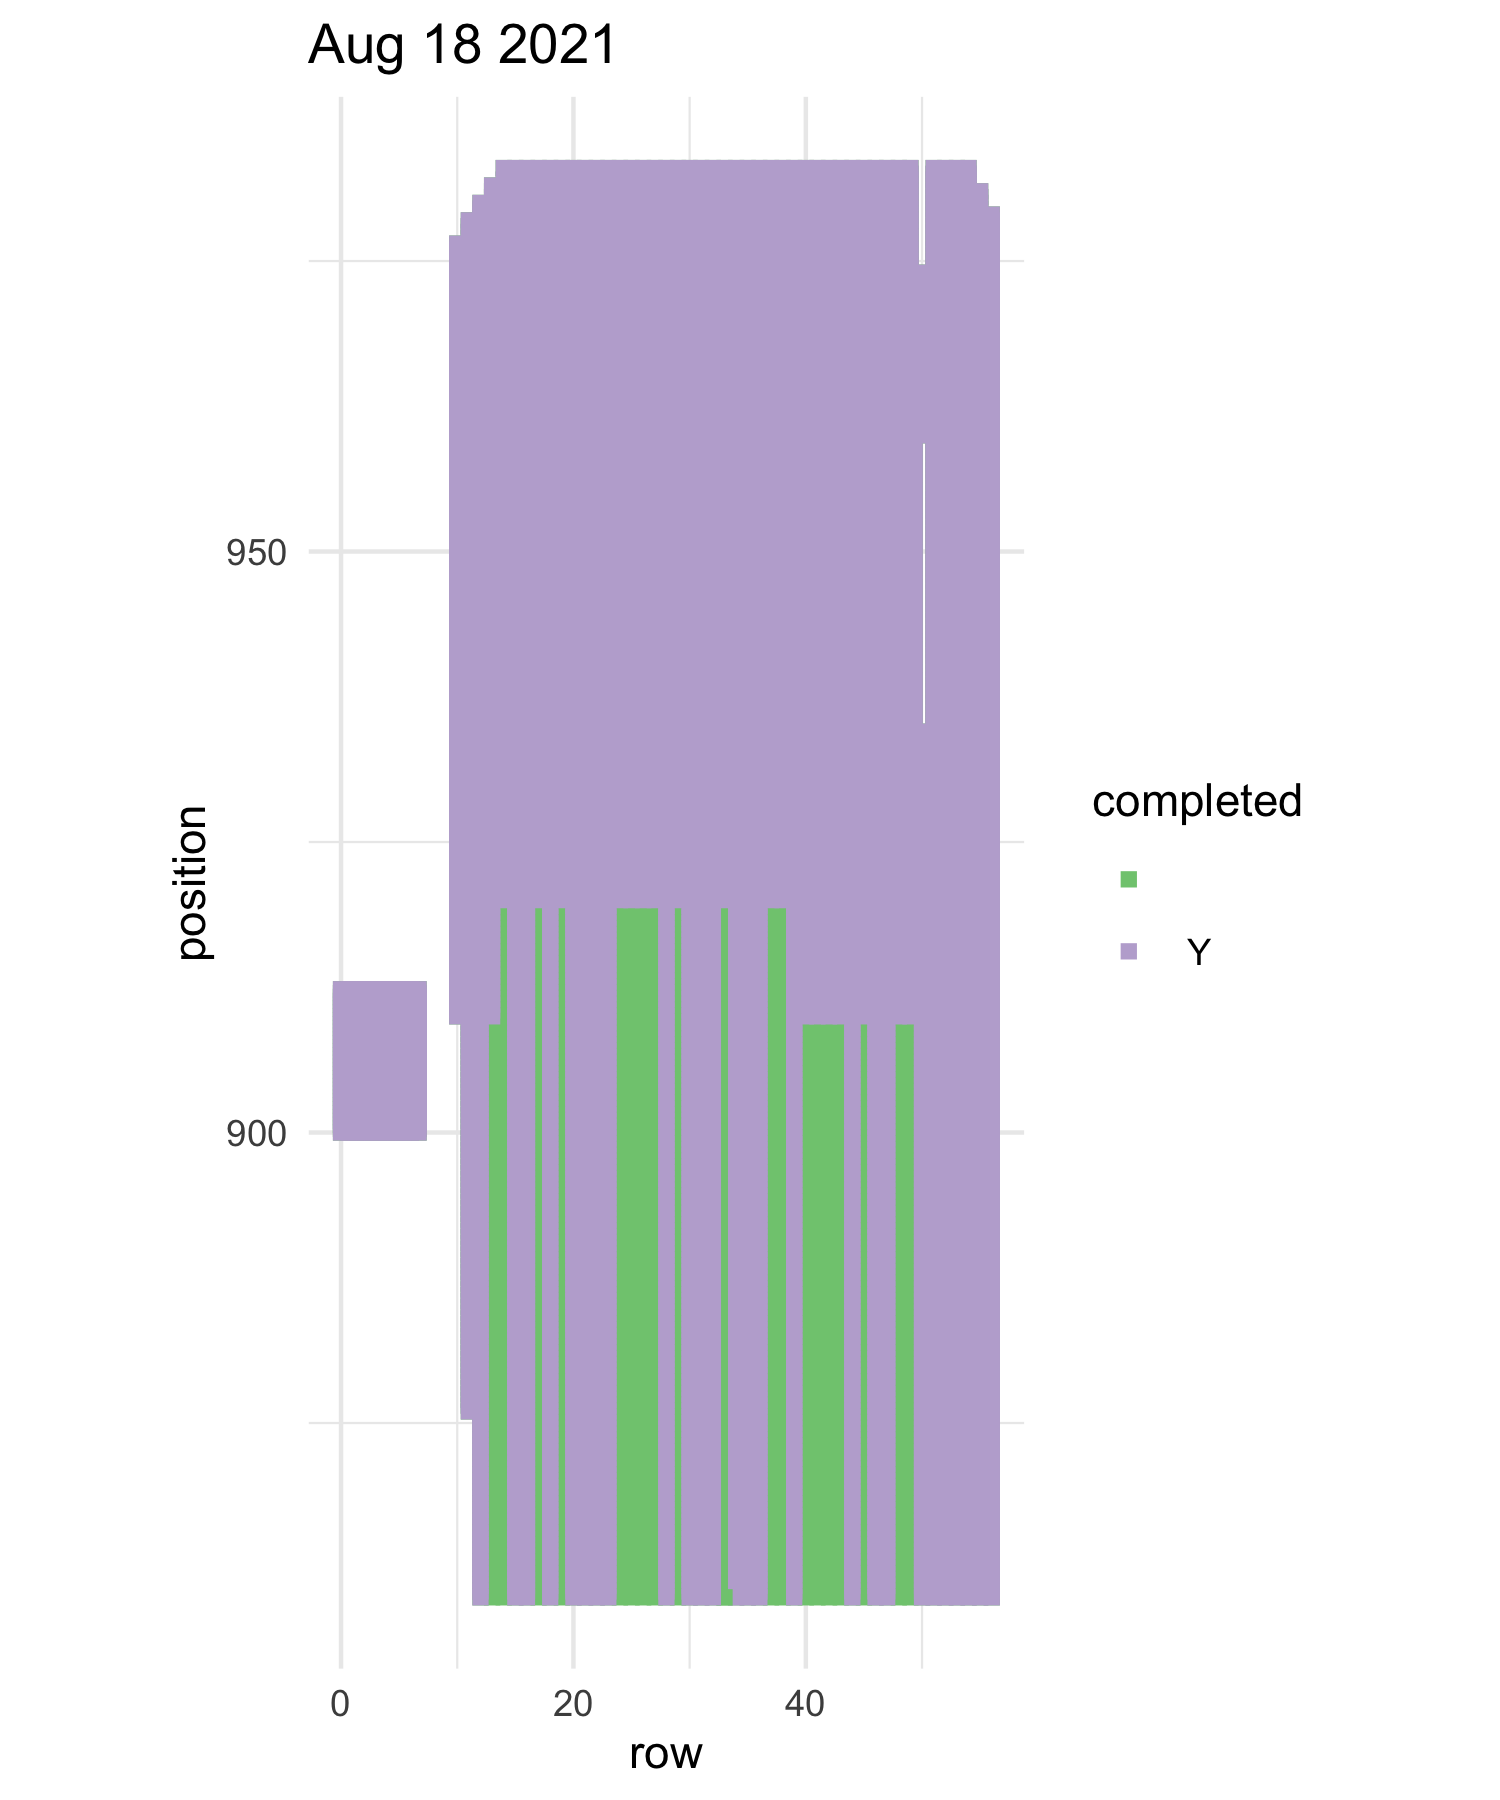
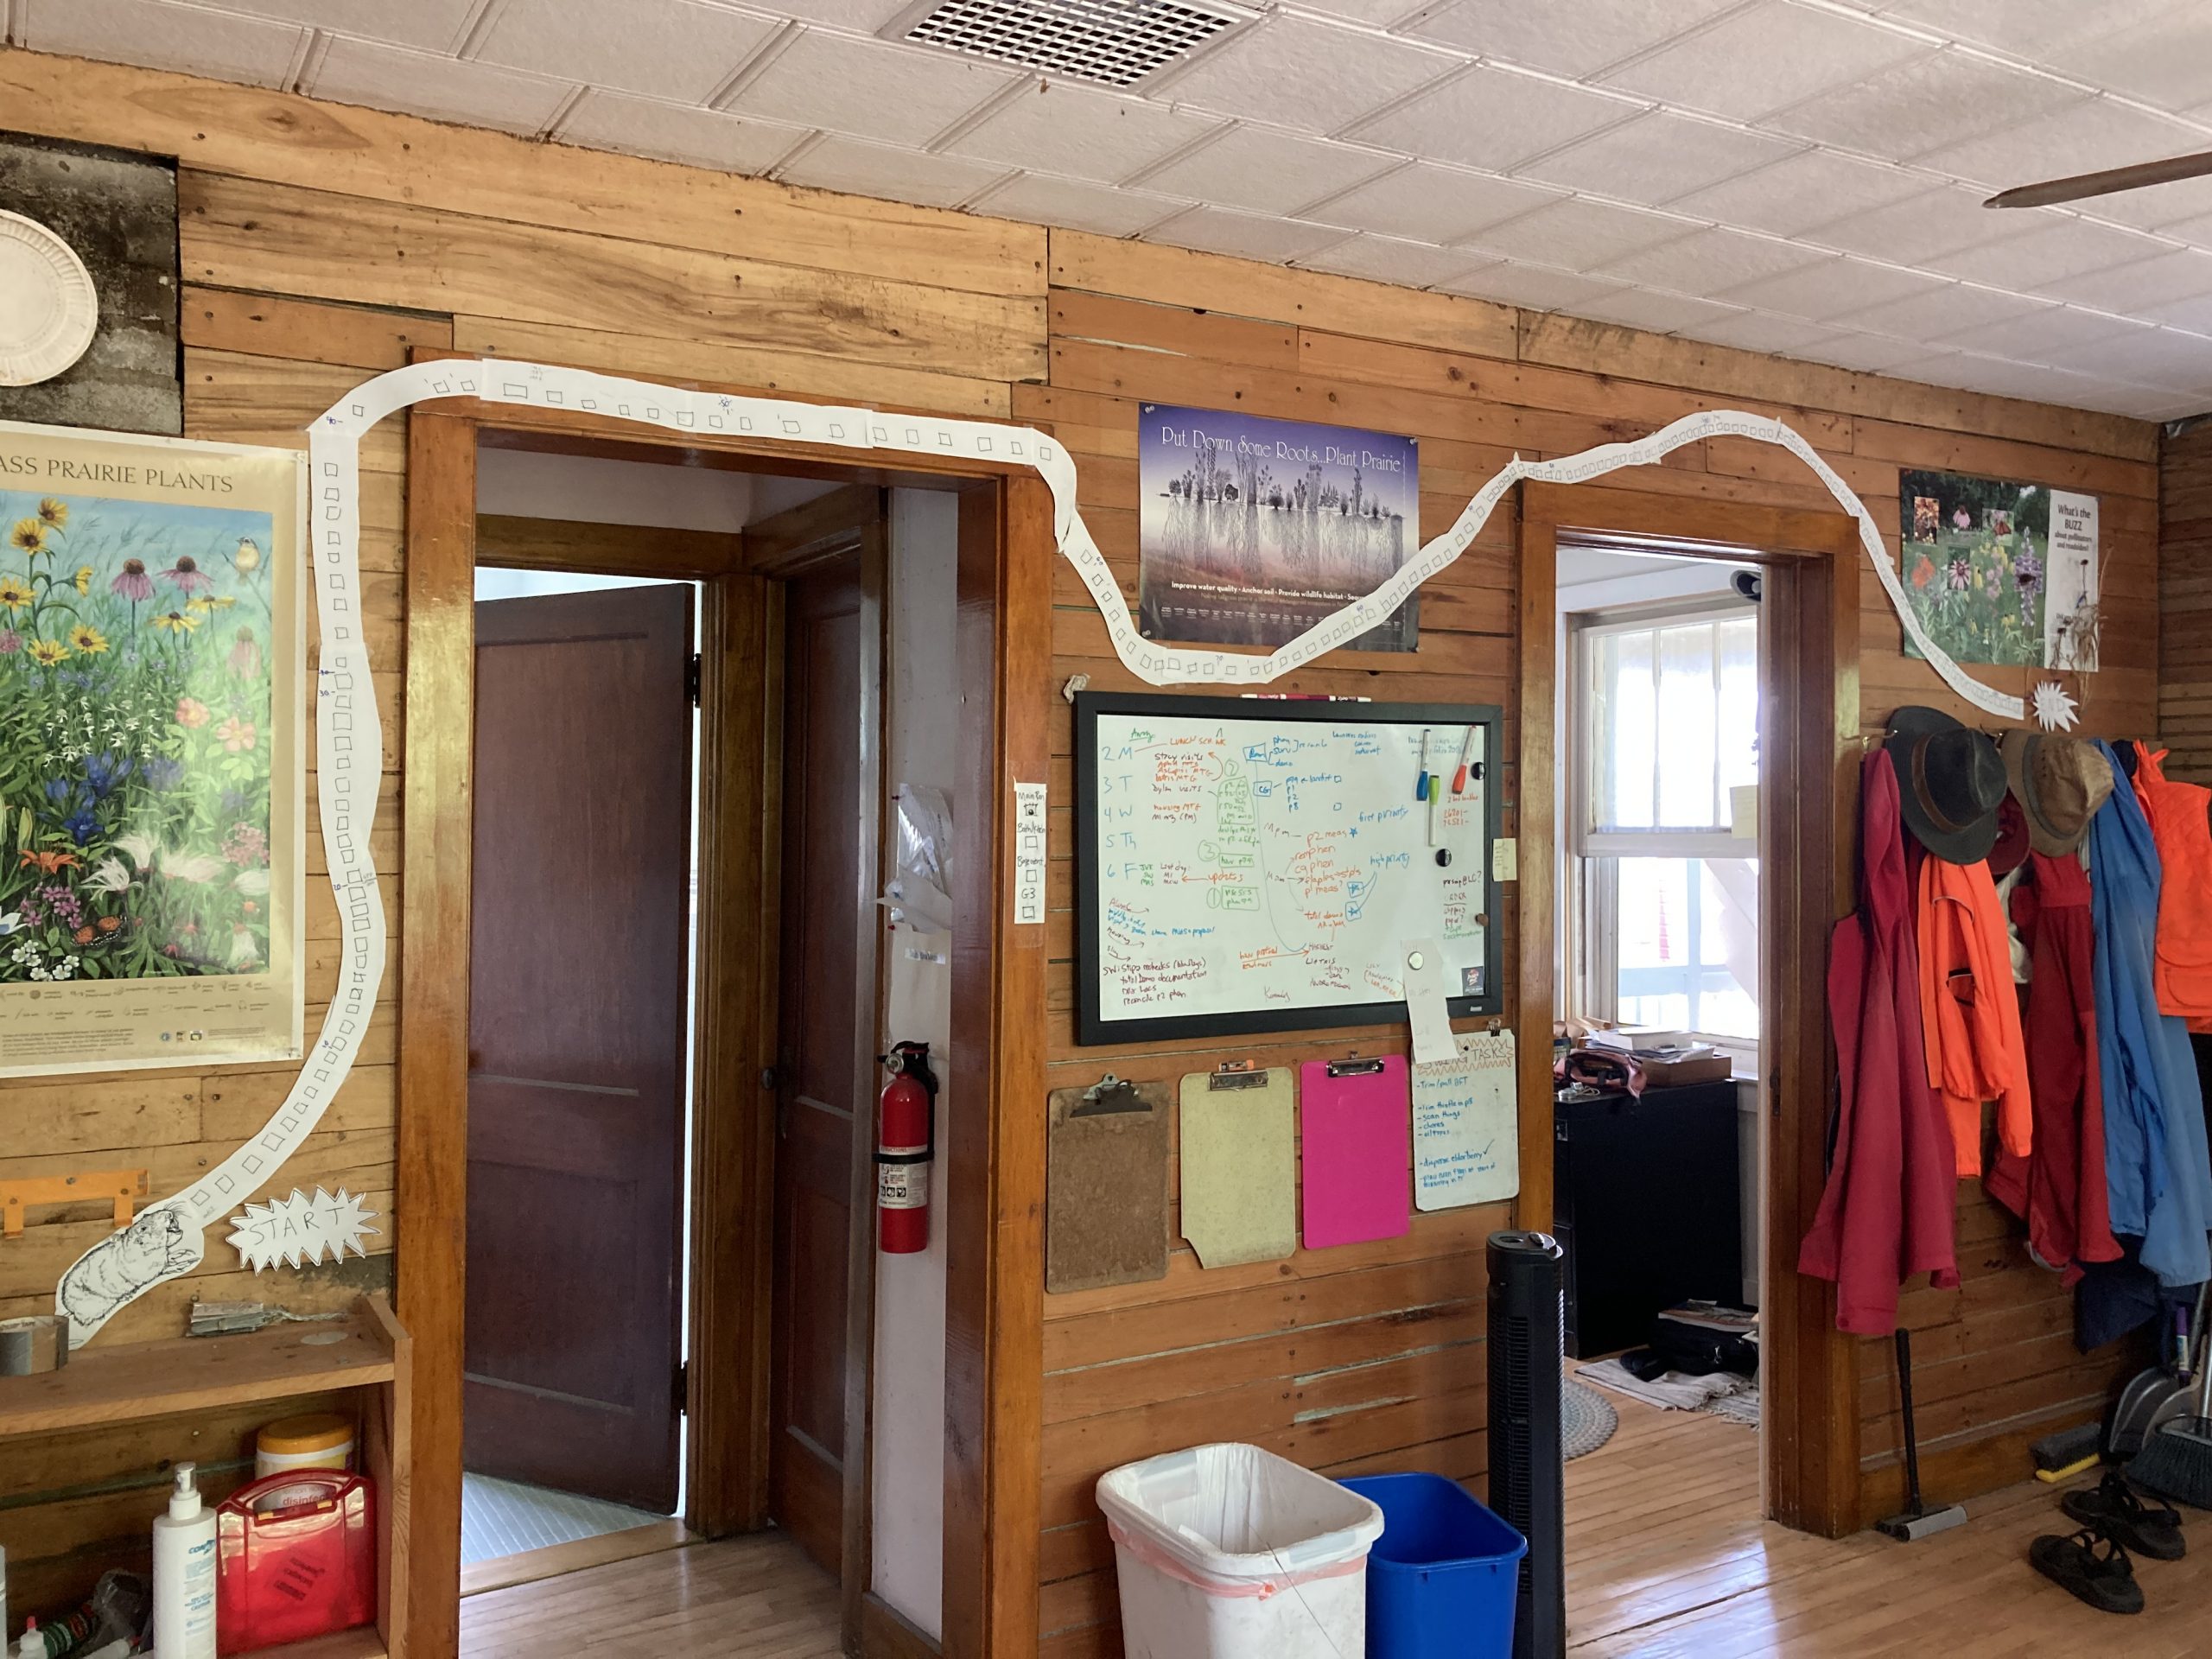
Team moral: Measuring experimental plot 1 is a large task for the team, it takes many days, usually hot days, with a project as large as this it is hard for the team to feel a sense of progress each day. So this year in hopes to keep the team more motivated I(Mia) took two strategies. First, we constructed a physical progress tracker, each square represented a segment in the plot A segment is a section of a row, rows are too big so we break them into sections for ease of measuring. After each day of measuring the team was able to count how many segments they completed and color in each square. The team had fun with their square decoration and got creative with it, there was various themes, fruits, names for peoples last days etc. I also made maps of the plot for each day of measuring that were color coded with what positions have been measured and which ones haven’t. Lastly, I do believe I may have bribed the team with cookies. Having multiple different forms of motivation, really kept the team motived and made the project less daunting. It was also added some excitement into measuring p1, a task that isn’t known for being too exciting.
one of the progress maps purple is done green is not done
one of the progress maps purple is done green is not done
A hearty crew finishing measuring p1 during one of the only rainy days of the season
Progress tracker aka Gopher tunnel of love
For more information on survival in common garden experiments, see this flog post about survival in common gardens.
Start year: Various, see individual listings above. First ever planting was 1996.
Location: Various, see above
Overlaps with: Pretty much everything we do.
Data/ materials collected: Measure data for all plots. All raw measure data available in cgData repository. Processed data should eventually be available in SQL database; ask GK for status of SQL database.
new p79 stake file: Jared made a cleaned up stake file for p7 and p9 that can be found here
p2 stake file/points shot: Amy shot points in p2 this year the points can be found in these 3 jobs
Since 1996, members of Team Echinacea have walked, crawled, and ~sometimes~ run next to rows of Echinacea angustifolia planted in common garden experiments. Although protocol varies depending on the experimental plot, every year team members record flowering phenology data, measuring data, and harvest the heads of the thousands of plants we have in common garden experiments.
Note that these experiments are not really gardens. “Common garden” refers to the experimental design. Most of our experimental plots are prairie restorations, a few are abandoned ag fields that are manged as grassland habitat. Some plots have multiple experiments within. The Echinacea Project currently has 10 established experimental plots:
exPts01-10. To avoid repetitiveness of reports on yearly phenology, measuring, and harvesting, this project status report will include updates on all experimental plots 1, 2, 4, 5, and 8. Reports for the others will be elsewhere: Amy Dykstra’s plot (exPt03), the hybrid plots (exPt06, exPt07, exPt09), and the West Central Area common garden (exPt10).
exPt01: Experimental plot 1 was first planted in 1996 (cleverly termed the 1996 cohort), and has been planted with nine other experiments in subsequent years, with the most recent planting being Amy Waananen’s inter-remnant crosses. It is the largest of the experimental plots, with over 10,000 planted positions; experiments in the plot include testing fitness differences between remnants (1996, 1997, 1999), quantifying effects of inbreeding (inb1, inb2), and assessing quantitative genetic variation (qgen1). There are also a number of smaller experiments in it, including fitness of Hesperostipa spartea, aphid addition and exclusion, and pollen addition and exclusion. In 2020, we visited 4,340 of the original 10,622 planted and found 3,258 alive. Only 484 plants were classified as “flowering” in exPt01 this year. This is a drastic increase from the nearly 70 plants that flowered in summer 2019 – perhaps it is a testament to the benefits of controlled burning (we burned in spring 2020 but not in 2019). In summer 2020, we harvested ~815 total Echinacea heads in exPt01 (I have not finished the reconciliation process). In the fall, we added 484 staples to positions where plants were gone for three straight years, however, we ran out of staples, so 130 of these positions have “flaples” which are bent pin flags.
exPt02: Heritability of flowering time is the name of the game in exPt02. Planted in 2006, exPt02 was planted to assess heritability of flowering start date and duration in Echinacea. In summer 2020, we visited 2,010 positions of the 3,961 positions originally planted. We measured 1,638 living plants, of which 444 were flowering. In the fall, we harvested ~626 heads from exPt02. We do not have an exact number of heads harvested from exPt02 yet, as we have not had time to complete head reconciliation. Location: Hegg Lake WMA
exPt04: Experimental plot 4 was planted to gauge whether Echinacea from small remnant populations could be genetically rescued via an outcross to larger, more genetically diverse populations. Caroline Ridley and other members planted this plot in 2008. We did not measure exPt04 this year. Location: Hegg Lake WMA
exPt05: The only experimental plot planted at Staffanson Prairie Preserve (SPP), exPt05, was planted to compare progeny of maternal plants from burned and unburned sections of SPP. There were 2800 plants planted originally, but high mortality made it impractical to visit the plot row-by-row. Now, we and treat the plot like demography. We use our survey-grade GPS to find plants in exPt05 that have previously flowered and add more plants to the stake file if new plants in the plot flower. In 2020 we found 11 living plants, two of which were flowering! There was only one head to collect, since one of the flowering plants exhibited only vertical development (no head). Location: Staffanson Prairie Preserve
exPt08: Team Echinacea established quantitative genetics experiments to quantify additive genetic variance of fitness in Echinacea, with the idea that we can estimate evolutionary potential of study populations. The maternal parents of qGen2 and qGen3 are plants in the 1996, 1997, and 1999 cohorts. These plants were crossed with pollen from plants in remnants to produce seed for qGen2 and qGen3, which now inhabit exPt08. Originally, 12,813 seeds were sown in the common garden. Seeds from the same cross (shared maternal and paternal plants) were sown in meter-long segments between nails. A total of 3,253 seedlings were originally found, but only 562 plants were found alive in 2020. There were 5 flowering plants in 2020, and 5 heads. Note that there were an additional 2 heads collected from transplant plot.
Plot management: To ensure that the common garden environment is as similar as possible to the prairie environment we must actively manage it. This management includes removing foreign species and supplementing with natives. One of our main management methods is through fire. We were unable to burn plots this fall however we hope to burn p8 and p1 this spring. We also collected seed to spread after burns including Schizachyrium scoparium, Bouteloua curtipendula, along with multiple species of Solidago and quite a few Asters.
Asclepias viridiflora in p1: In 2019, plugs of an uncommon prairie milkweed, Asclepias viridiflora, were planted in Experimental plot 1. The purpose of this experiment is to assess the survival and fitness of A. viridiflora. Assessing vitality will also provide a frame of reference for species conservation across modern prairies. In 2020 a protocol was developed to identify and measure A. viridiflora. These data are waiting to be entered and analyzed.
Hesperostipa demography: In 2009 and 2010, porcupine grass (Hesperostipa spartea, a.k.a. “stipa”) was planted in experimental plot 1. In total, 4417 seeds were planted, 1 m apart from each other and all 10 cm north of Echinacea plants. Between 2010 and 2013, each position was checked, and the plant status recorded. Since 2014, we have searched for flowering plants. The data from this summer can be found here cgdata/summer2020/stipaSearch, these data have not been processed yet.
Inb1: The INB1 experiment investigates the relationship between inbreeding level and fitness in Echinacea angustifolia. Each plant in experiment INB1 originates from one of three cross types, depending on the relatedness of the parents: between maternal half siblings; between plants from the same remnant, but not sharing a maternal or paternal parent; and between individuals from different remnants. We continued to measure fitness and flowering phenology in these plants. In 2020, of the original 557 plants in INB1, 111 were still alive. Of the plants that were alive this year, 30 (27%) were flowering. This is up from the 4% that were flowering last year. All individuals were planted in 2001.
qgen: The qGen1 (quantitative genetics) experiment in p1 was designed to quantify the heritability of traits in Echinacea angustifolia. We are especially interested in Darwinian fitness. Could fitness be heritable? During the summer of 2002 we crossed plants from the 1996 & 1997 cohorts of exPt01. We harvested heads, dissected achenes, and germinated seeds over the winter. In the Spring of 2003 we planted the resulting 4468 seedlings (this great number gave rise to this experiment’s nickname “big batch”). In 2020 we assessed survival and fitness measures of the qGen1 plants. 1,642 plants in qGen1 were alive in 2020. Of those, 17% flowered in 2020. All were planted in 2003.
Stuart and John measure Echinacea plants in exPt02 under a gloomy sky
For more information on survival in common garden experiments, see this flog post about survival in common gardens.
Start year: Various, see individual listings above. First ever planting was 1996.
Location: Various, see above
Overlaps with: Pretty much everything we do.
Data/ materials collected: Measure data for all plots. All raw measure data available in cgData repository. Processed data should eventually be available in SQL database; ask GK for status of SQL database. GPS points were shot for the exPt09 flowering plant. Find the GPS jobs containing the exPt09 corners here: Dropbox/geospatialDataBackup2020/convertedASVandCSV2020/EXPT9_20200917_DARW.asv The stake file to find exPt5 plants is here: Dropbox/geospatialDataBackup2020/stakeFiles2020/exPt05stakeFile.csv Products: Many publications and independent projects.
Each year, we assess flowering phenology in experimental plots to determine mating potential for individual plants and see how a number of factors may affect flowering phenology. Some of the factors we have investigated in the past include heritability, burning, and climate.
2019 was truly a special year for Echinacea flowering phenology in experimental plots. There were flowering plants in four – yes FOUR – experimental plots. We had the usual flowering plants in exPt1 and exPt2 at Hegg Lake. We also had a flowering plant in exPt8 (qgen2 and qgen3) and exPt9 at Hegg Lake. Unfortunately, we did not see the flowering plant with an E. pallida dam at exPt9 until late in the season, so we did not take phenology in exPt9.
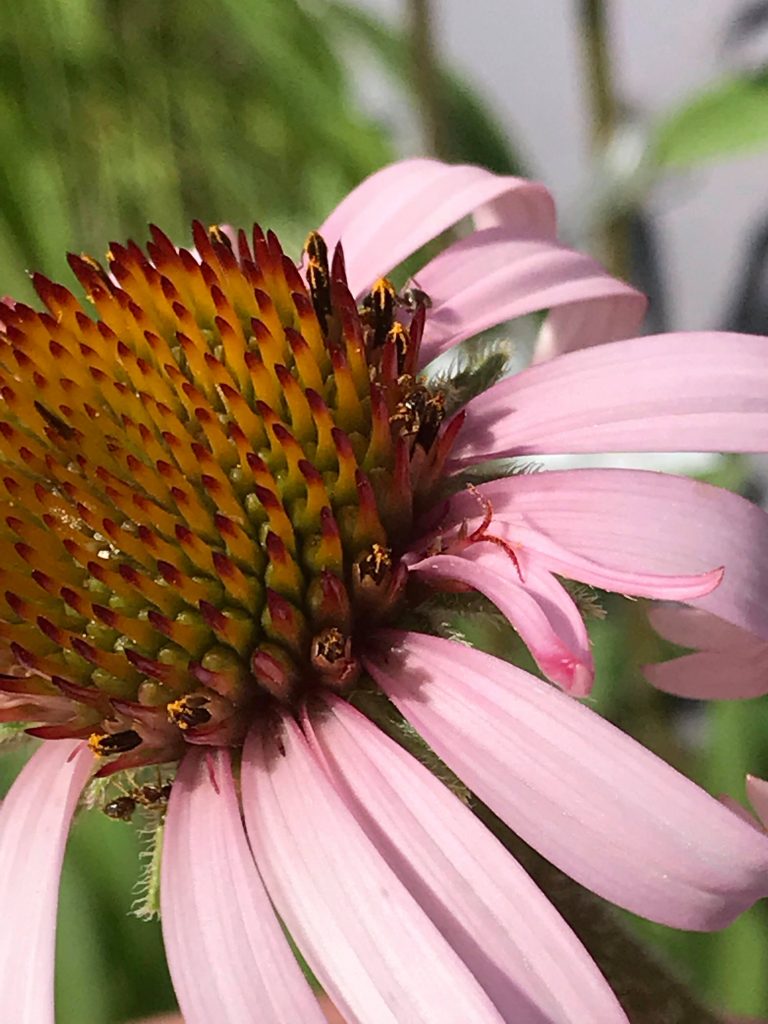
This Echinacea head is mid-flowering. It has more than 2 rows shedding pollen and more than 11 immature florets.
This year, we visited the three other plots and followed the usual Echinacea phenology protocol. We recorded first flowering day and subsequently recorded dates of “mid” and “late” flowering. Finally, we recorded the final flowering date of each plant.
In addition to the single flowering plants in exPt8 and exPt9, exPt1 had 63 flowering heads we tracked for phenology and exPt2 had a whopping 1207! The first flowering head in exPt1 started on July 3rd, while the first head in exPt2 started flowering on July 1st. The last day of flowering in exPt1 and exPt2 was August 21st. What a long summer of taking phenology data!
Data/
materials collected:phenology data (start date, mid flowering, end date,
etc…), harvested heads for the ACE protocol. All phenology data can be found in
the cgData repository in the subfolder p1p2Phenology.
This is going to be a joint flog post for Sunday and Monday (mostly Sunday…).
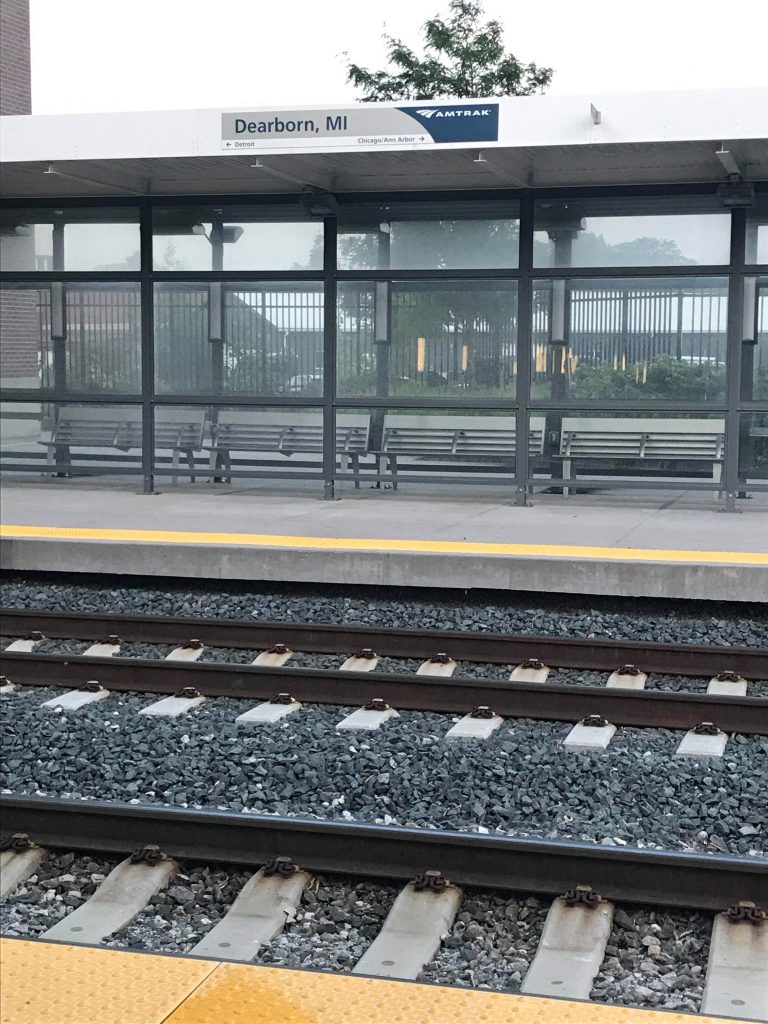
Sunday was a travel day for me. I woke up at 5:30 am and hopped on the Amtrak train in Dearborn, Michigan and headed back to Chicago, Illinois.
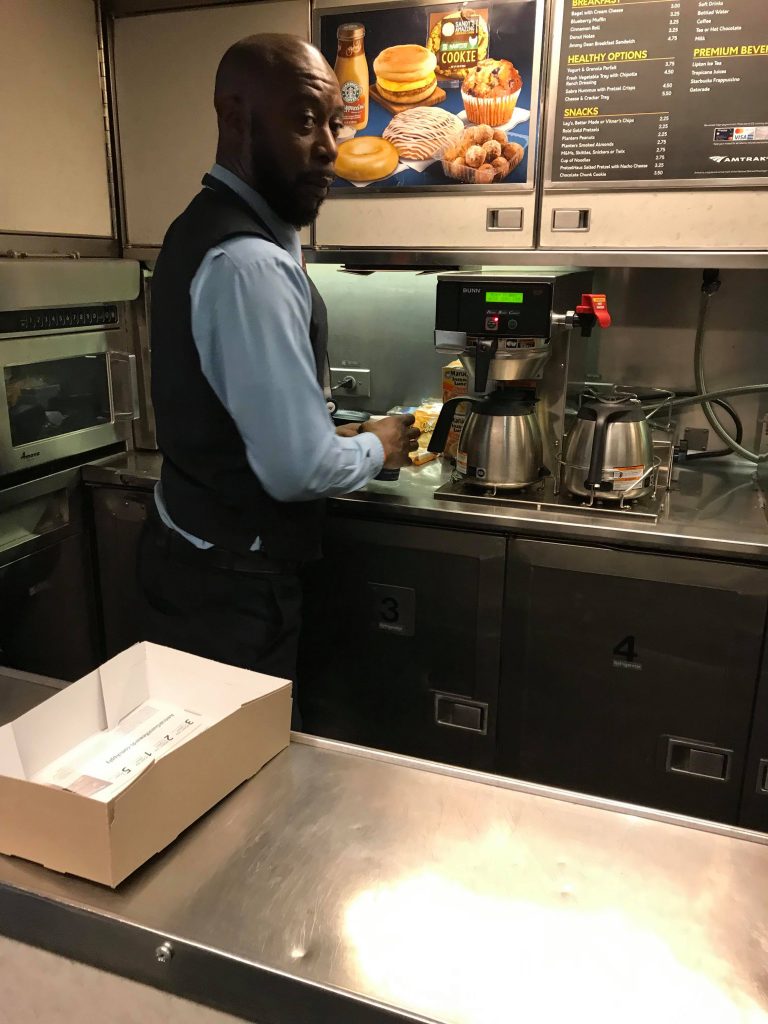
While on the train I worked on revisions for my Master’s thesis and worked on a poem while I drank my coffee.
Thank you Amtrak Employee for the coffee.
When I arrived in Chicago, I had two hours to kill before my next train. So, I grabbed lunch at Chipotle and hung out in the main hall of Chicago’s Union Station.
These statues at Chicago Union Station are supposed to represent Night and Day.
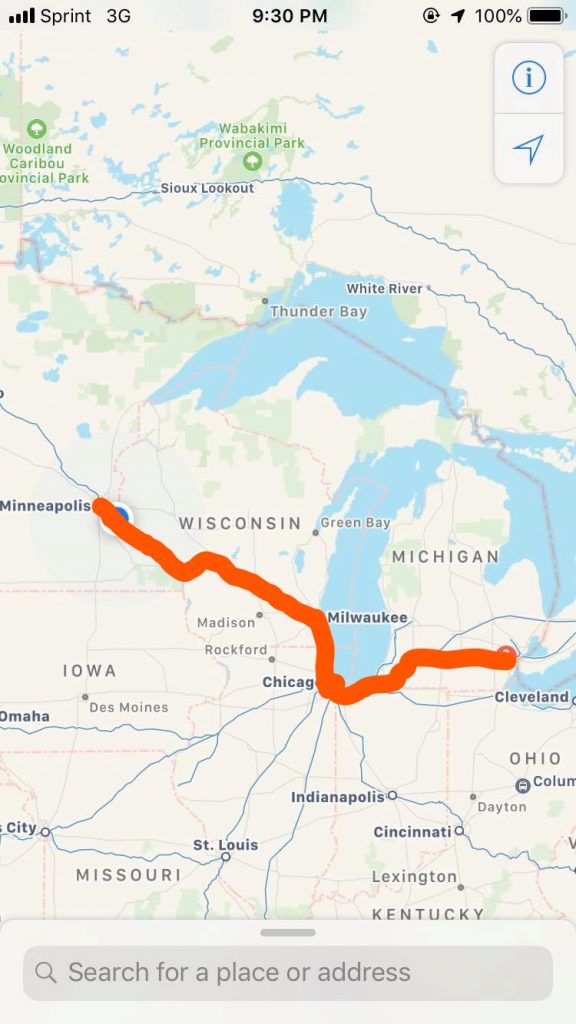
While on the train from Chicago to Minneapolis, Minnesota I worked on my Master’s thesis some more.
My Amtrak trek from Dearborn, MI to Minneapolis, MN.
When I arrived in Minneapolis I had to take the Green Line to Stuart’s brother’s house. This is where I left my car while I was out of town. So, here is a thank you to him and his family for that!
No tickets or tows There went my remaining woes I am so thankful
Finally arrived in Kensington, Minnesota around 1:15 am and in bed by 2 am.
Woke up Monday and got to work with Team Echinacea after my week away! We went out to Experimental Plot 2 and took phenology data and administered our pulse/steady pollination treatments.
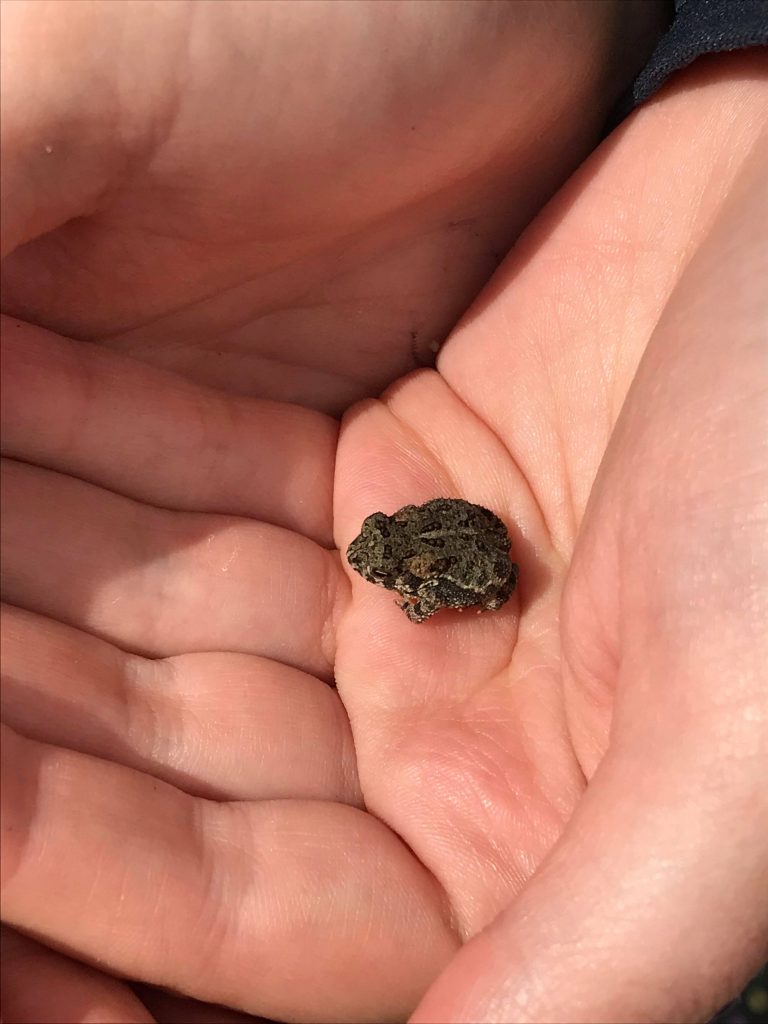
Julie found a toad.
After work in P2 I went out to Riley and collected seeds.
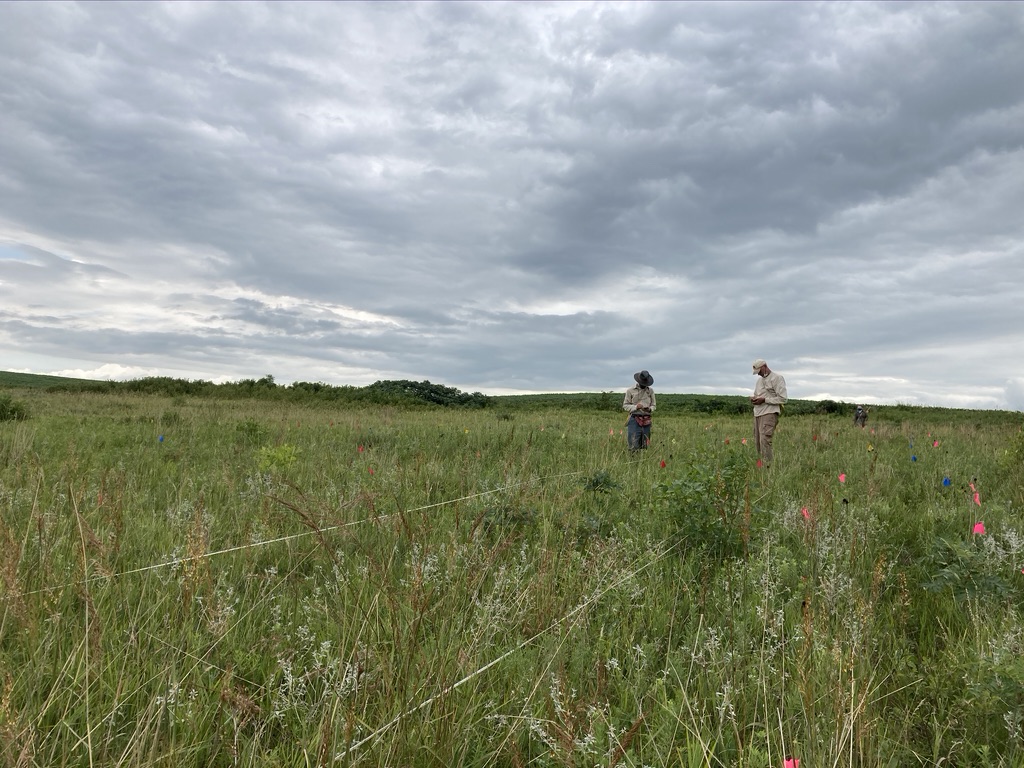
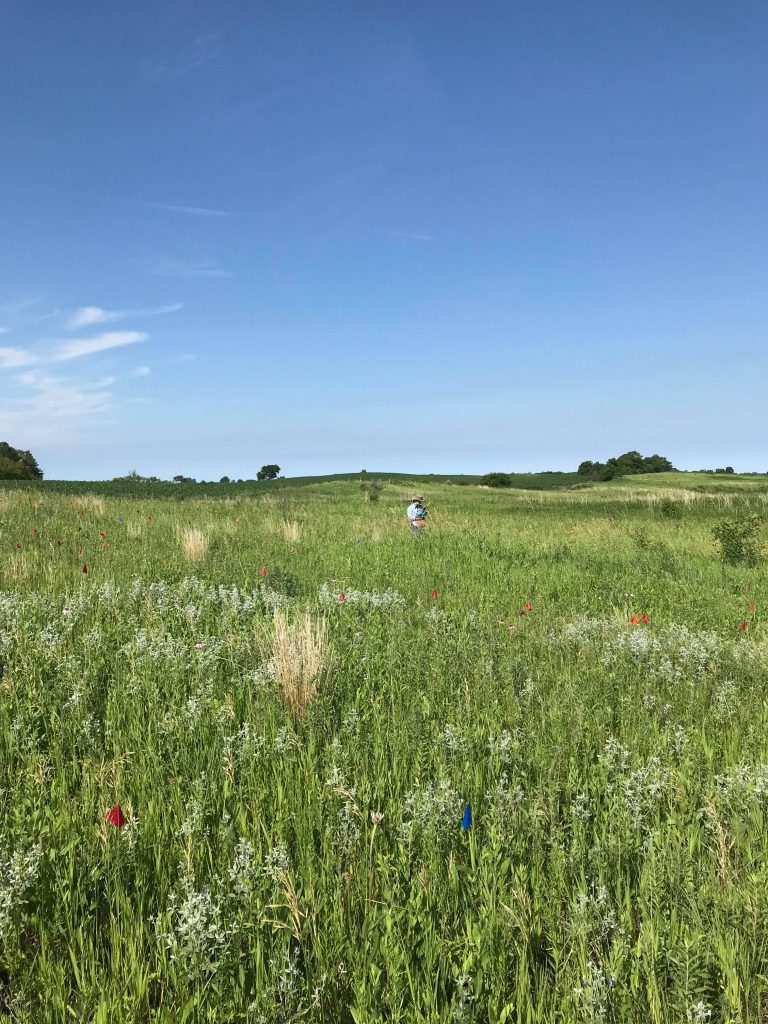
Saturday started with the three present townhallers (Erin, Julie, and myself) heading out to the field with John and Stuart in order to collect phenology data from one of our experimental plots. Jay and Riley decided to take a trip back to their undergrad institute for the weekend and Shea had prior commitments too.
Julie taking phenology measurementsPollination or just visitors? How do we assess the quality of species interactions?
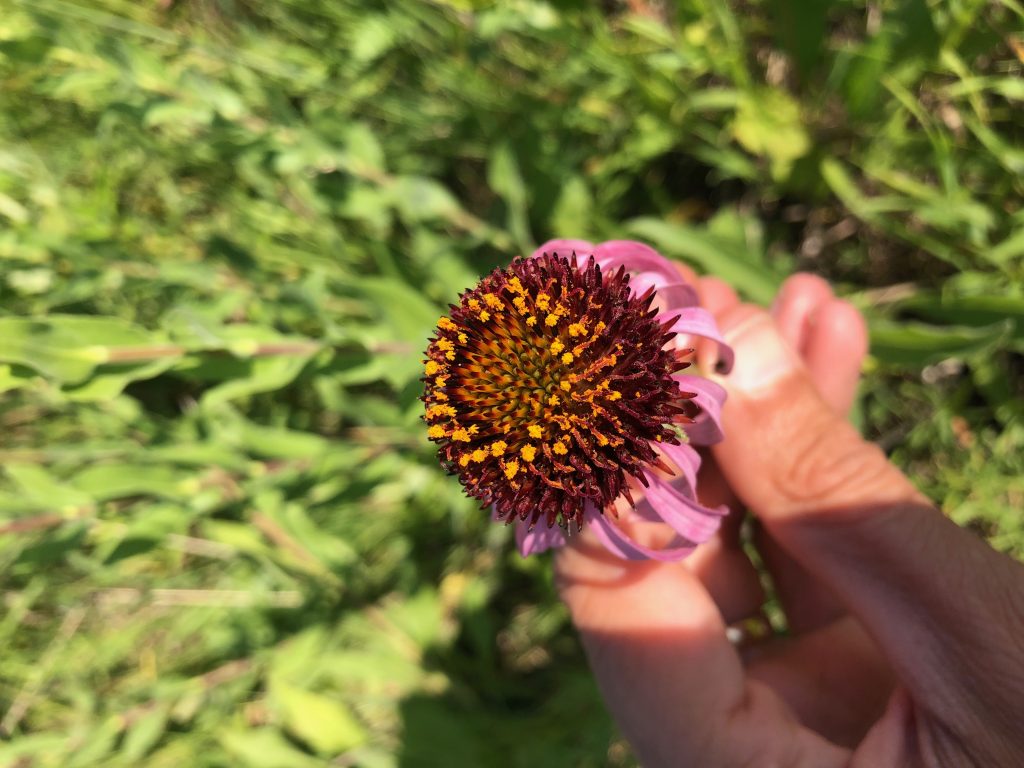
Erin and I stumbled upon a mutant floret on an Echinacea. Typically the ray florets (the long pink ones people usually think of as petals) are sterile and have unforked stigma but this one has a forked stigma! Question is it receptive to pollen?
Mutant floret
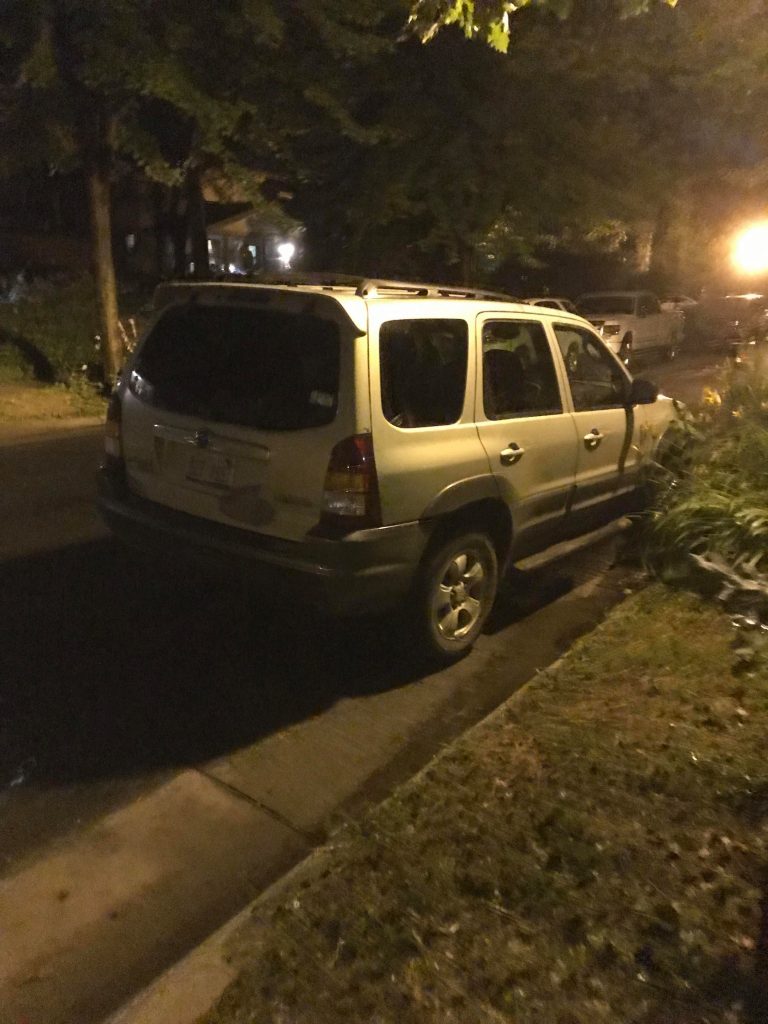
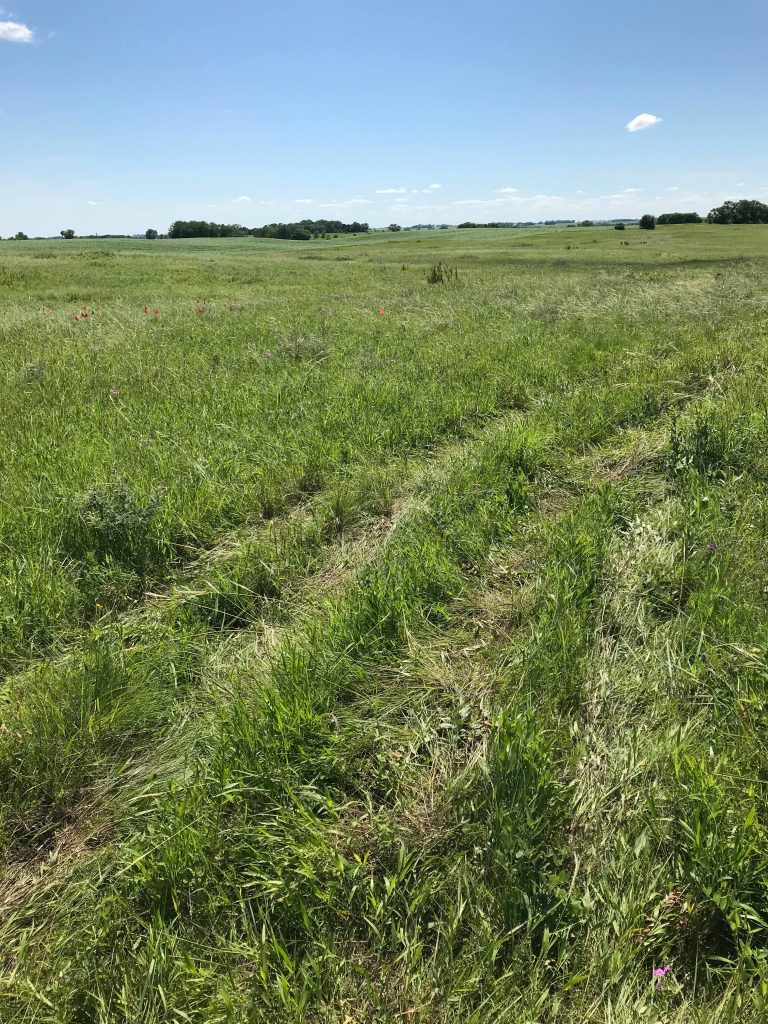
Once we finished up our phenology data collection we headed back to town hall to relax. However, I decided to take a trip out to Staffanson to work on some poems and found that someone had driven through the remnant prairie!
The scene of the crime…
I have no idea who did this or why but it made me fairly disappointed. Nevertheless, I had a productive afternoon in Staffanson.
This year, the number of flowering plants in our main experimental plot (exPt1) dropped in half compared to last year. This might be due to the lack of a burn in the prior fall or spring. Plot 2 (exPt2) had about the same number of heads in ’16 & ’17.
In exPt1, we kept track of approximately 72 heads. The peak date was July 19th. The first head started flowering on July 2nd and the last head finished up on August 21st. In contrast, we kept track of 1076 heads in exPt2, about 140 more than last year! The peak date for these Echinacea was a bit earlier, July 13th. exPt2 heads also started and ended earlier (June 22 – August 19).
We harvested the heads at the end of the field season and brought them back to the lab, where we will count fruits (achenes) and assess seed set.
Flowering schedules for 2017 in exPt1 and exPt2. Black dots indicate the number of flowering heads on each date. Gray horizontal line segments represent the duration of each head’s flowering and are ordered by start date. The solid vertical line indicates peak flowering, while the dashed lines indicate the dates when 25% and 75% of heads had begun flowering, respectively. Note the difference in y-axes between the two plots. Click to enlarge!
Physical specimens: Harvested heads from both experimental plots are in the lab at CBG. The ACE protocol for these heads will begin soon.
Data collected: We visit all plants with flowering heads every 2-3 days starting before they flower until they are done flowering to record start and end dates of flowering for all heads. We managed phenology data in R and added it to our long-term dataset. The figures above were generated using package mateable in R. If you want to make figures like this one, download package mateable from CRAN!
You can find more information about phenology in experimental plots and links to previous flog posts regarding this experiment at the background page for the experiment.
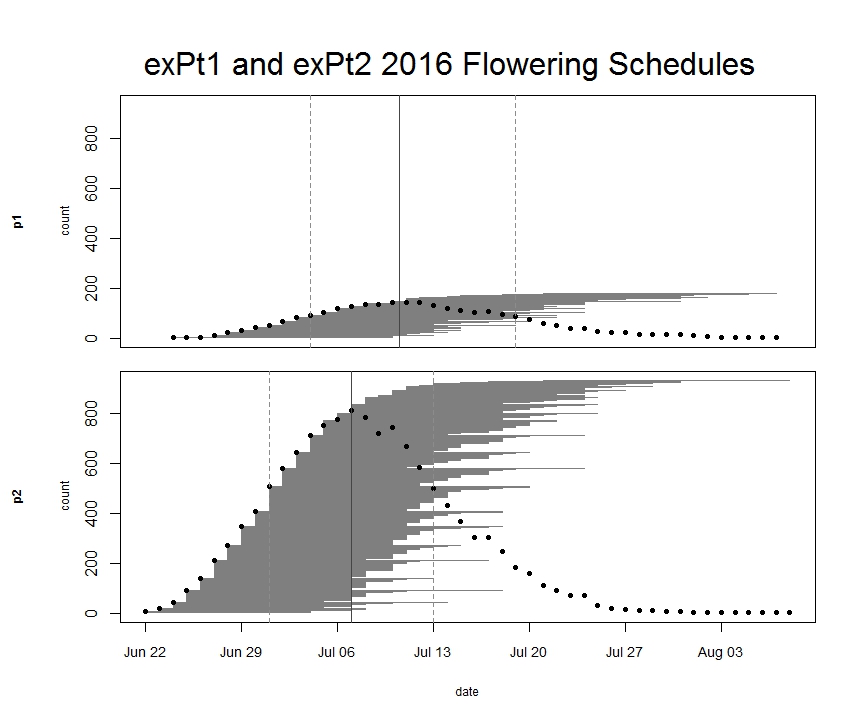
Every year we keep track of flowering phenology in our main experimental plots, exPt1 and exPt2. Fewer plants than usual flowered in exPt1 in 2016: 149 plants (179 heads) flowered between June 24th and August 7th. The population’s mean start date of flowering was July 5th and the mean end date was July 18th. Peak flowering in 2016 was on July 10th, when 143 heads were in flower. For comparison, peak flowering in 2015 was on July 27th, when there were nearly 10x as many heads flowering as on this year’s peak. The earlier phenology and low numbers of flowering we observed this year relative to 2015 is likely due at least in part to the plot burn schedule (2015 was a burn year and 2016 was a non-burn year), but there were still many fewer flowering plants than any season, burn or non-burn, in the past 10 years.
We kept track of 934 flowering heads in ExPt2, where the first head started shedding pollen on June 22 and the latest bloomer ended flowering on August 8th. Peak flowering was on July 7th, when 810 heads were flowering. ExPt2 was designed to study the heritability of phenology—you can read more about progress of that experiment in the upcoming 2016 heritability of phenology project status update.
At the end of the season we harvested the heads and brought them back to the lab, where we will count fruits (achenes) and assess seed set.
ExPt1 and Expt2 flowering schedules from 2016. Dots represent the number of flowering heads on each date. Horizontal line segments represent the duration of each heads flowering and are ordered by start date. The solid vertical line indicates peak flowering, while the dashed lines indicate the dates when 25% and 75% of heads had begun flowering, respectively. Click to enlarge!
Physical specimens: We harvested 177 heads from exPt1 and 870 from exPt2. Attentive readers may note that we harvested about 64 fewer heads than we tracked for phenology. That’s because before we could harvest many seedheads at exPt2, rodents chewed through their stems and ate some fruits (achenes). We recovered most of the heads that were grazed from the ground and made estimates of number of fruits lost due to herbivory, but we couldn’t find some heads. Arg. We brought the harvest back to the lab, where we will count fruits and assess seed set.
Data collected: We visit all plants with flowering heads every three days until they are done flowering to record start and end dates of flowering for all heads. We managed phenology data in R and added it to the full dataset. The figure above was generated using package mateable in R. If you want to make figures like this one, download package mateable from CRAN!
You can find more information about phenology in experimental plots and links to previous flog posts regarding this experiment at the background page for the experiment.