
Since 1996, members of Team Echinacea have walked, crawled, and ~sometimes~ run next to rows of Echinacea angustifolia planted in common garden experiments. Although protocol varies depending on the experimental plot, every year team members record flowering phenology data, measuring data, and harvest the heads of the thousands of plants we have in common garden experiments.
Note that these experiments are not really gardens. “Common garden” refers to the experimental design. Most of our experimental plots are prairie restorations, a few are abandoned ag fields that are manged as grassland habitat. Some plots have multiple experiments within. The Echinacea Project currently has 10 established experimental plots:
exPts01-10. To avoid repetitiveness of reports on yearly phenology, measuring, and harvesting, this project status report will include updates on all experimental plots 1, 4, 5, and 8. Reports for the others will be elsewhere: Jennifer’s plot (exPt02) Amy Dykstra’s plot (exPt03), the hybrid plots (exPt06, exPt07, exPt09), and the West Central Area common garden (exPt10).
exPt01: Experimental plot 1 was first planted in 1996 (cleverly termed the 1996 cohort), and has been planted with nine other experiments in subsequent years, with the most recent planting being Amy Waananen’s inter-remnant crosses. It is the largest of the experimental plots, with over 10,000 planted positions; experiments in the plot include testing fitness differences between remnants (1996, 1997, 1999), quantifying effects of inbreeding (inb1, inb2), and assessing quantitative genetic variation (qgen1). There are also a number of smaller experiments in it, including fitness of Hesperostipa spartea, aphid addition and exclusion, and pollen addition and exclusion. In 2021, we visited 6,673 of the original 10,673 planted and found 3,085 alive. Only 79 plants were classified as “flowering” in exPt01 this year. This is a drastic decrease from the 484 plants that flowered in summer 2020 – perhaps it is a testament to the benefits of controlled burning (we burned in spring 2020 but not in 2021). In summer 2021, we harvested 77 total Echinacea heads in exPt01 (we have not finished the inventory process). In the fall, we added 403 staples to positions where plants were gone for three straight years. We also converted the flaple>s (pin flags bent in half in spots where we ran out of staples) into regular old staples. There are no more flaples in p1!
exPt04: Experimental plot 4 was planted to gauge whether Echinacea from small remnant populations could be genetically rescued via an outcross to larger, more genetically diverse populations. Caroline Ridley and other members planted this plot in 2008. We did not measure exPt04 this year, but there were no flowering plants. Location: Hegg Lake WMA
exPt05: The only experimental plot planted at Staffanson Prairie Preserve (SPP), exPt05, was planted to compare progeny of maternal plants from burned and unburned sections of SPP. There were 2800 plants planted originally, but high mortality made it impractical to visit the plot row-by-row. Now, we and treat the plot like demography. We use our survey-grade GPS to find plants in exPt05 that have previously flowered and add more plants to the stake file if new plants in the plot flower. In 2021 we found 11 living plants, three of which were flowering! There was only two head to collect, one head was toppled. Location: Staffanson Prairie Preserve
exPt08: Team Echinacea established quantitative genetics experiments to quantify additive genetic variance of fitness in Echinacea, with the idea that we can estimate evolutionary potential of study populations. The maternal parents of qGen2 and qGen3 are plants in the 1996, 1997, and 1999 cohorts. These plants were crossed with pollen from plants in remnants to produce seed for qGen2 and qGen3, which now inhabit exPt08. Originally, 12,813 seeds were sown in the common garden. Seeds from the same cross (shared maternal and paternal plants) were sown in meter-long segments between nails. A total of 3,253 seedlings were originally found, but only 443 plants were found alive in 2021. There were 28 flowering plants in 2021, and 32 heads. This is the most flowering heads in p8 we have ever seen, the first year plants flowered in p8 was 2019 and in 2020 five plants flowered. Note that there were an additional 14 heads collected from transplant plot.
Plot management: To ensure that the common garden environment is as similar as possible to the prairie environment we must actively manage it. This management includes removing foreign species and supplementing with natives. One of our main management methods is through fire. We were able to burn burn p8 this spring and hope to burn p1 this spring. We also collected seed to spread after burns including Schizachyrium scoparium, Bouteloua curtipendula, along with multiple species of Solidago and quite a few Asters.
Asclepias viridiflora in p1: In 2019, plugs of an uncommon prairie milkweed, Asclepias viridiflora, were planted in Experimental plot 1. The purpose of this experiment is to assess the survival and fitness of A. viridiflora. Assessing vitality will also provide a frame of reference for species conservation across modern prairies. We did not assess the A. viridiflora plants this year.
Hesperostipa demography: In 2009 and 2010, porcupine grass (Hesperostipa spartea, a.k.a. “stipa”) was planted in experimental plot 1. In total, 4417 seeds were planted, 1 m apart from each other and all 10 cm north of Echinacea plants. Between 2010 and 2013, each position was checked, and the plant status recorded. Since 2014, we have searched for flowering plants. The data from this summer can be found here cgdata/summer2021/stipaSearch & Dropbox/CGData/Stipa/225_measure/measure2021 in addition to data in these locations there may be paper data sheets that may or may not have been entered yet. These data have not been processed yet.
Inb1: The INB1 experiment investigates the relationship between inbreeding level and fitness in Echinacea angustifolia. Each plant in experiment INB1 originates from one of three cross types, depending on the relatedness of the parents: between maternal half siblings; between plants from the same remnant, but not sharing a maternal or paternal parent; and between individuals from different remnants. We continued to measure fitness and flowering phenology in these plants. In 2021, of the original 557 plants in INB1, 95 were still alive. Of the plants that were alive this year, there was only one flowering plant. All individuals were planted in 2001.
qgen: The qGen1 (quantitative genetics) experiment in p1 was designed to quantify the heritability of traits in Echinacea angustifolia. We are especially interested in Darwinian fitness. Could fitness be heritable? During the summer of 2002 we crossed plants from the 1996 & 1997 cohorts of exPt01. We harvested heads, dissected achenes, and germinated seeds over the winter. In the Spring of 2003 we planted the resulting 4468 seedlings (this great number gave rise to this experiment’s nickname “big batch”). In 2021 we assessed survival and fitness measures of the qGen1 plants. 1,519 plants in qGen1 were alive in 2021. Of those, 2.4% flowered in 2021, this is down from 17% last year. All were planted in 2003.
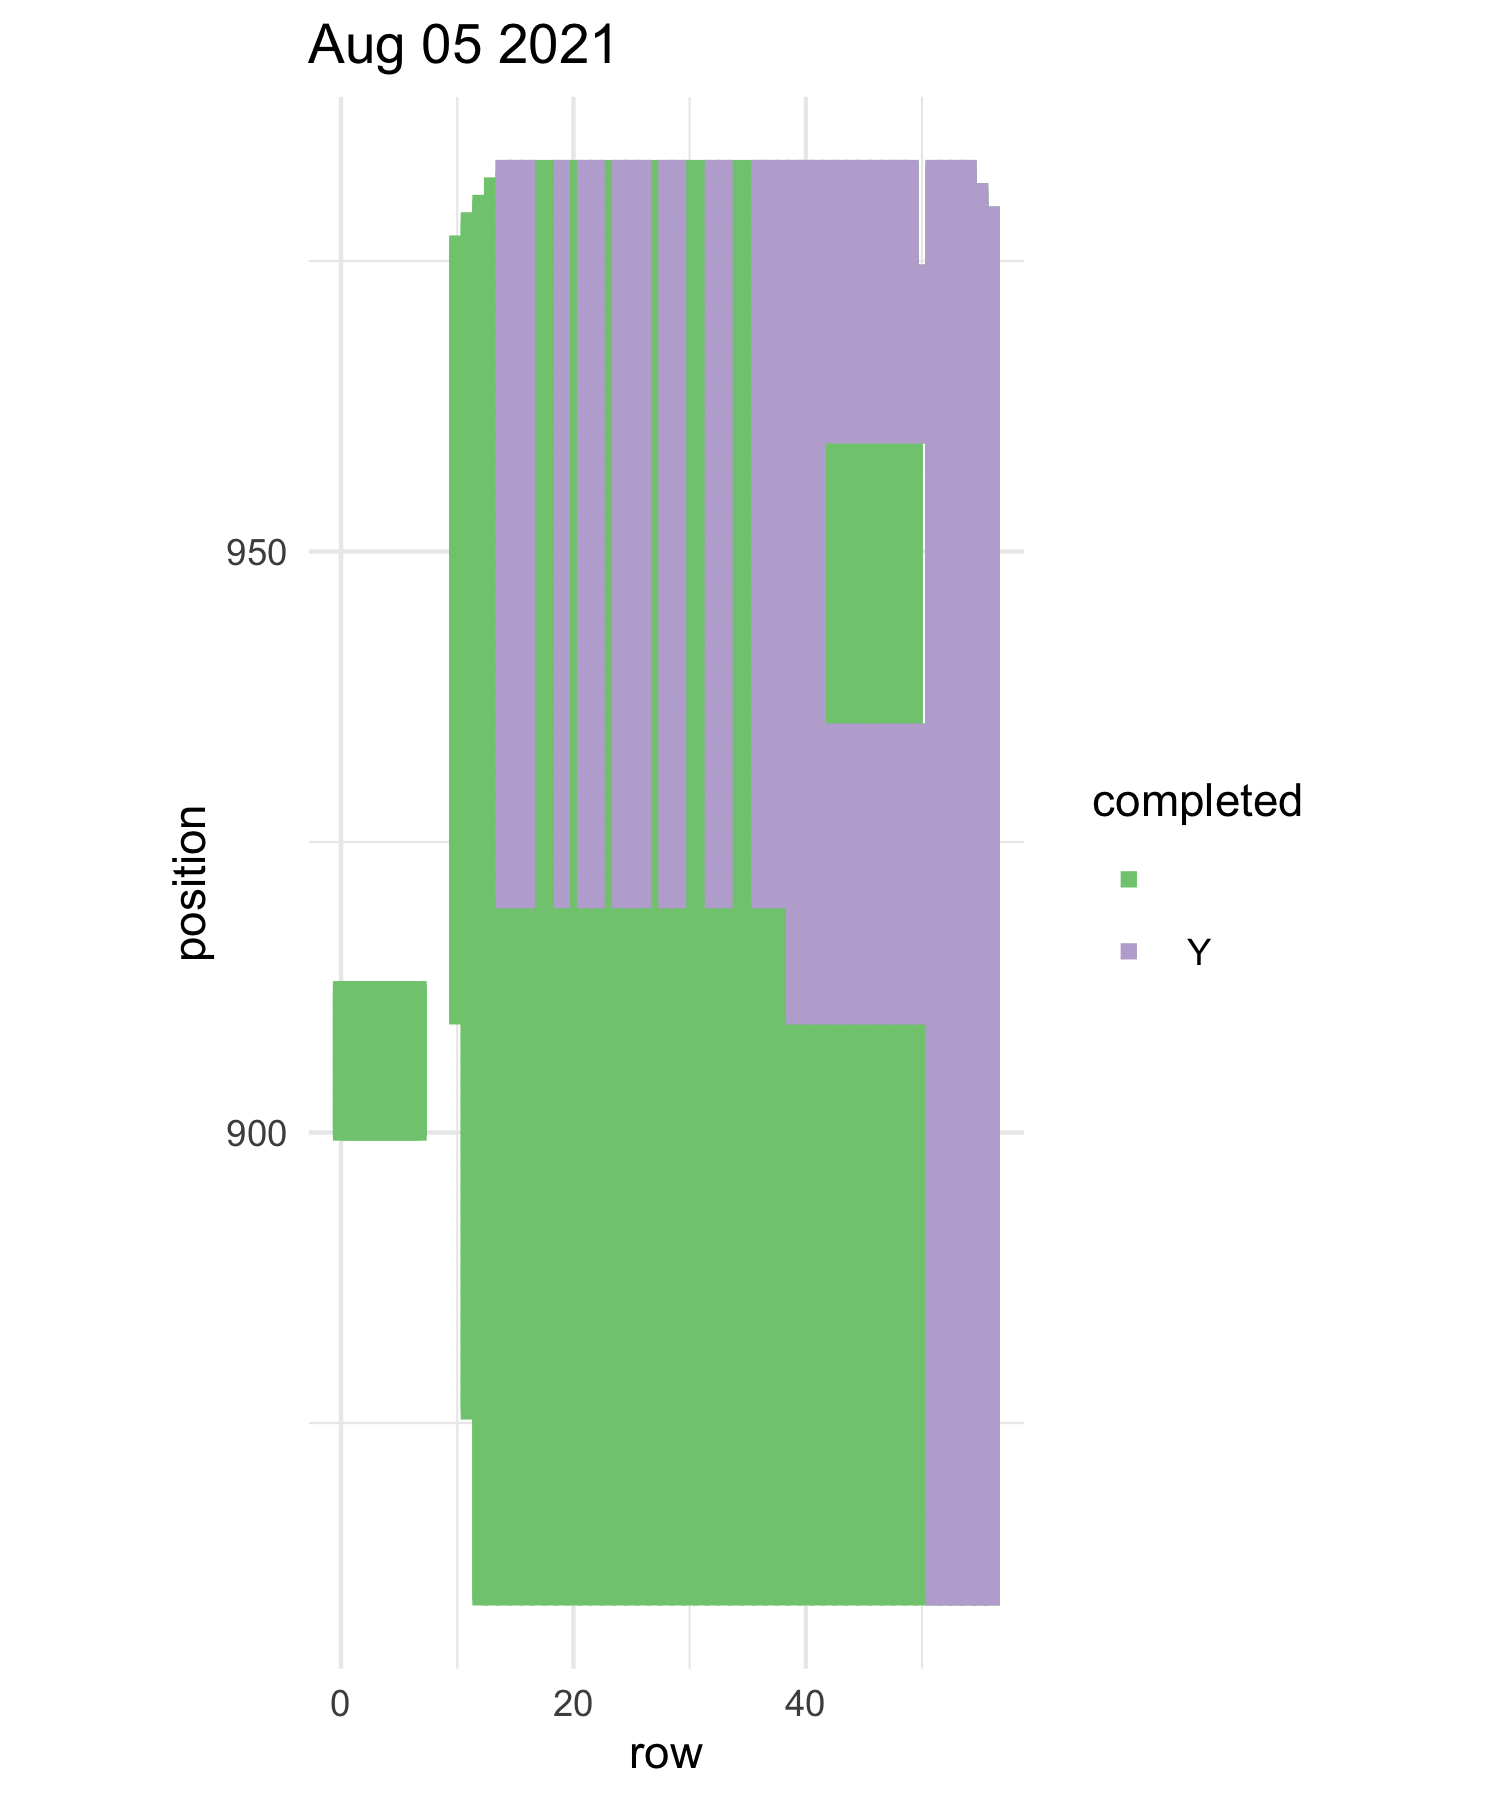
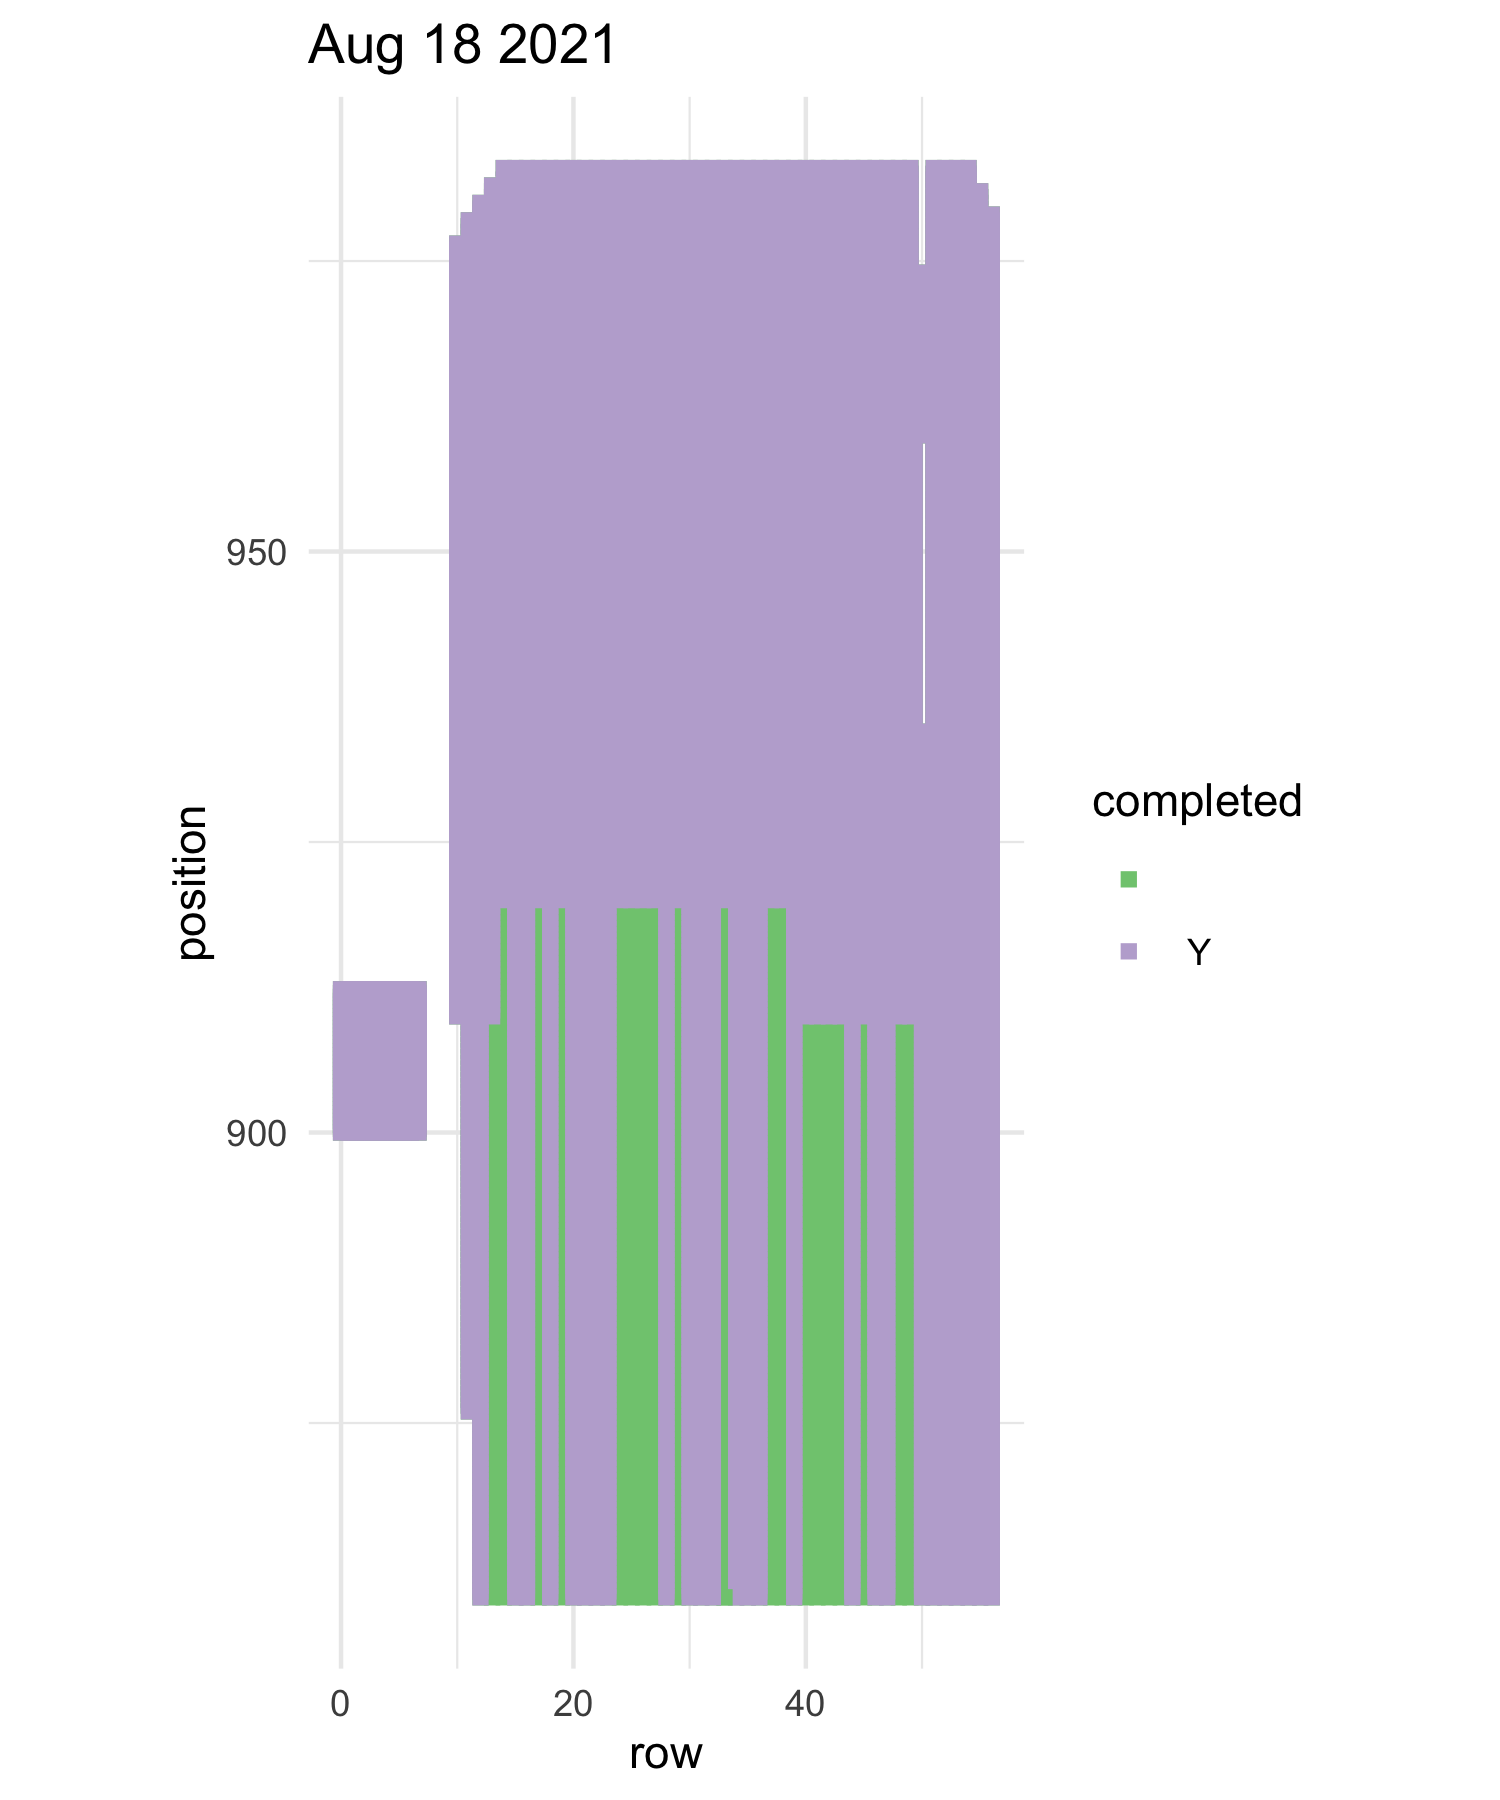
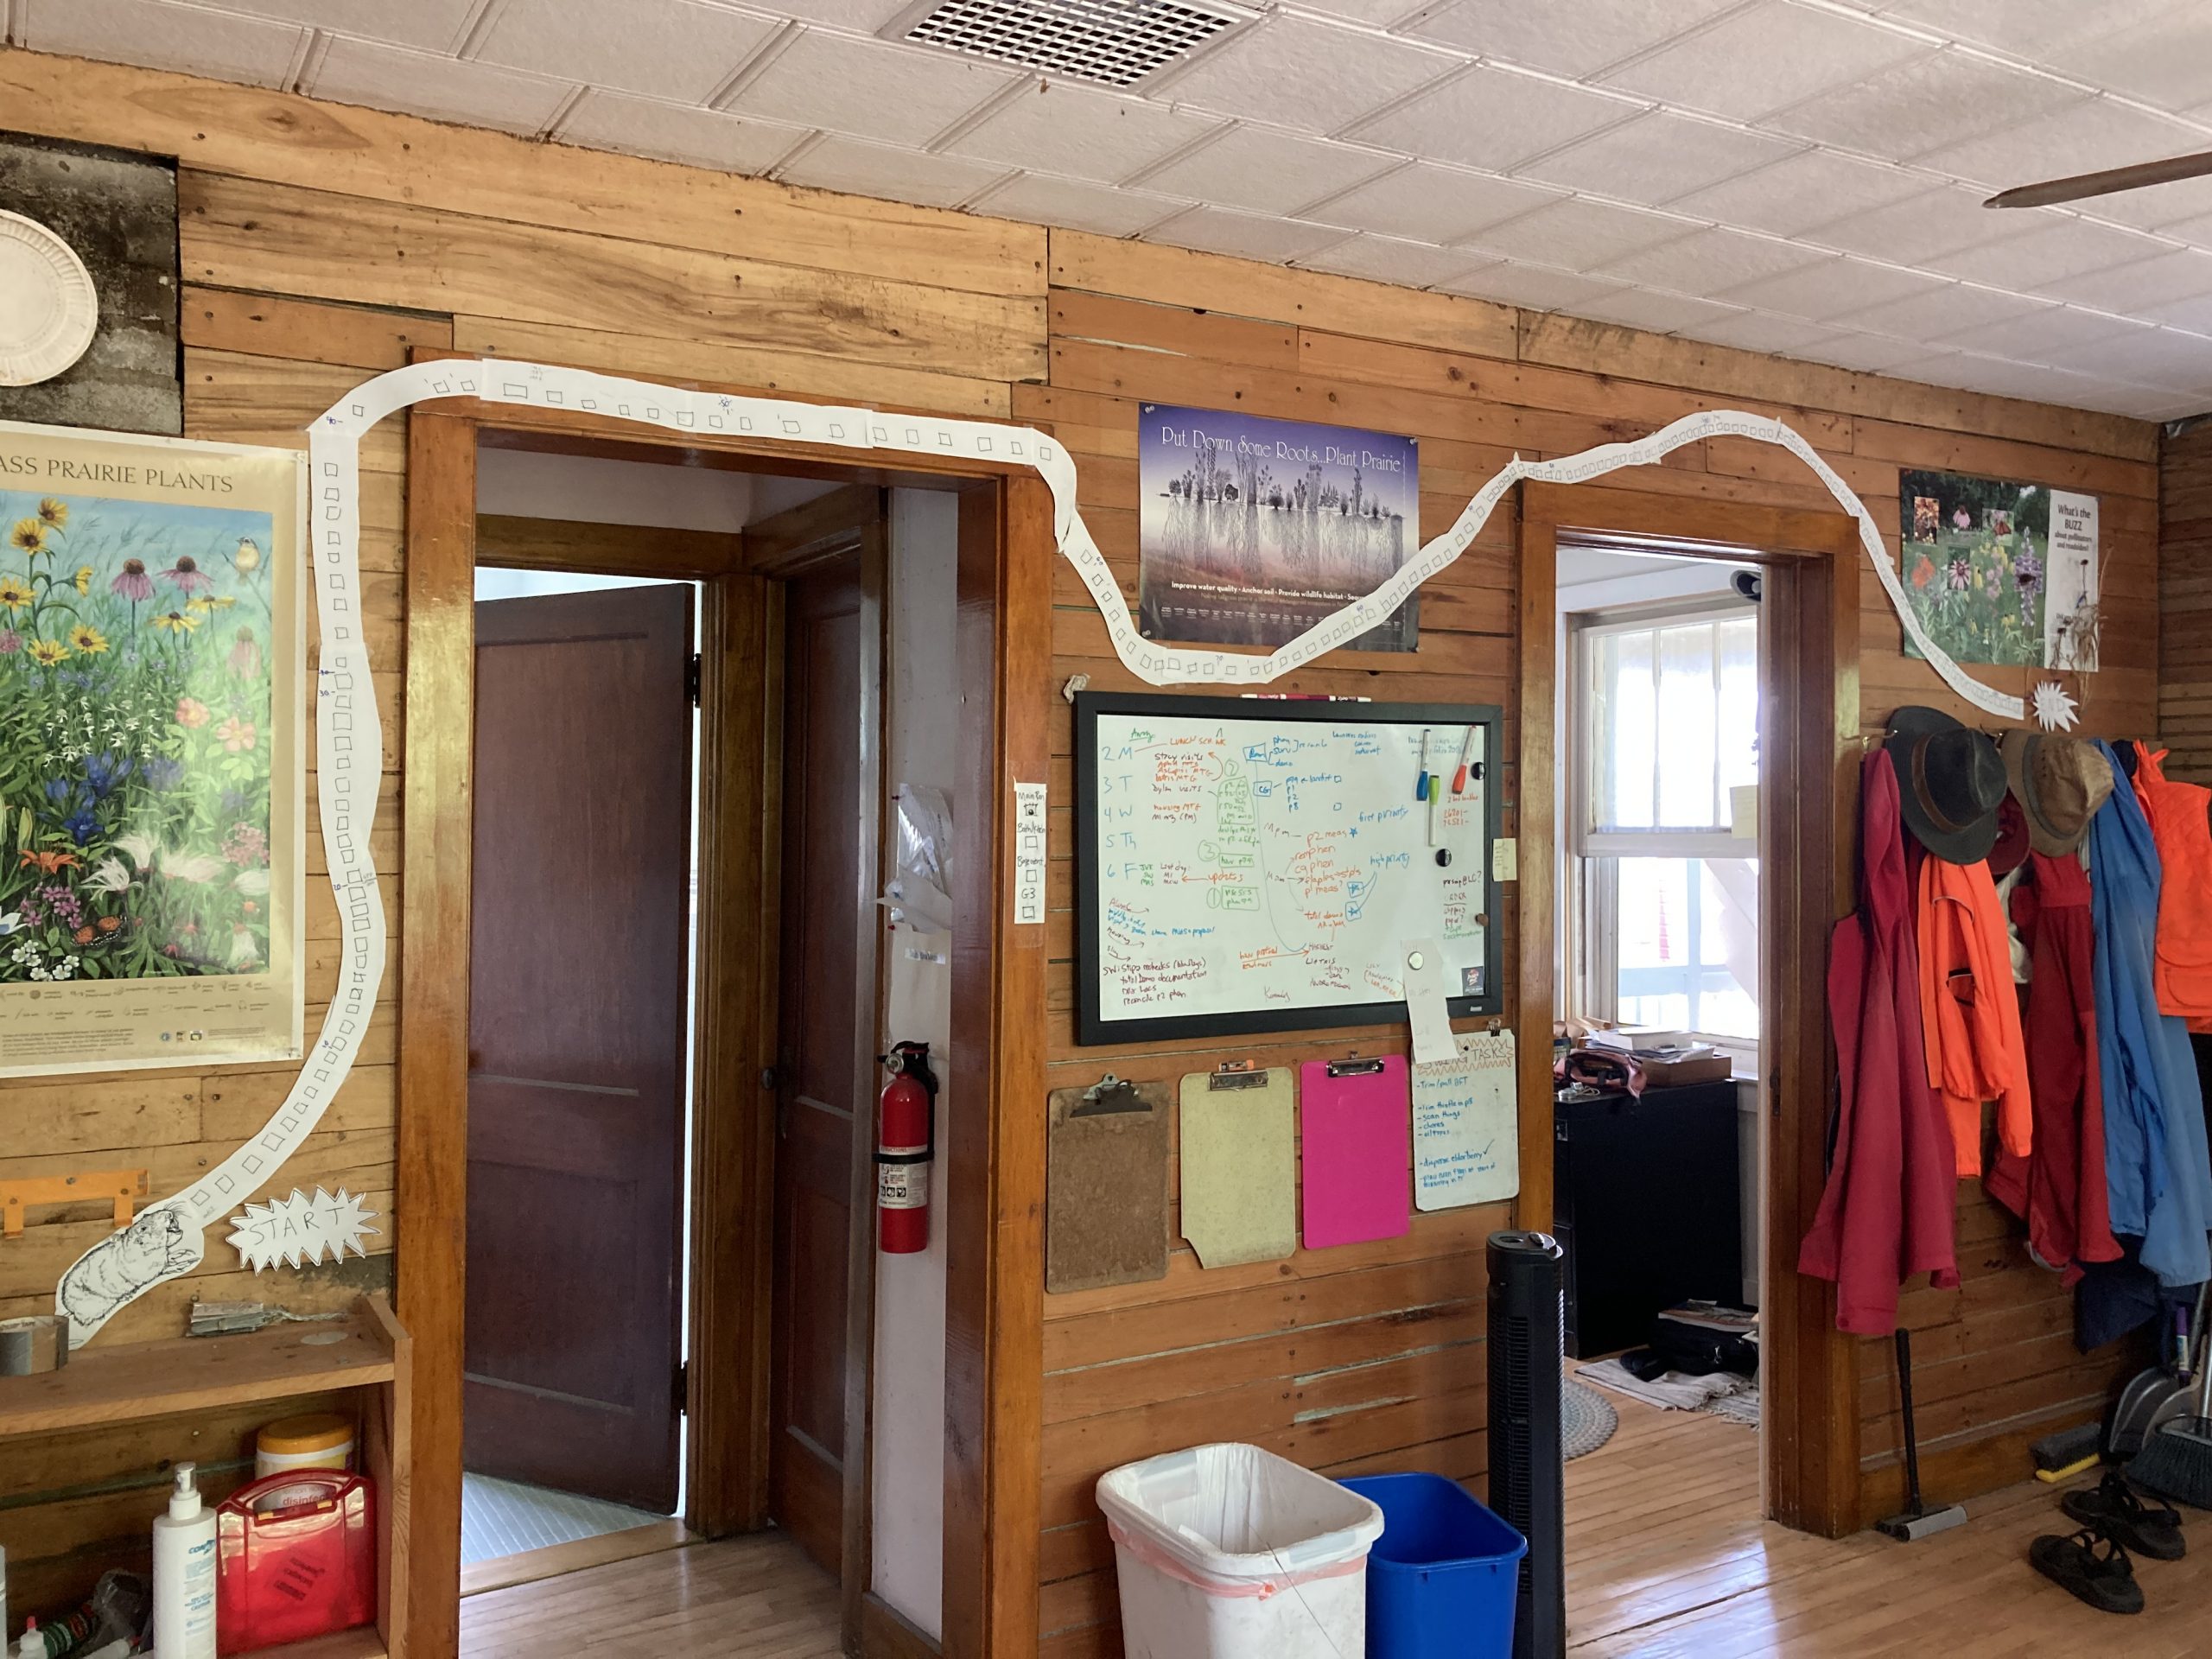
Team moral: Measuring experimental plot 1 is a large task for the team, it takes many days, usually hot days, with a project as large as this it is hard for the team to feel a sense of progress each day. So this year in hopes to keep the team more motivated I(Mia) took two strategies. First, we constructed a physical progress tracker, each square represented a segment in the plot A segment is a section of a row, rows are too big so we break them into sections for ease of measuring. After each day of measuring the team was able to count how many segments they completed and color in each square. The team had fun with their square decoration and got creative with it, there was various themes, fruits, names for peoples last days etc. I also made maps of the plot for each day of measuring that were color coded with what positions have been measured and which ones haven’t. Lastly, I do believe I may have bribed the team with cookies. Having multiple different forms of motivation, really kept the team motived and made the project less daunting. It was also added some excitement into measuring p1, a task that isn’t known for being too exciting.

one of the progress maps purple is done green is not done one of the progress maps purple is done green is not done 
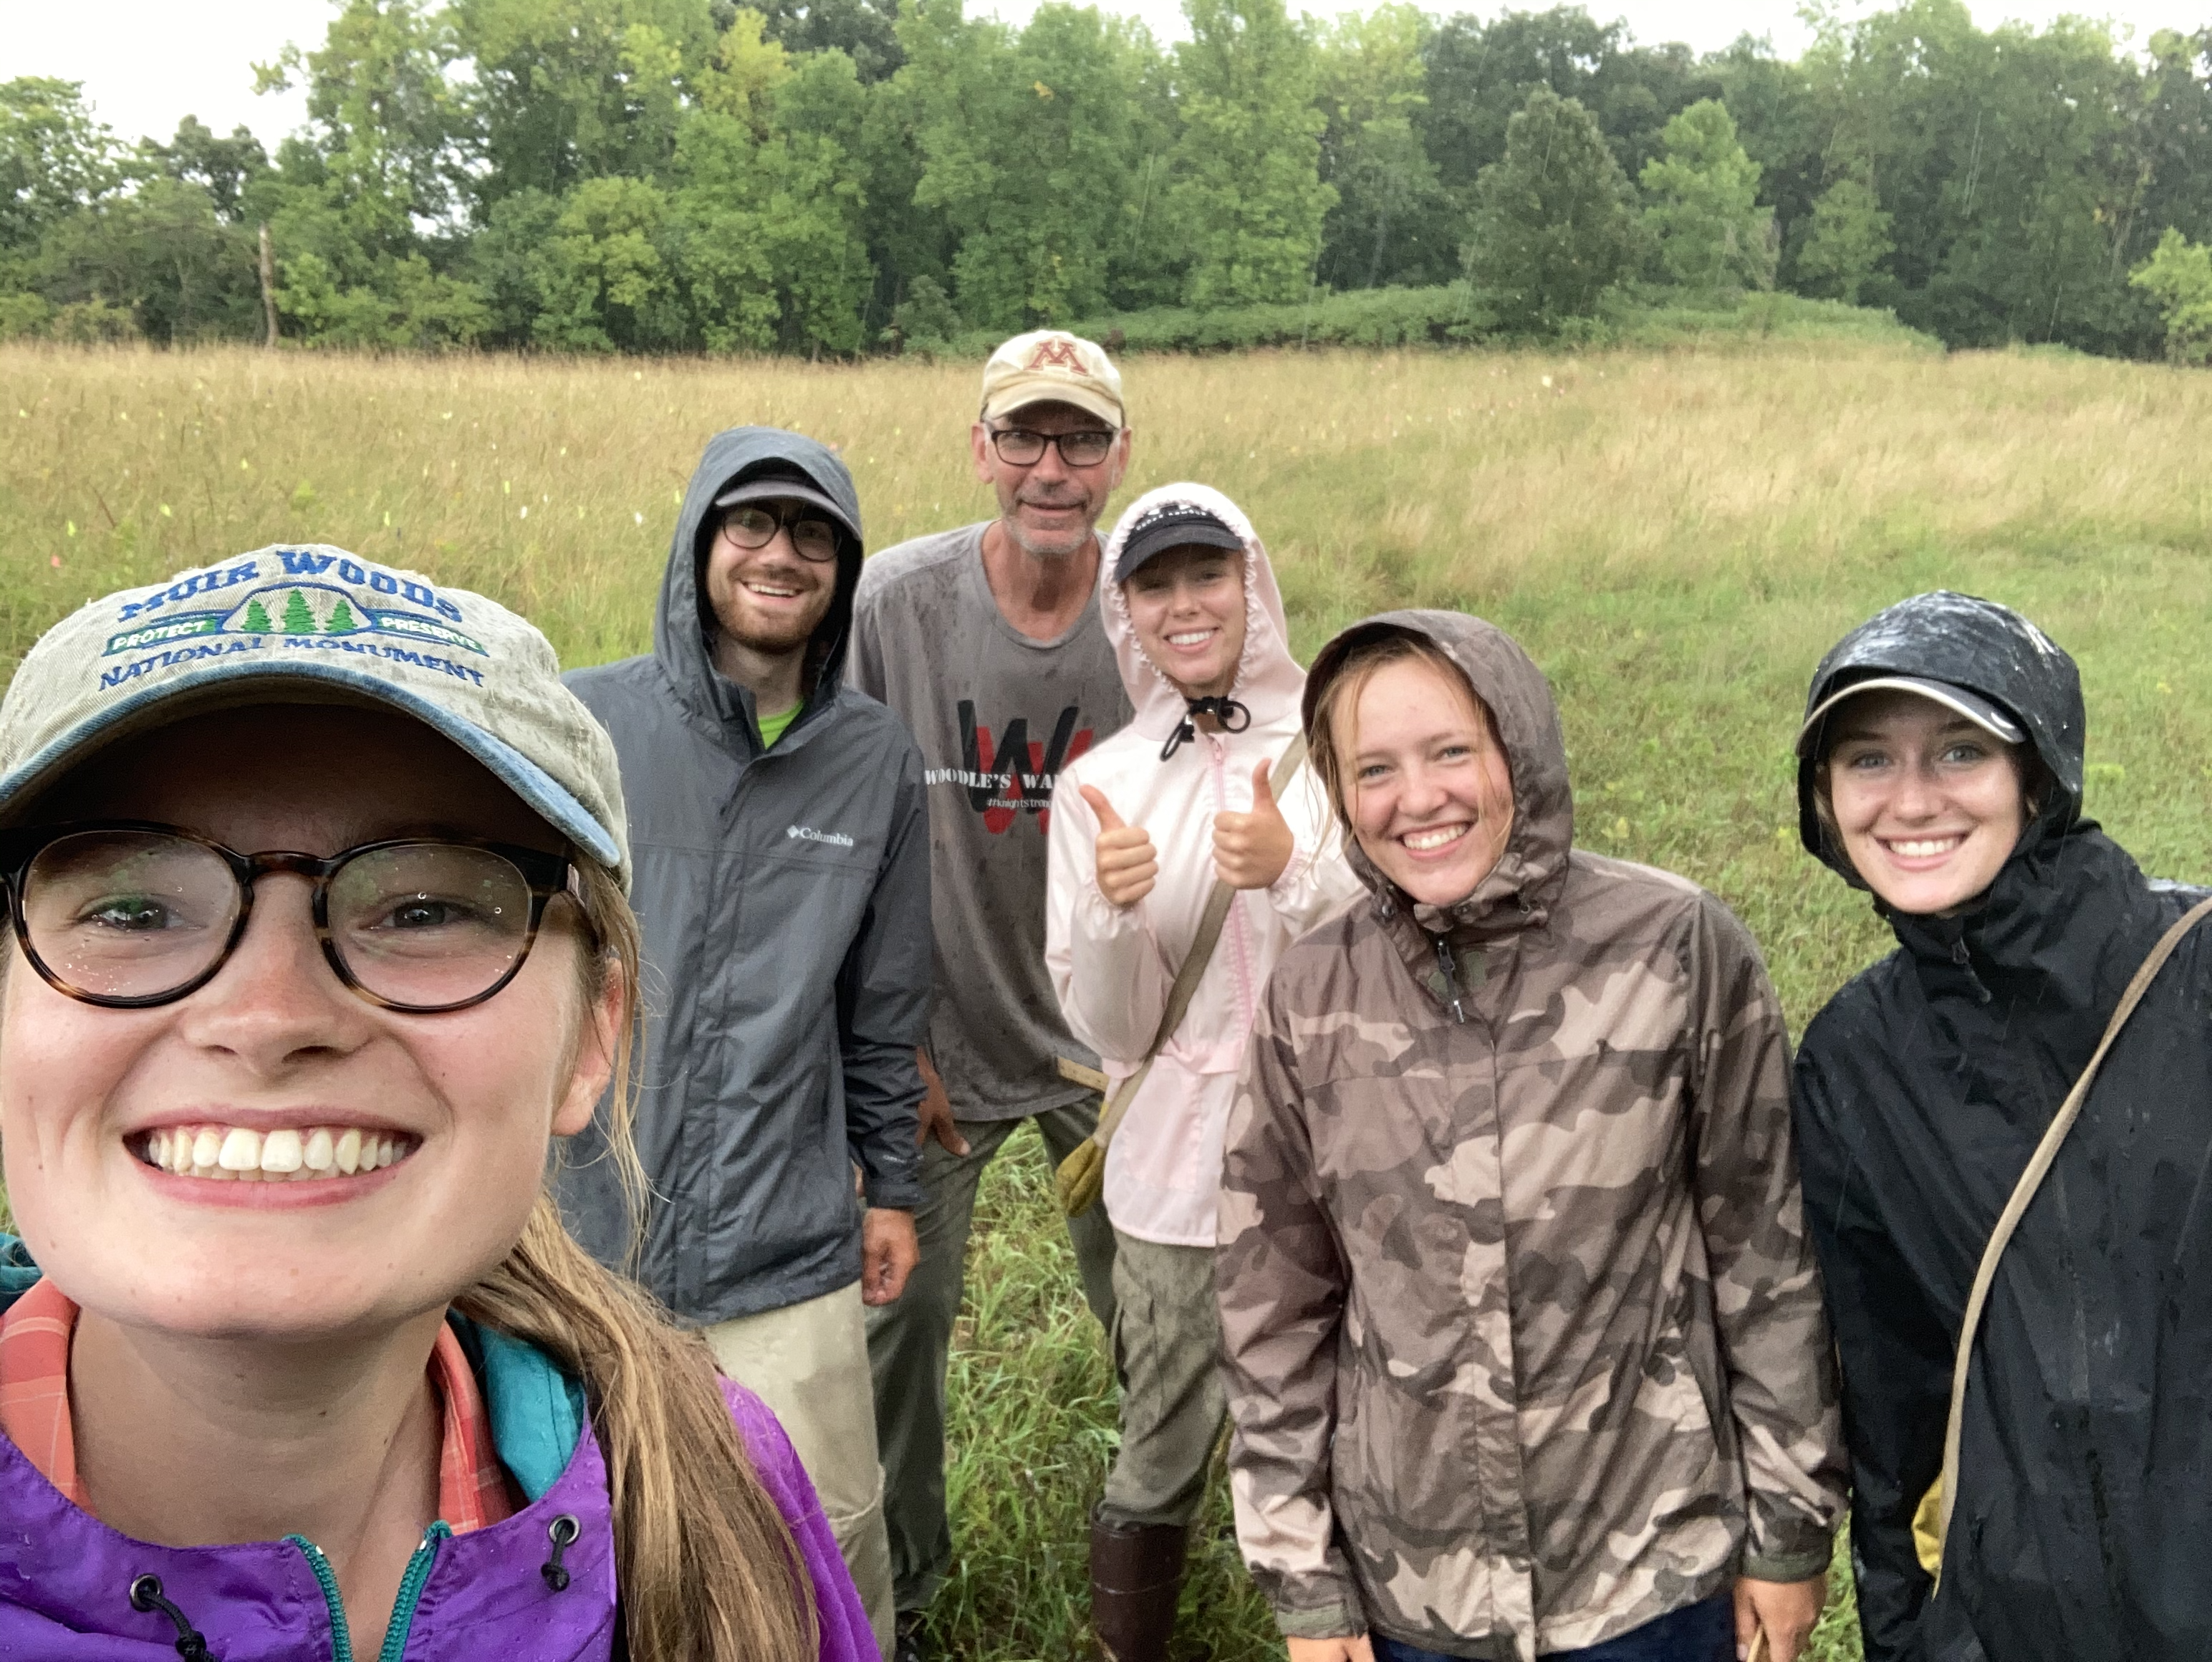
A hearty crew finishing measuring p1 during one of the only rainy days of the season 
Progress tracker aka Gopher tunnel of love
For more information on survival in common garden experiments, see this flog post about survival in common gardens.
Start year: Various, see individual listings above. First ever planting was 1996.
Location: Various, see above
Overlaps with: Pretty much everything we do.
Data/ materials collected: Measure data for all plots. All raw measure data available in cgData repository. Processed data should eventually be available in SQL database; ask GK for status of SQL database.
- new p79 stake file: Jared made a cleaned up stake file for p7 and p9 that can be found here
- p2 stake file/points shot: Amy shot points in p2 this year the points can be found in these 3 jobs
- “~Dropbox/geospatialDataBackup2021/convertedXML2021/P2_20210715_DARW.xml”
- “~Dropbox/geospatialDataBackup2021/convertedXML2021/P2_20210722_DARW.xml”
- “~Dropbox/geospatialDataBackup2021/convertedXML2021/P2_20210802_COLL.xml”
- exPt5 stake file: plants is here: “~Dropbox/geospatialDataBackup2021/stakeFiles2021/exPt05stakeFile2021.csv”
Products: Many publications and independent projects.
Leave a Reply