In the lab today we were talking about Fibonacci numbers. Somehow these numbers (1, 1, 2, 3, 5, 8, 13, 21, 34, …) relate to Echinacea flowerheads. The number of ray florets (aka “petals”) on ab Echinacea head are often Finbonacci numbers, like 13 & 21, but they are often not those numbers. This Wikipedia page describes the relationship between Fibonacci series and florets on flowerheads.
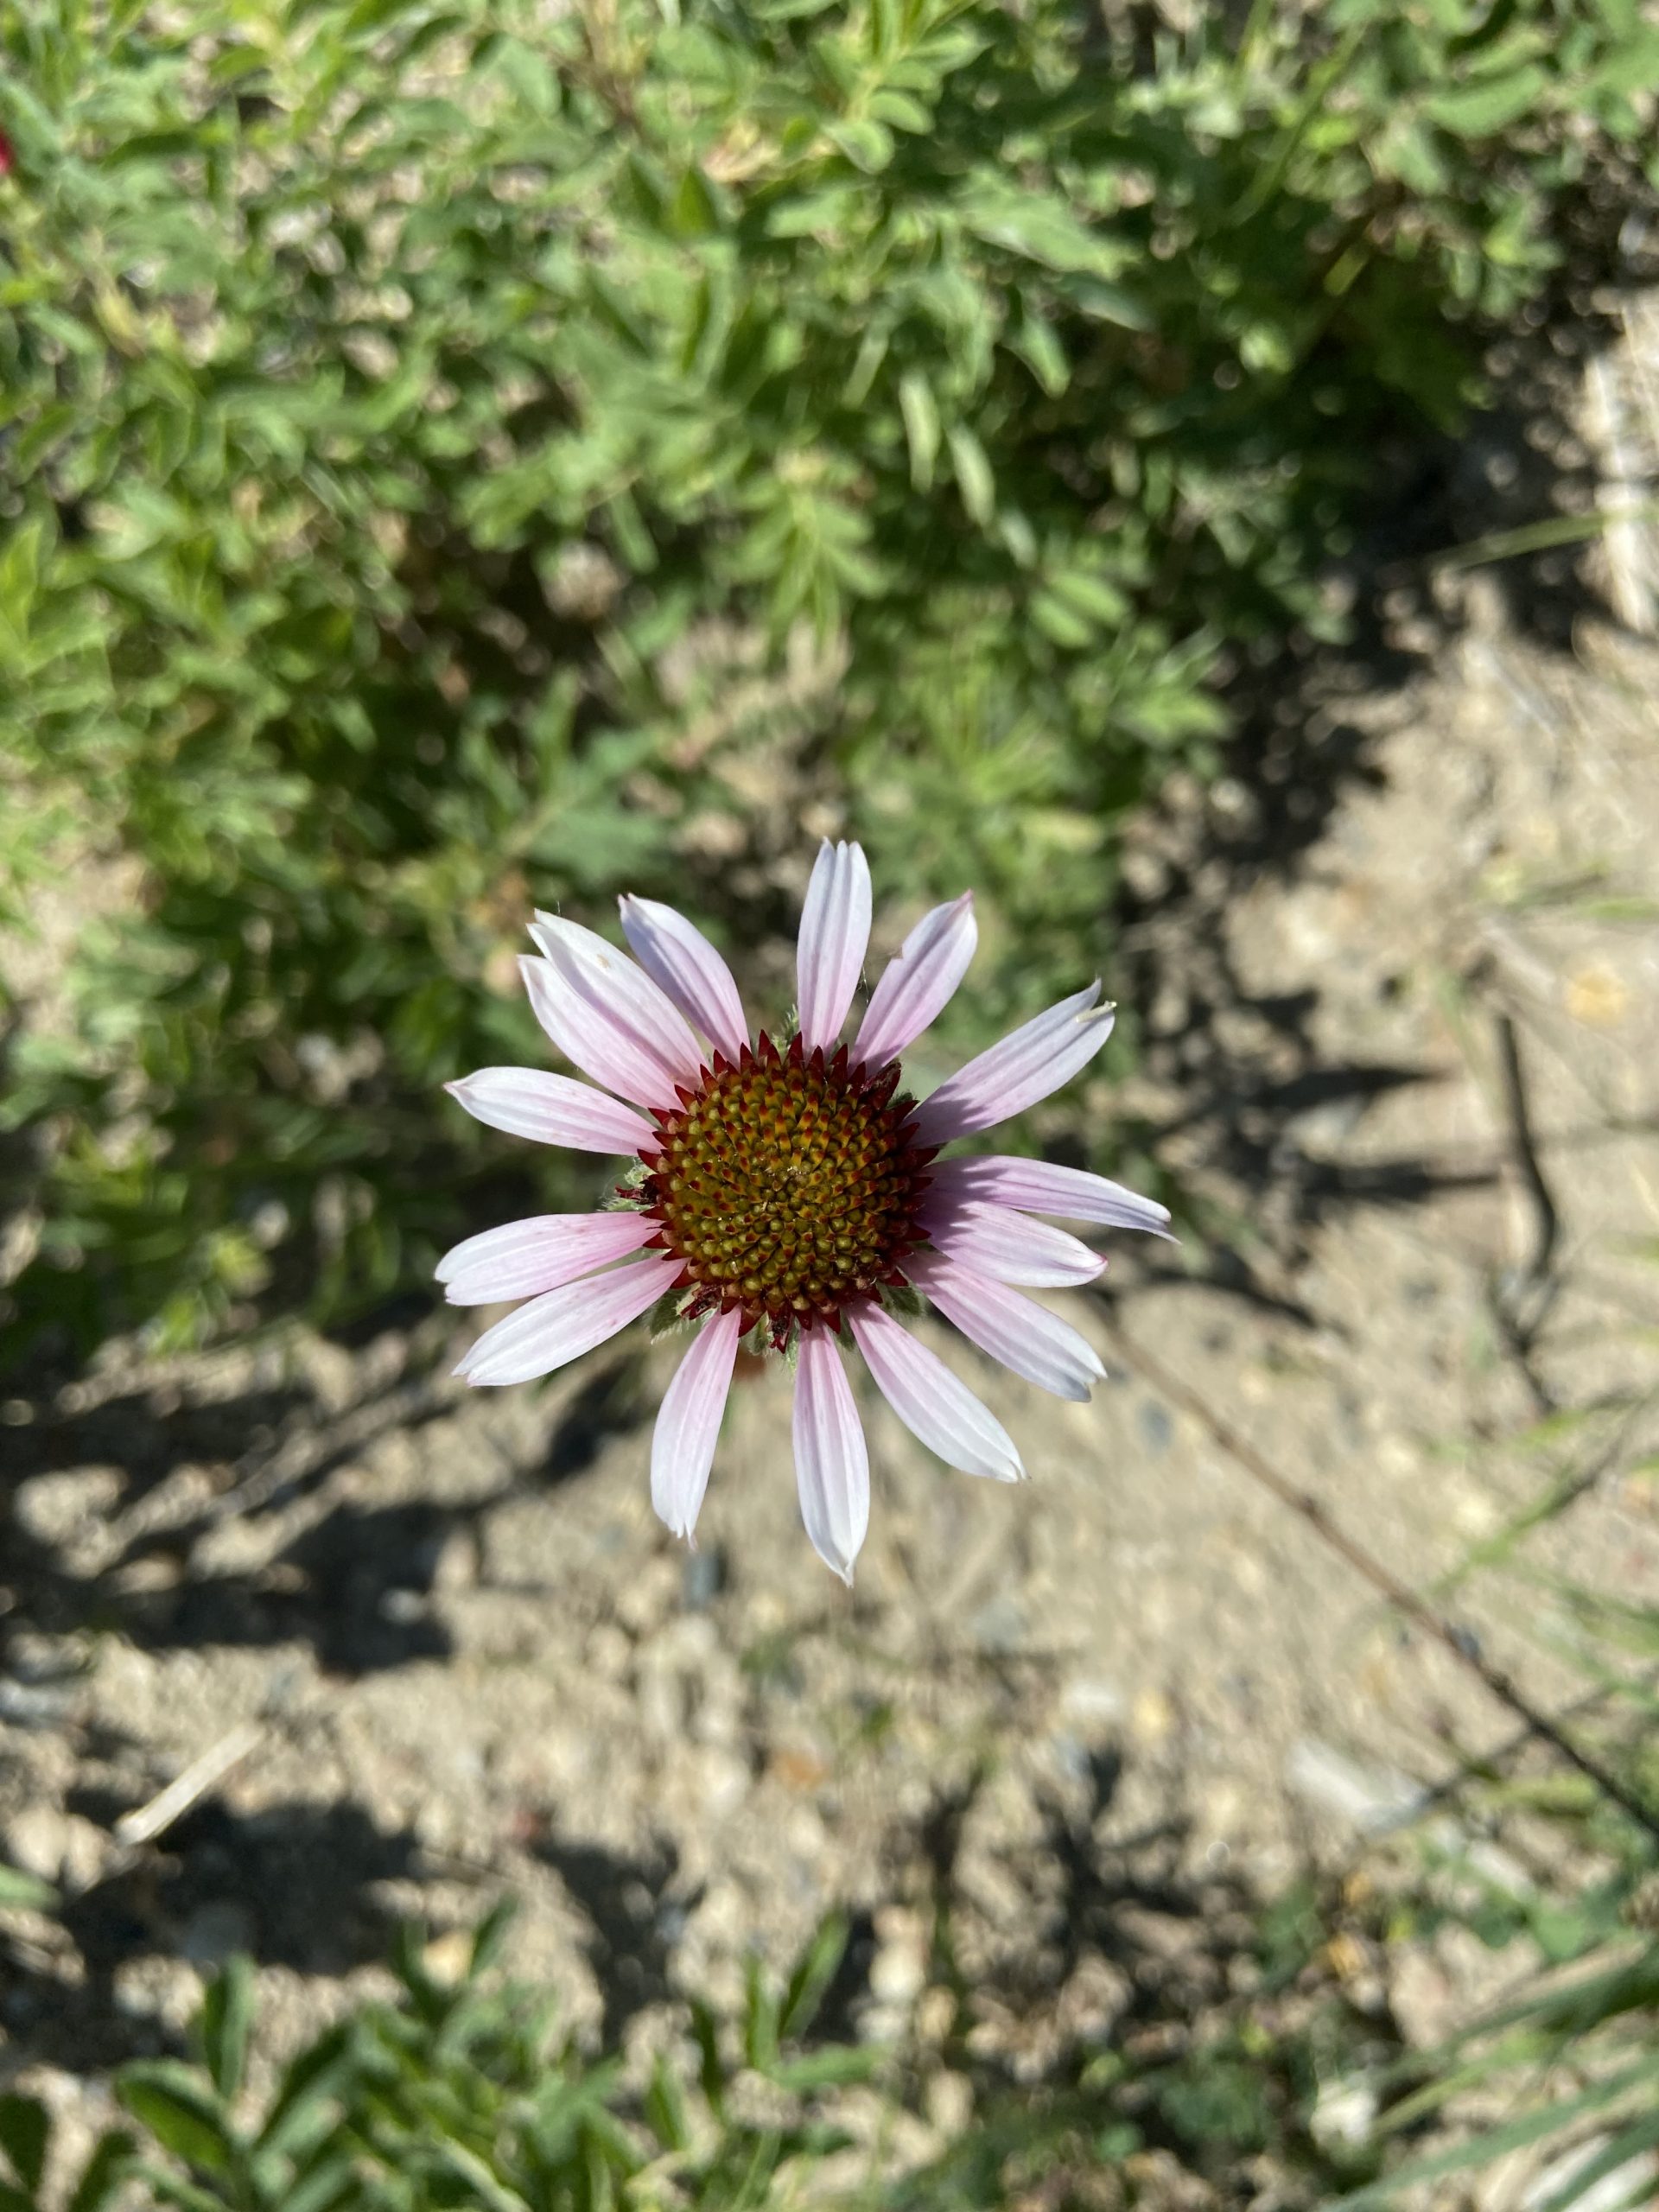
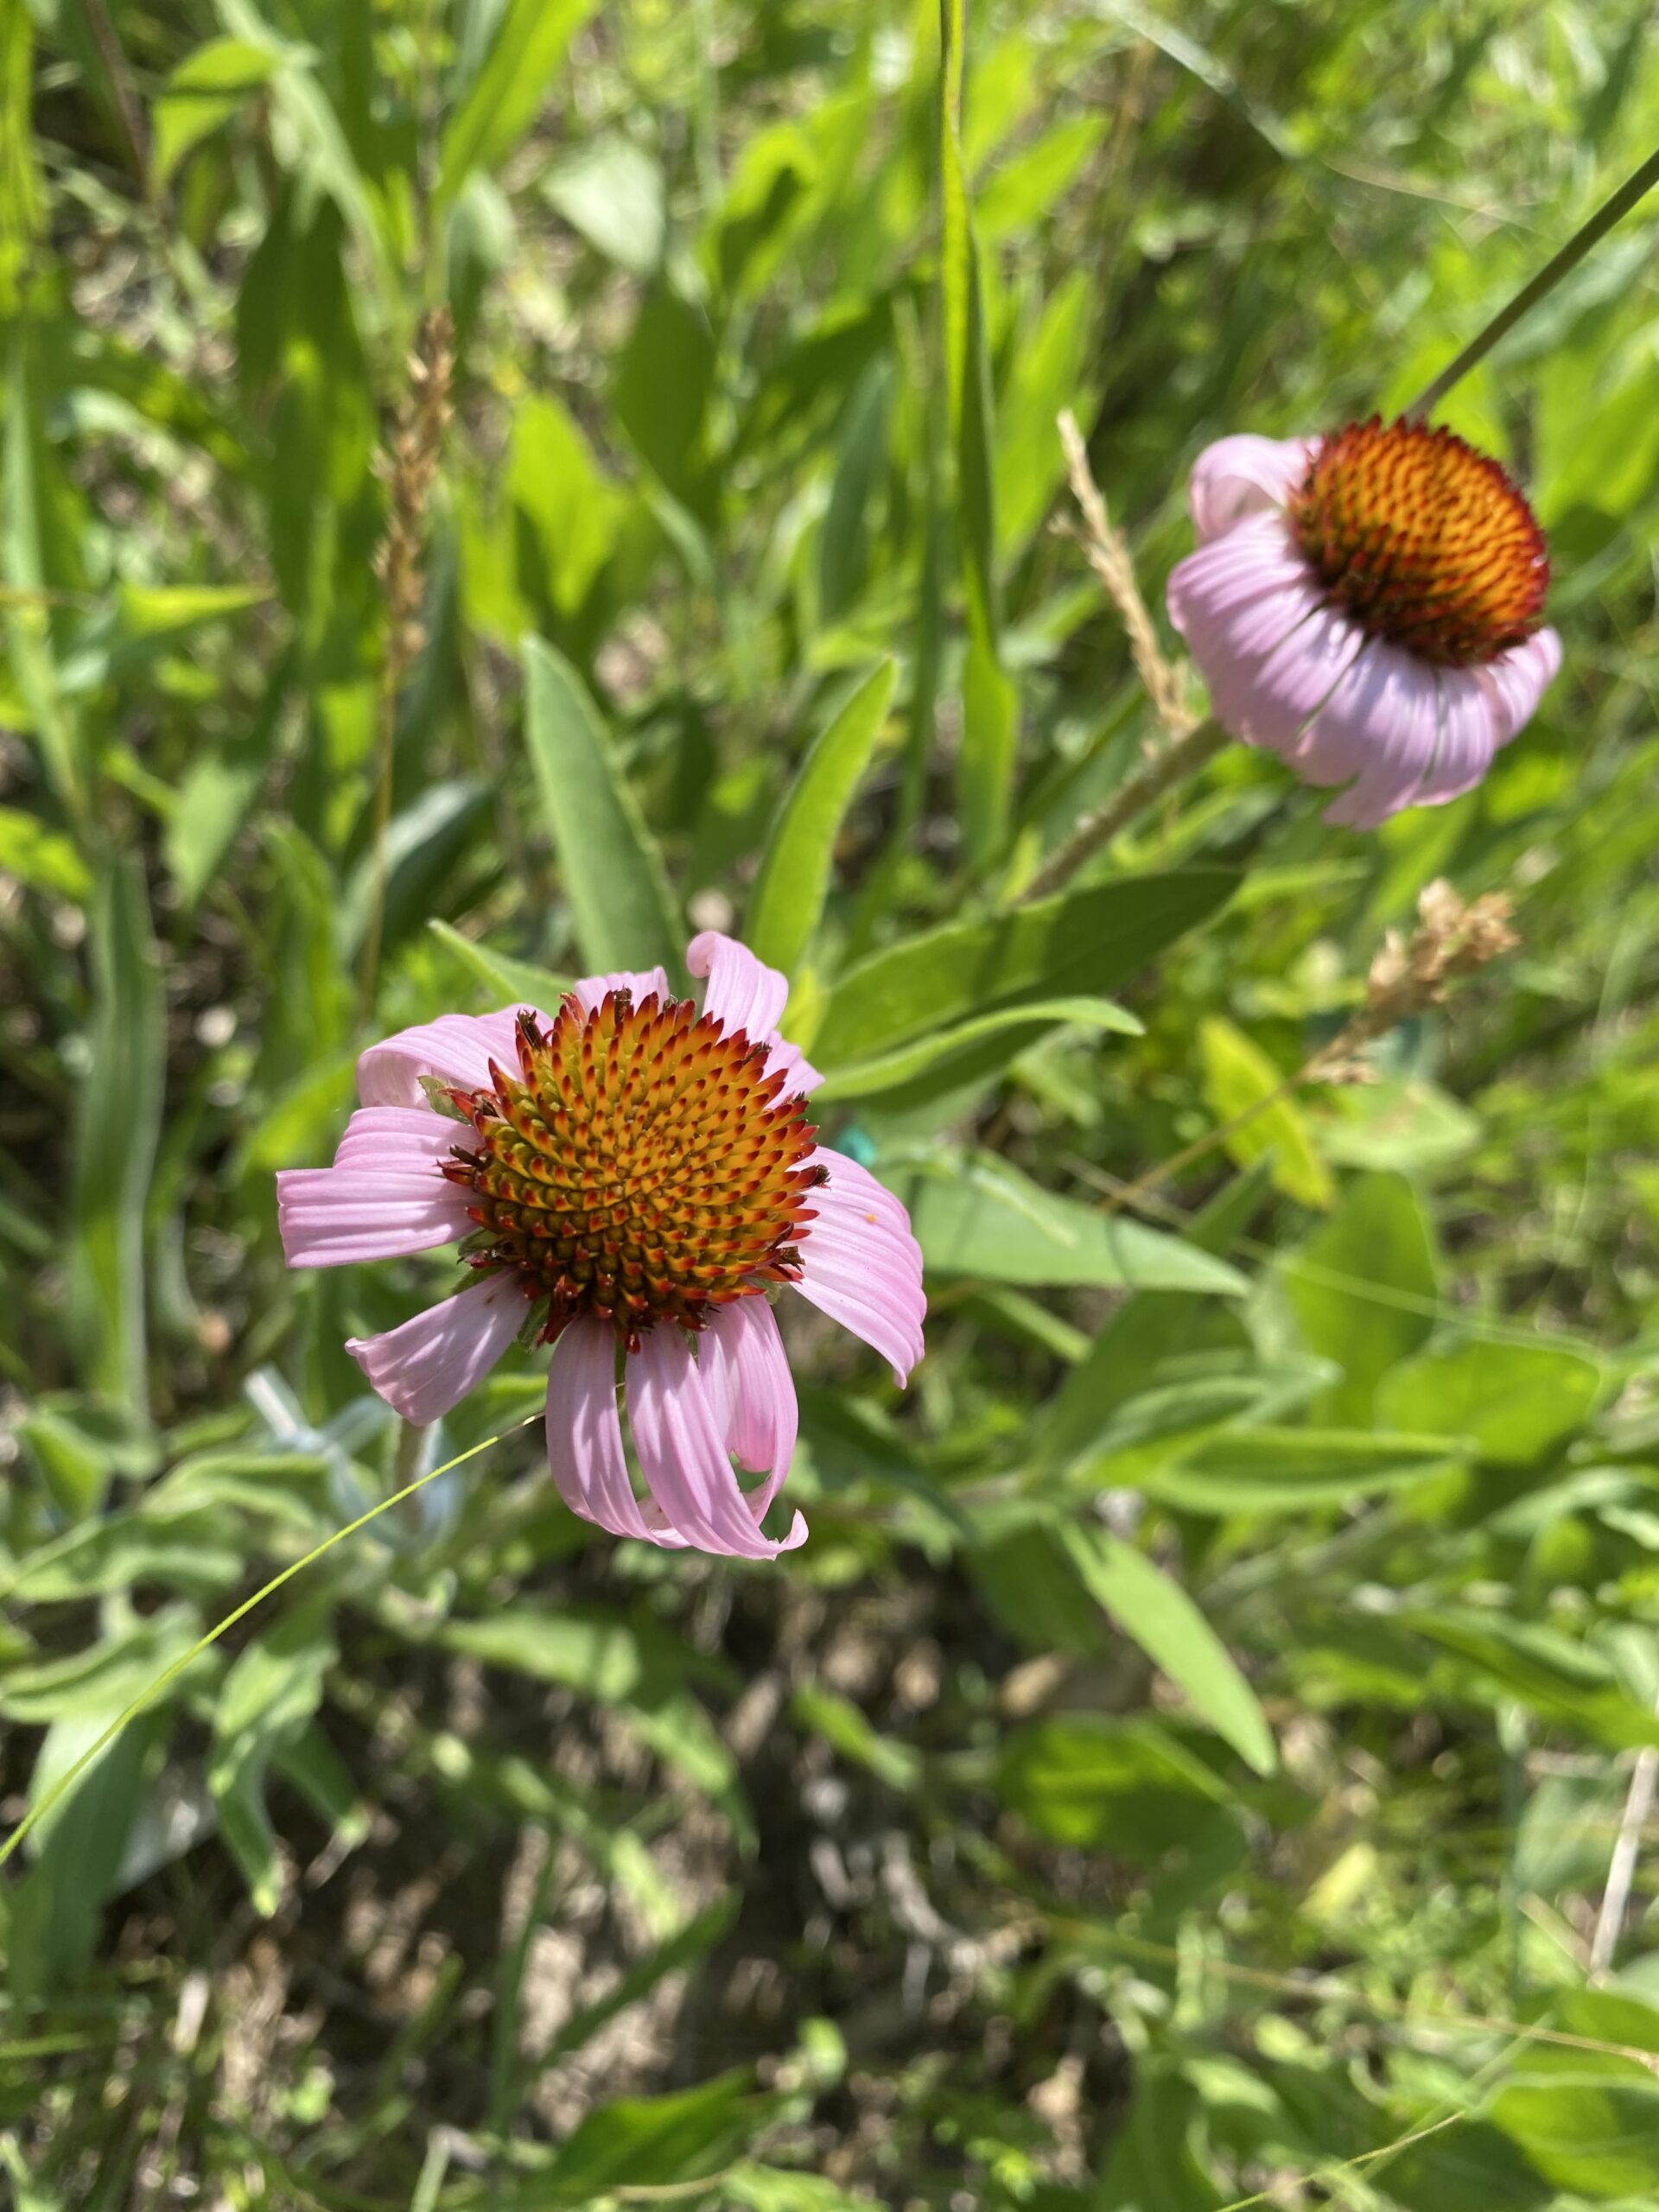
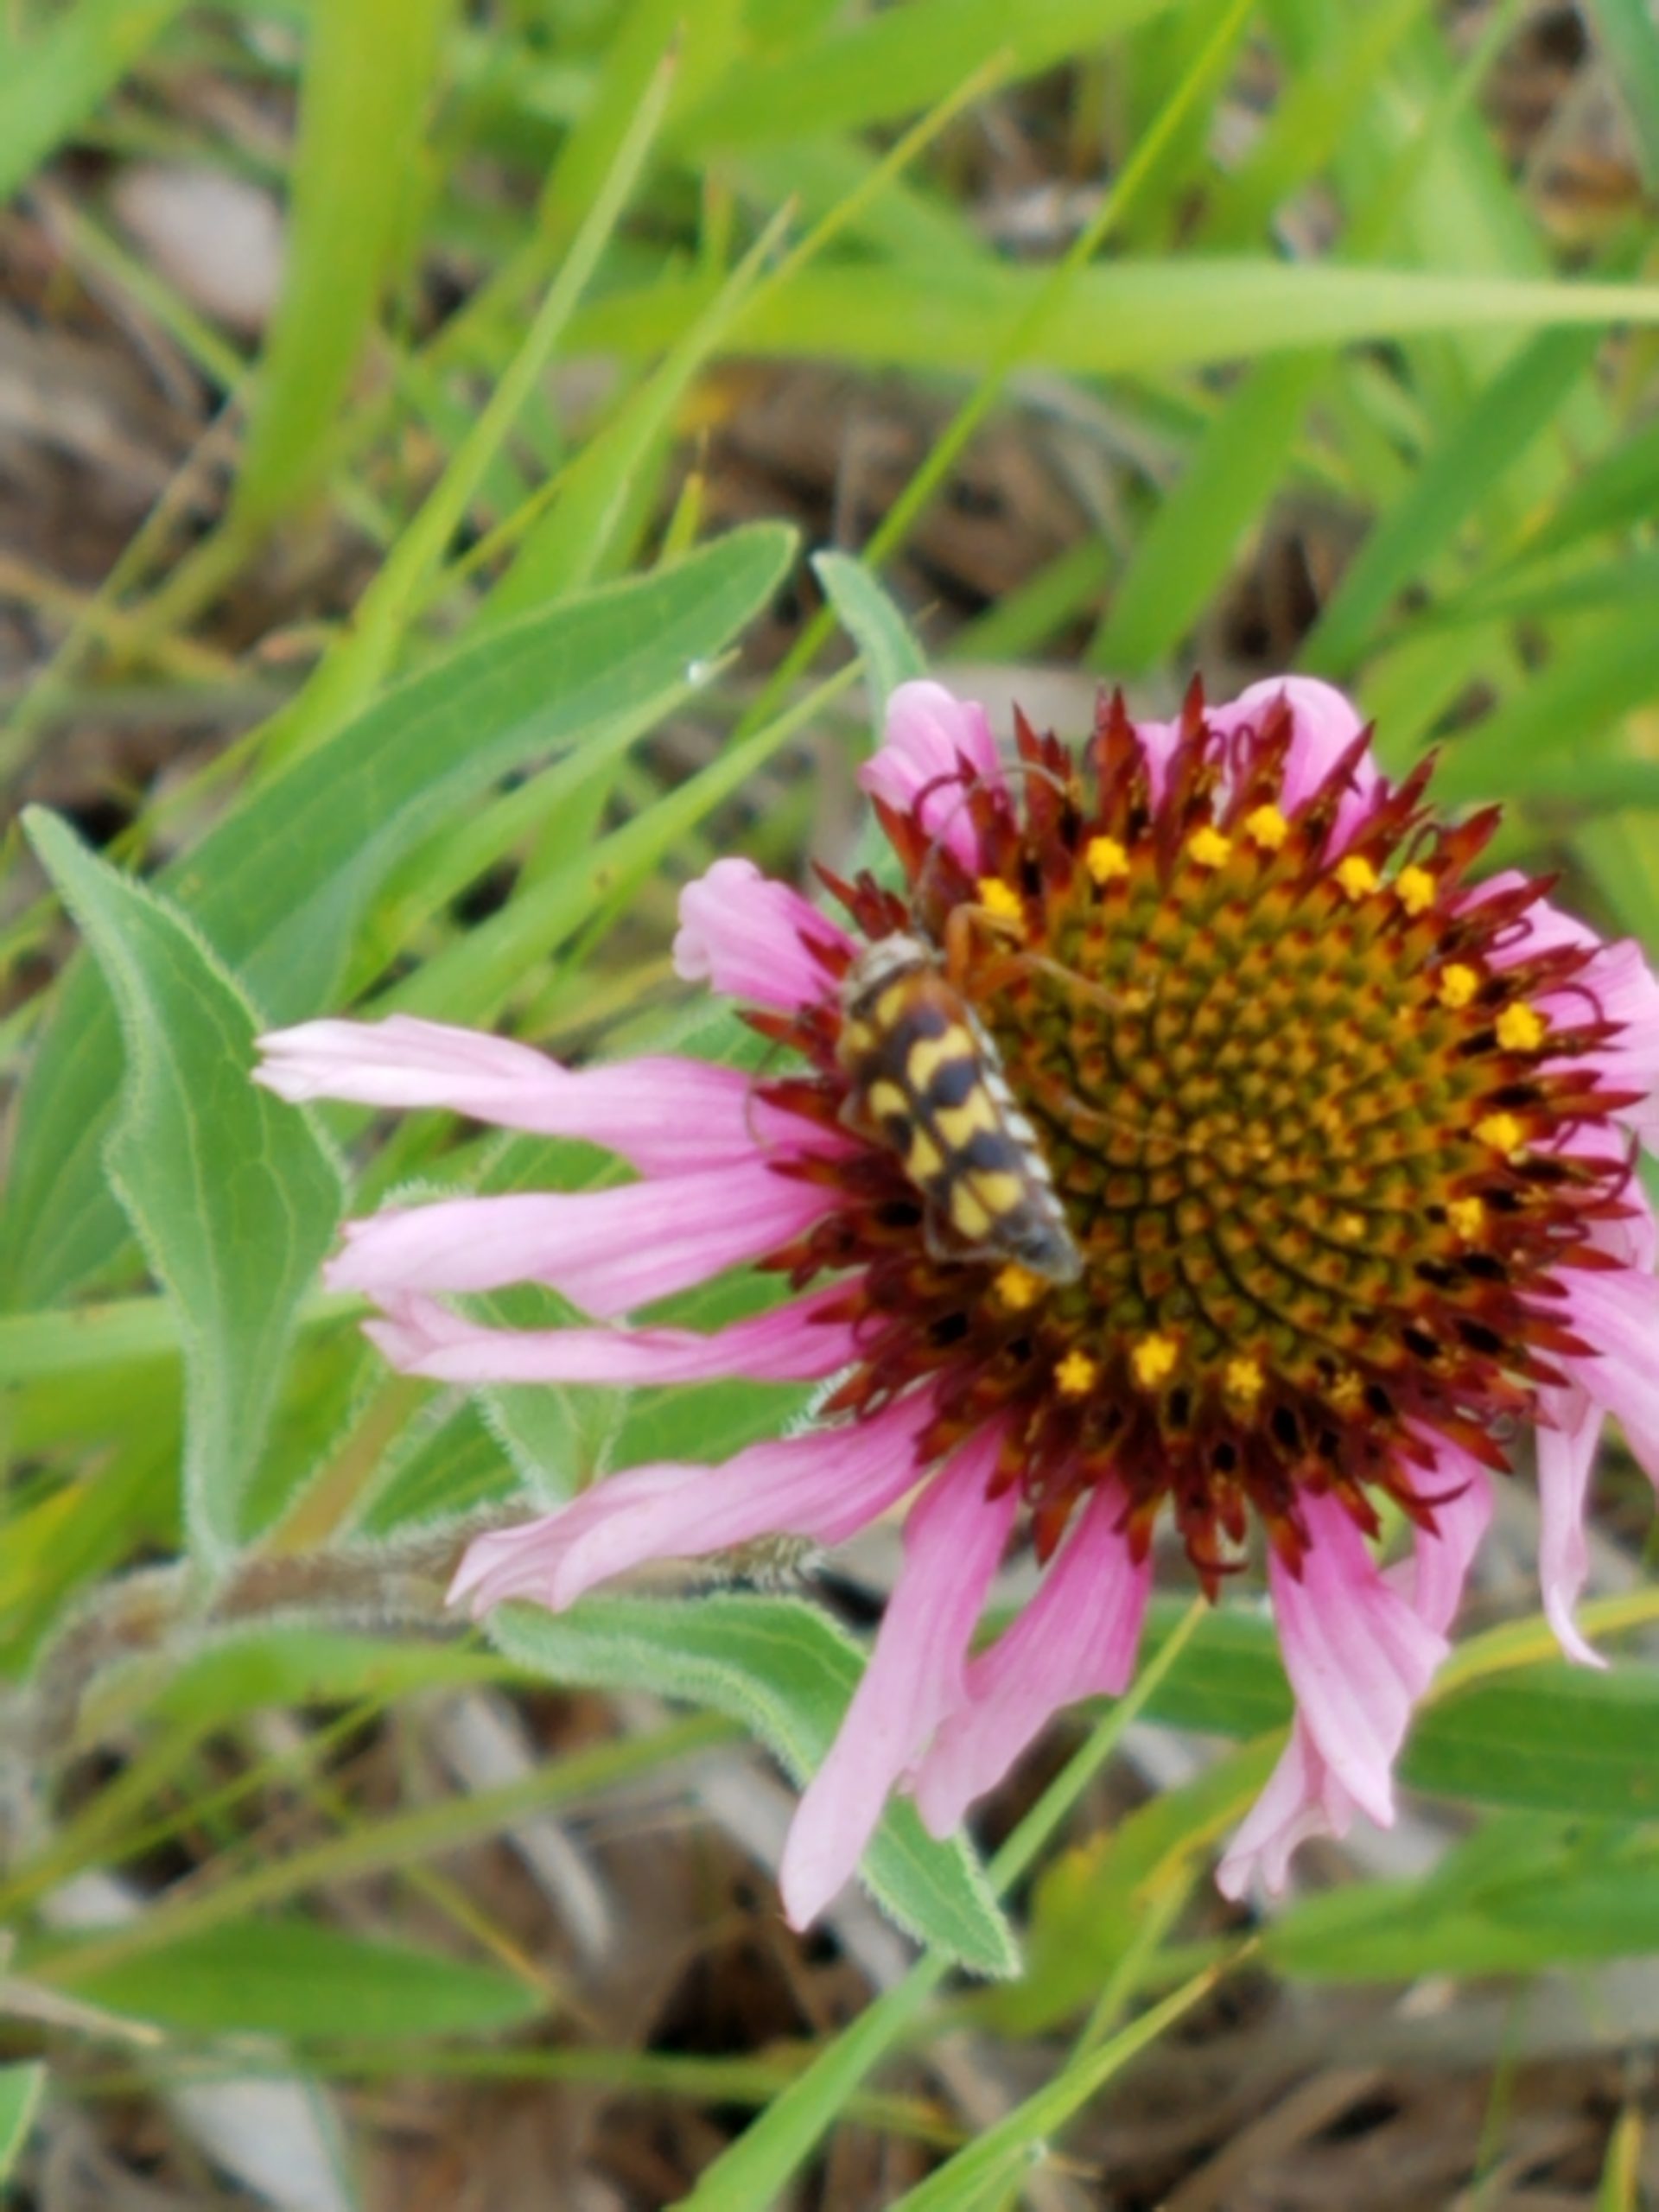
Here are some images of Echinacea heads from the summer (top views). Do you see any interesting patterns?
Top view of head of Echinacea angustifolia. How may ray florets? Click image to enlarge to see pattern of disk florets.Head of Echinacea angustifolia with two beesTwo heads of Echinacea pallida. This species is not native to Minnesota, but it was planted by accident in a prairie restoration in our study areabeetle on head of Echinacea angustifolia
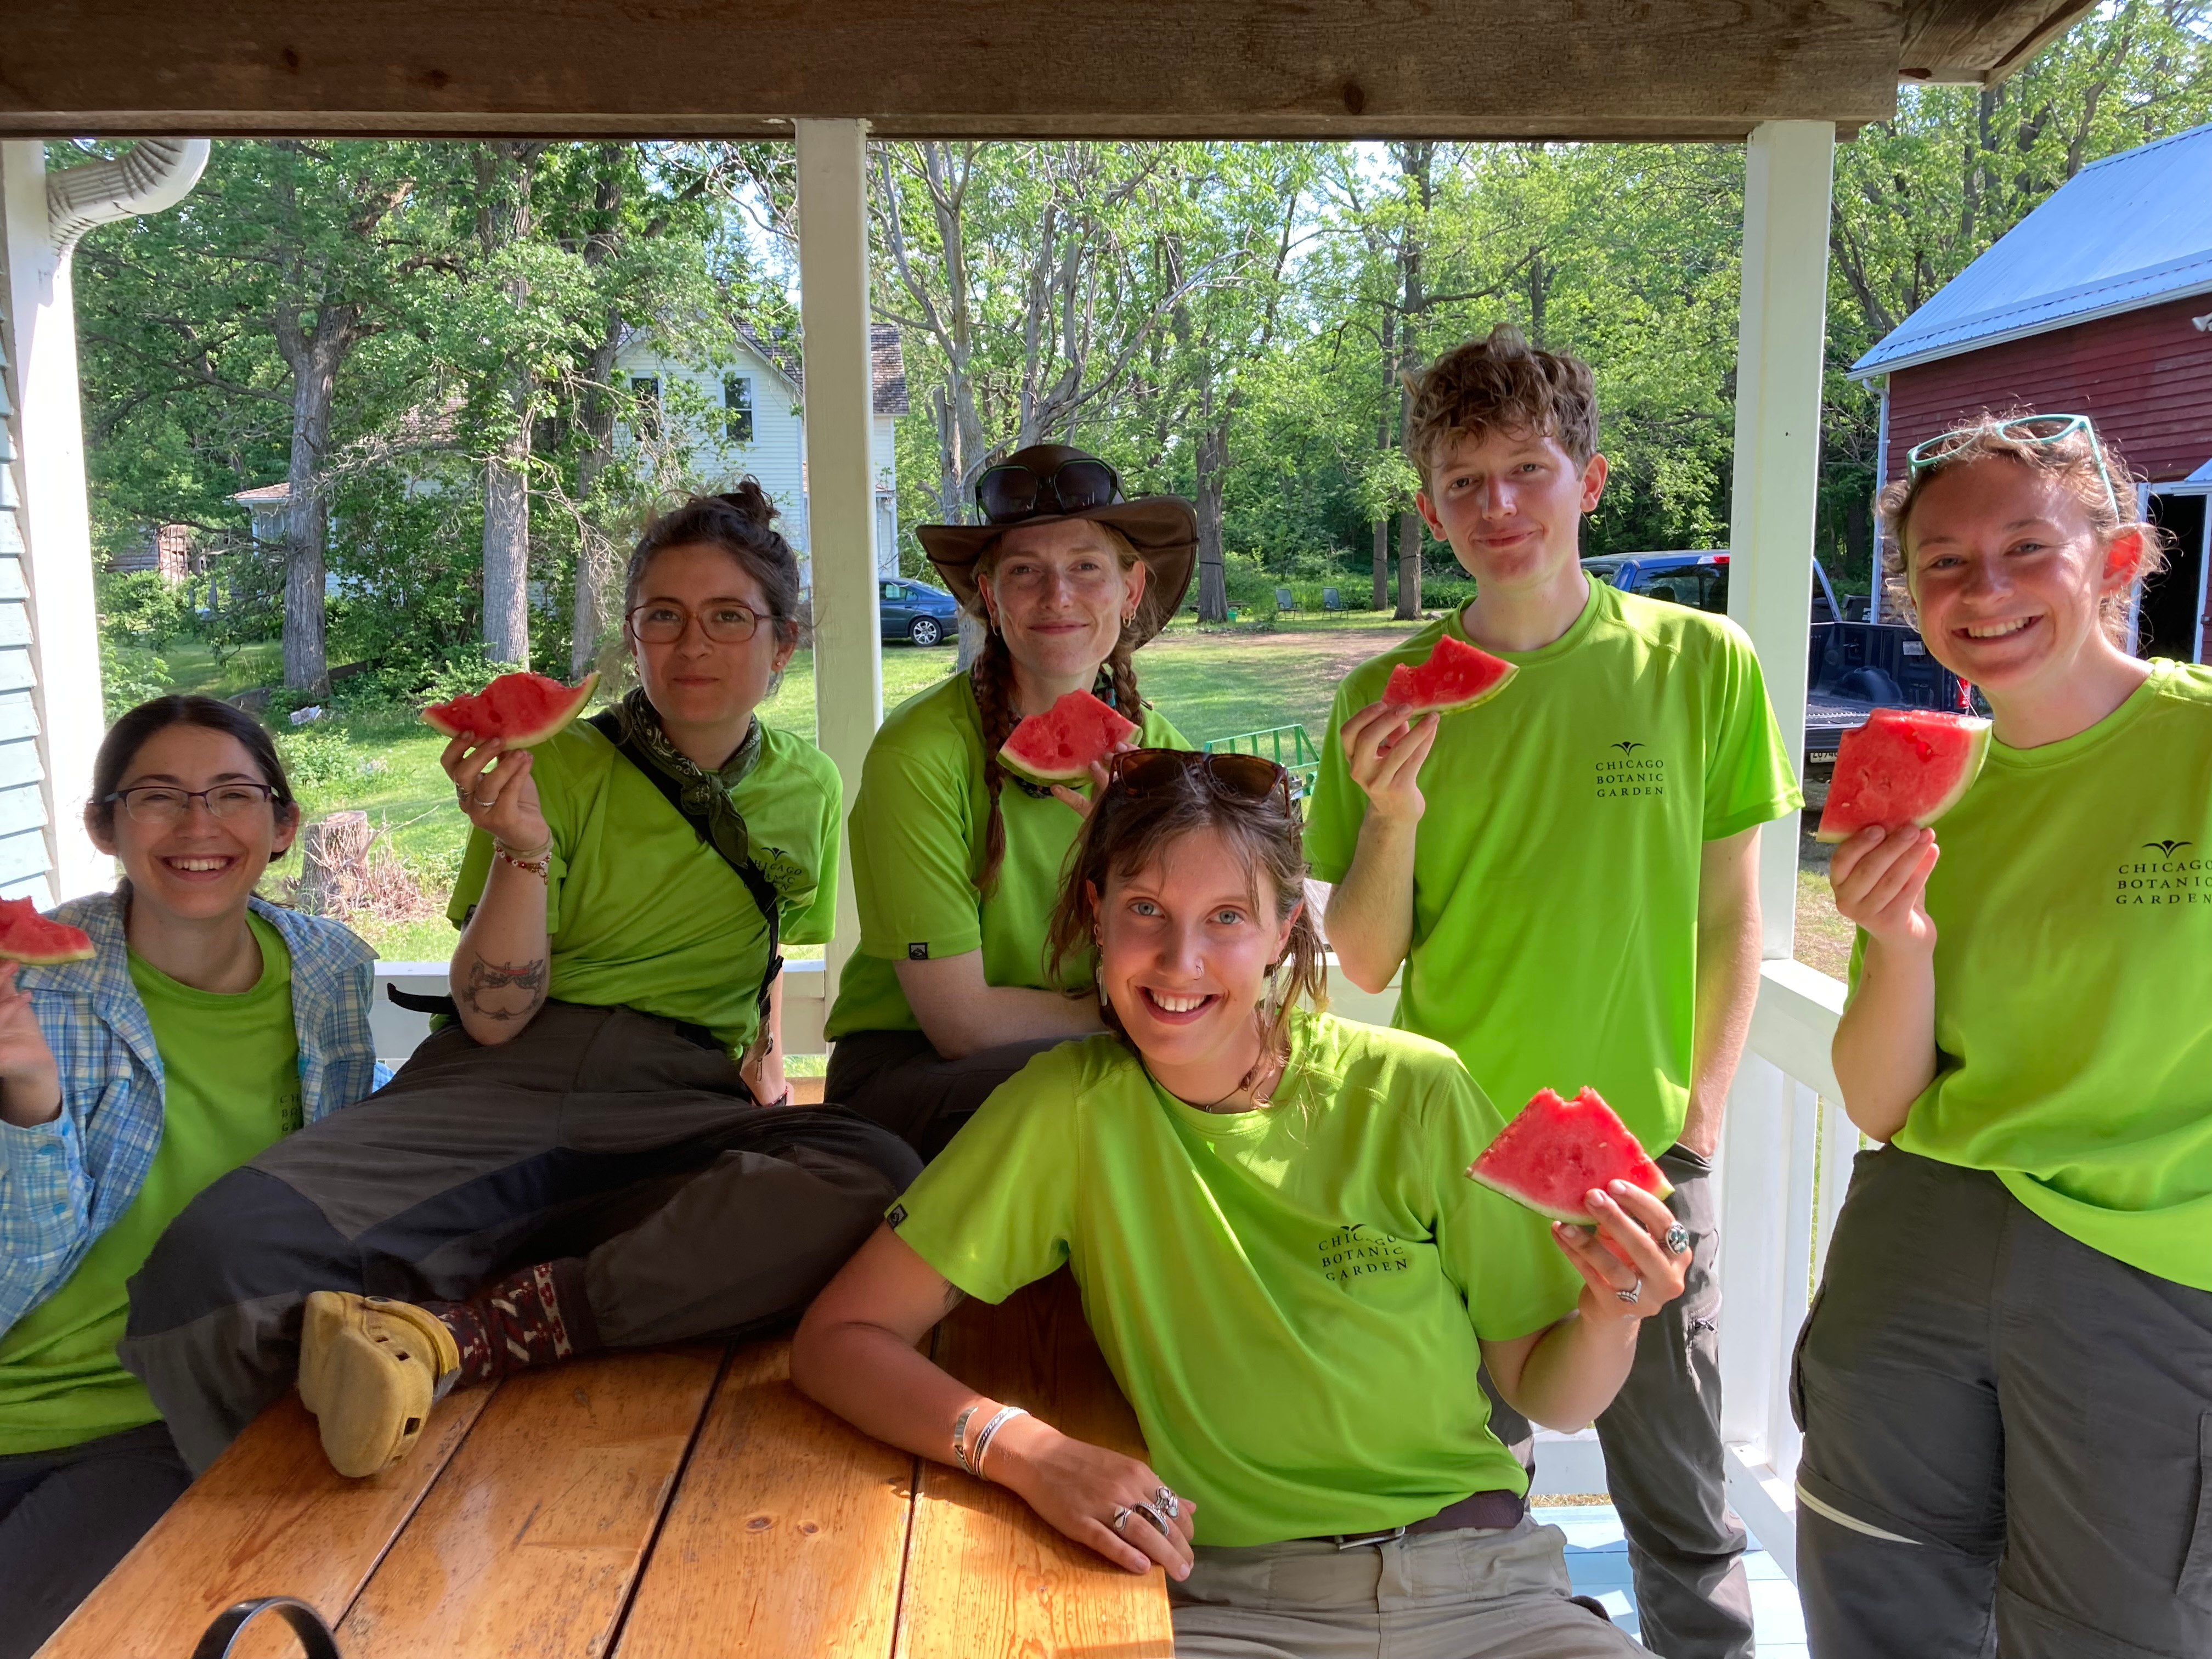
Team Echinacea seeks undergrads, graduate students, recent grads, high schoolers and teachers to join our summer team! Come hone your skills as an ecologist, conservationist, and evolutionary biologist while engaging in research in western Minnesota’s tallgrass prairies. There will be watermelon!
Members of Team Echinacea summer 2023 team enjoy a snack on the porch after a day of field work
We strive to create an inclusive, collaborative, stimulating, positive, fun, and productive environment for all regardless of race, ethnicity, gender, age, sexual orientation, and economic background. We welcome and encourage individuals from groups historically excluded from sciences and conservation. If you are interested in learning about and contributing to science and conservation, please join our team. We are committed to recruiting, training, and supporting individuals interested in science, education, and conservation from diverse backgrounds.
Registration is now open for MEEC! This conference, organized and directed entirely by students, highlights the work of undergraduate and graduate students in poster or oral format.
Many, many Team Echinacea members have presented their research at MEEC in the past (just search MEEC here on the flog). In fact, I presented a poster on aphids with Allie Radin in 2022! Will I be submitting an abstract this year? Only time will tell. But you should!
DETAILS
Location: Southern Illinois University Edwardsville
Abstracts due: 15 March, 2024
Conference begins: 6 April, 2024
Note: The total solar eclipse is on April 8th, not too far away from the conference…
Team Echinacea has a lot of ongoing projects. A lot! Some of them have been running for decades, and some are relatively new. Each project has a unique set of needs in terms of preparation, fieldwork, and post field management. We want to be efficient as each project progresses through the field season and we also want new team members to be able to pick up on the workflows.
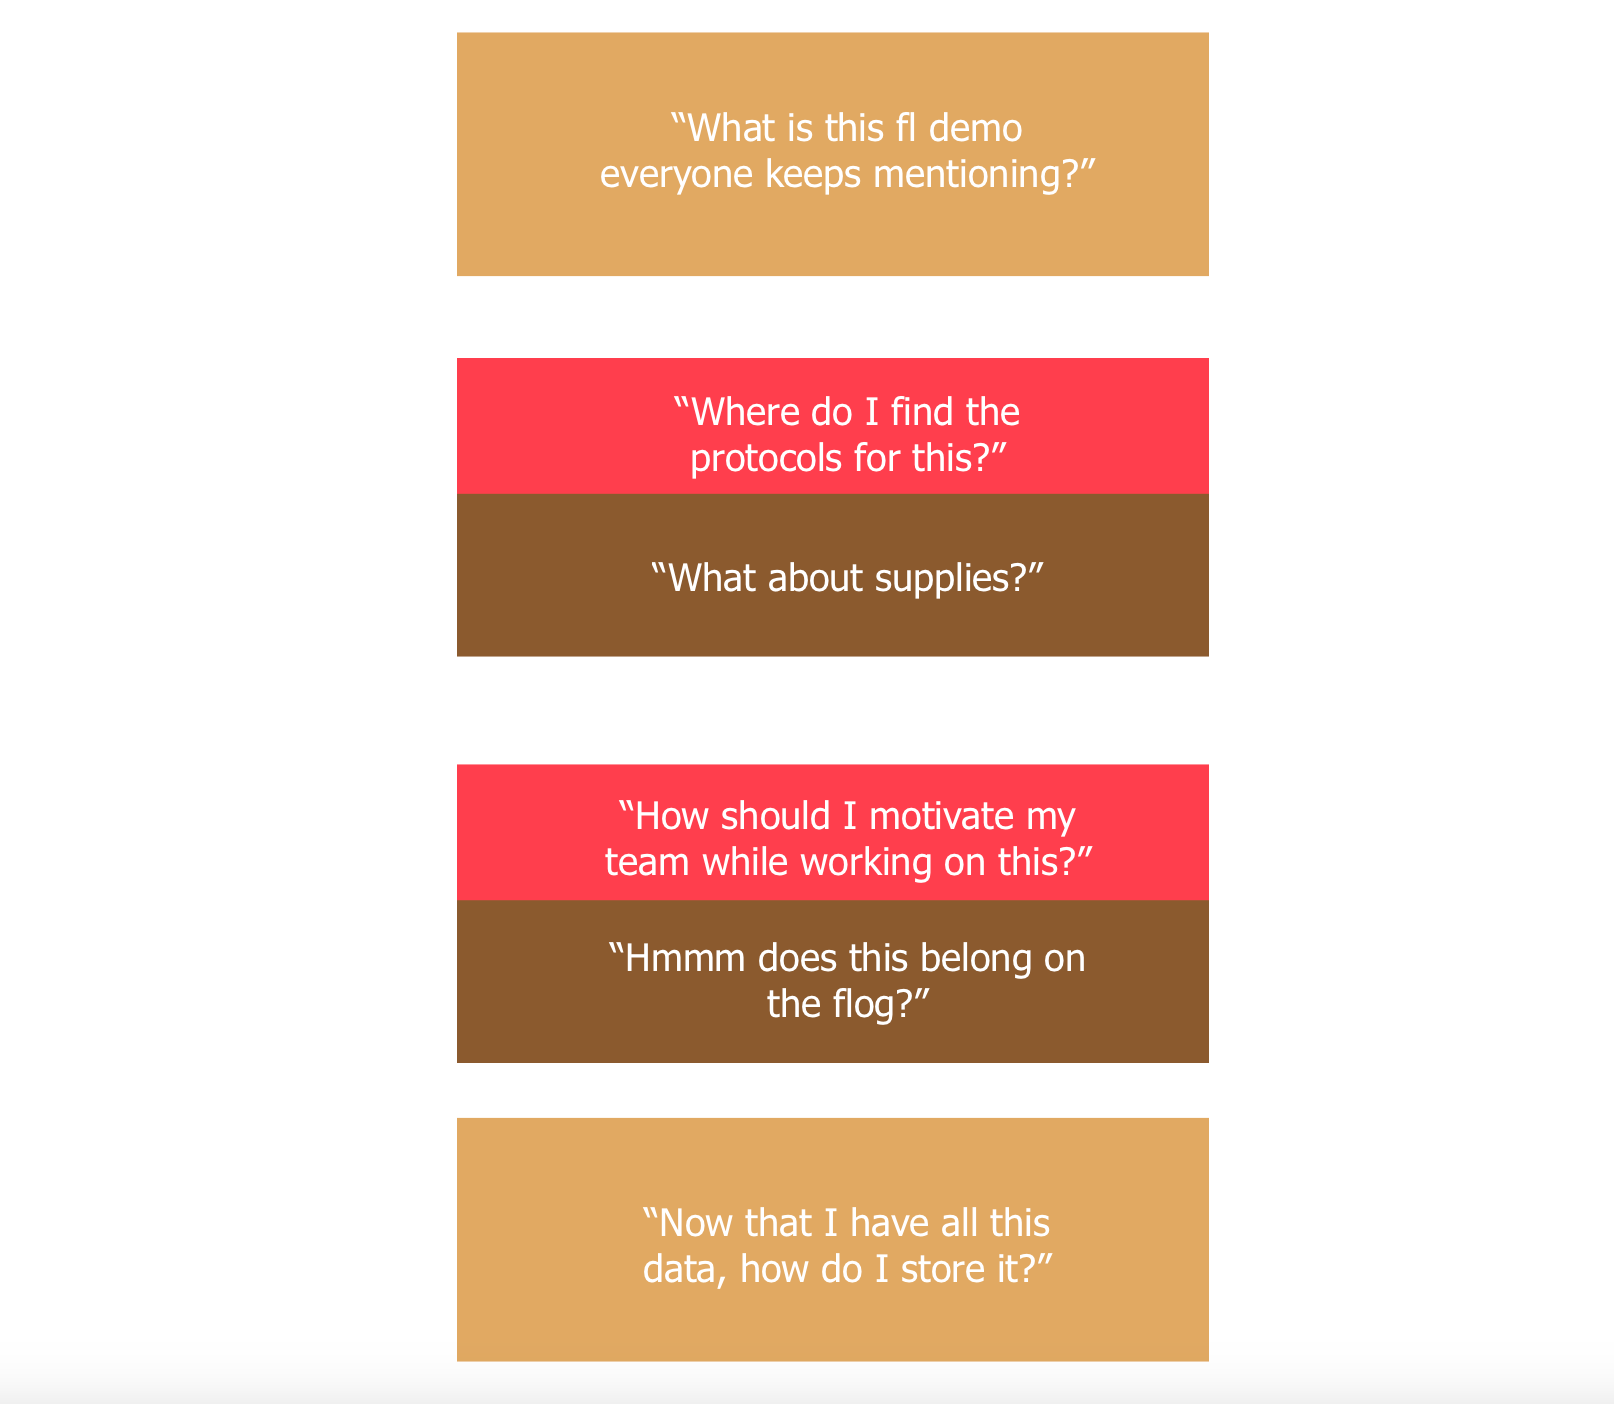
PB&Js might be just the thing to answer all our FAQs…
Here are some FAQs on an abstract ggplot PB&J.
This week, Stuart, Wyatt and I are experimenting with the PBJ format (project blueprint and journey). We hope to make easily digestible roadmaps for every project we have going on. These will keep our field season running smoothly (or not, if you like crunchy peanut butter… We have not discussed this yet). This also makes me wonder, what kind of jelly (or jam?!) is best for our PB&Js? I like Bonne Maman fig preserves. I will pitch that to Stuart and Wyatt.
You know, I can’t remember if I’ve posted any updates or info on my thesis to the flog before. So, I’ll do a more in depth update at some point in the near future explaining the background of the project, what work has gone on, etc. For now, I just want to make more of a celebratory post for making my first ever semi-complex function in R!
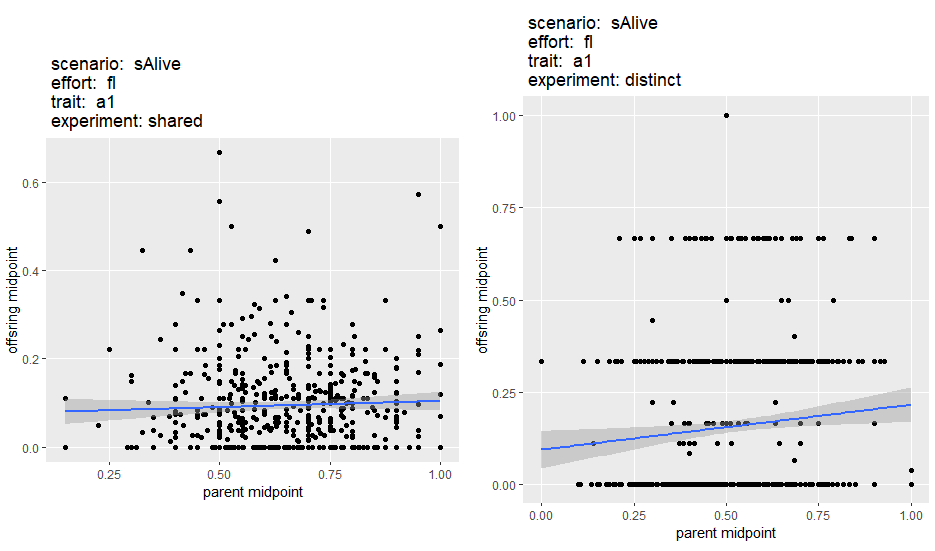
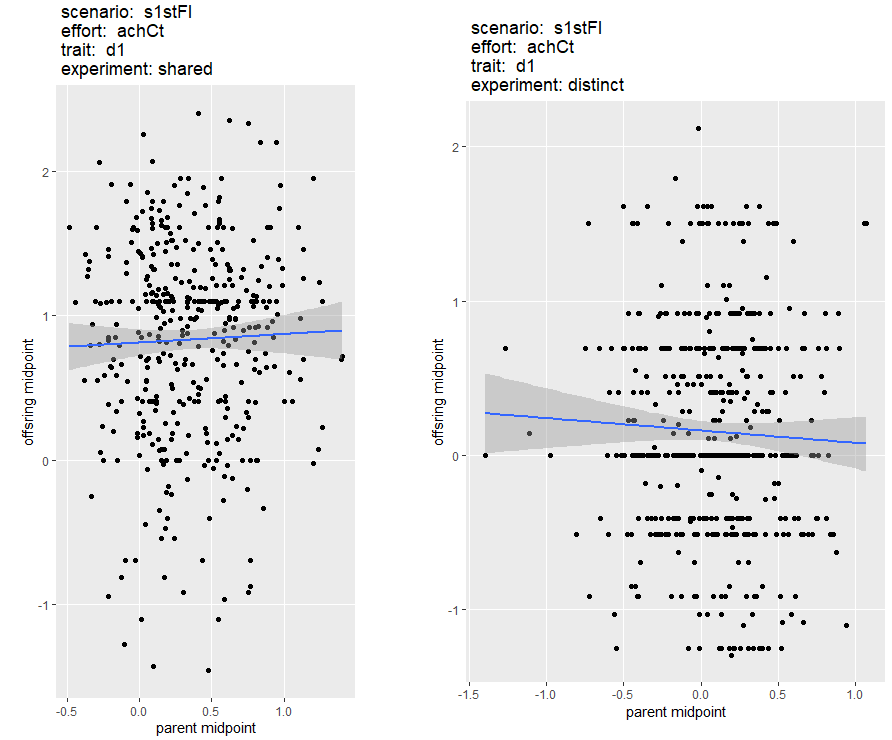
For the mathematical work of my thesis, I have multiple different datasets, measures of reproductive effort, and ways of quantifying a phenotype related to fire-stimulated flowering. Different combinations of these variables can significantly change what the end plots looks like. Again, a more in depth explanation is to come, for now, just function.
I developed a function where you can input these arguments as variables and it spits out several plots, the last of which is a parent-offspring regression for both my shared and distinct cohorts. (Did I mention there’s more context to come? This is in media res storytelling.) Check it out:


