|
|
 Counting the fruit of a flowering plant. In 2009 and 2010, porcupine grass (Hesperostipa spartea, a.k.a. “stipa”) was planted in experimental plot 1. In total, 4417 seeds were planted, 1 m apart, 10 cm north of Echinacea plants. Between 2010 and 2013, each position was checked, and the plant status recorded. Since 2014, we have only searched for flowering plants. This summer, 143 flowering stipa were found, with a median of 24 fruit per plant. We also checked for living plants in positions where stipa was observed in 2011 or 2014. In these additional 492 positions, 89 plants were found alive, with 19 of those plants flowering.
The following table shows how many plants have been found alive in each year.
| Year |
Found |
Flowering |
Full Fruit |
| 2010* |
702 |
|
|
| 2011 |
483 |
|
|
| 2013 |
442 |
4 |
|
| 2014** |
32 |
32 |
199 |
| 2015*** |
26 |
1 |
9 |
| 2016**** |
208 |
143 |
4391 |
(*) only one cohort (2009) included, (**) only searched for flowering plants, (***) only searched prior year’s flowering plants, (****) only searched flowering plants + subset of positions
Start year: 2009
Location: Experimental plot 1
Physical specimens: Fruits from 127 flowering plants, currently stored at the lab in Chicago. These may be used in a future study on traits of stipa‘s awns.
Data collected:
- Culm count and number of fruits recorded on visors (backed up to CGData)
- Fruit harvest information recorded on paper (stored at Hjelm house)
- Status of 2011 basal plants recorded on visors (backed up to as “2016stipaRecheck2011positions” in CGData)
Products:
- Josh Drizin’s MS thesis included a section on the hygroscopicity (reaction to humidity) of stipa awns. View his presentation or watch his short video.
- Joseph Campagna and Jamie Sauer (Lake Forest College) did a report on variation in stipa’s physical traits within and among families in 2009
You can find out more about stipa in the common garden and links to previous flog posts about this project on the background page for this experiment.
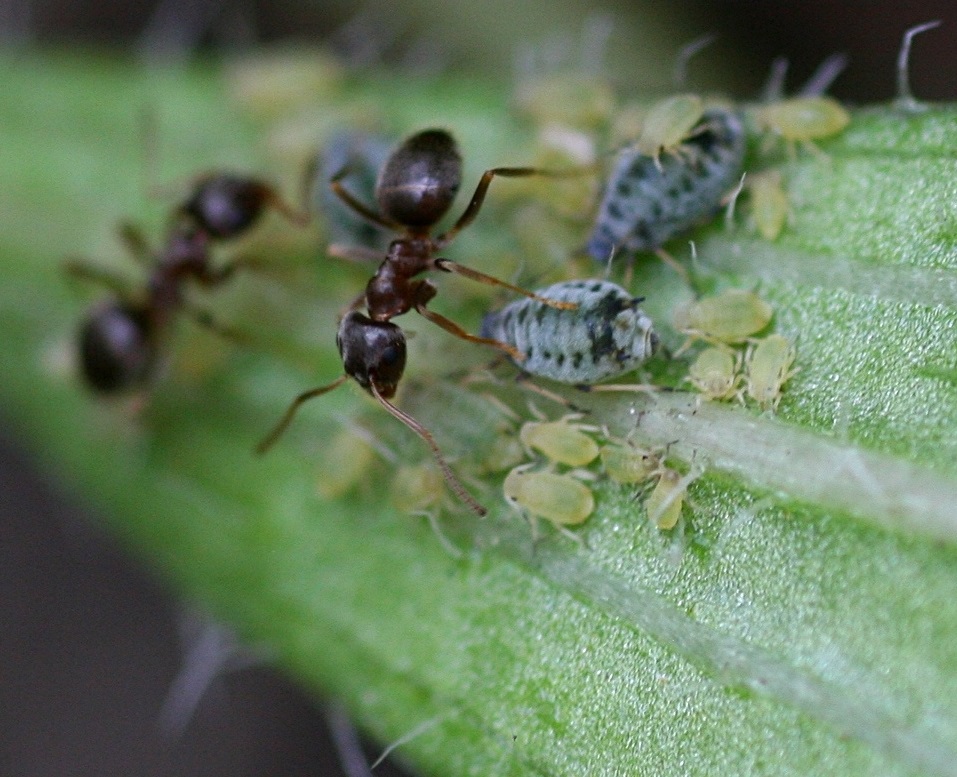
 Ants tending Aphis echinaceae Aphis echinaceae is a specialist aphid that is found only on Echinacea angustifolia. It feeds on sap in Echinacea leaves, and can also be found on flowering heads. This aphid also attracts “ant bodyguards”, which protect the aphids from predation, and in the process may also fend off other potential herbivores. Prior studies by Team Echinacea members have demonstrated that aphid presence does not lead to significant changes in plant fitness in observational studies, although in controlled experiments aphid presence does affect herbivore damage. Furthermore, inbred plants are more susceptible to aphid presence than outbred plants.
In 2011, Katherine Muller designated a sample of 100 plants in experimental plot 1 for aphid addition or removal. The presence or absence of these aphids is maintained by team members two to three times per week. In summer 2016, aphid levels were assessed and maintained 14 times on 70 of these plants (addition on 33, exclusion on 37) from early July until early August. In September, Amy Waananen recorded signs of senescence in the leaves of treatment plants. This data can be combined with data from our common garden measuring data to explore the richness of the Echinacea-aphid relationship.
Start year: 2011
Location: Experimental Plot 1
Overlaps with: Phenology and fitness in P1
Data collected:
- Aphid counts for each treatment plant on each observation day, on paper
- Leaf senescence data, recorded on paper
- Initial and final assessment of aphid counts on treatment plants, recorded on paper
- Paper records stored in ‘Aphids 2016’ binder, currently at Chicago Botanic Garden
- Aphid counts also included in p1 measuring data
Products:
- 2016 paper by Katherine Muller and Stuart on aphids and foliar herbivory damage on Echinacea
- 2015 paper by Ruth Shaw and Stuart on fitness and demographic consequences of aphid loads
- 2015 poster by Daniel Brown and Kyle Silverhus (Lake Forest College) on achene and seed set differences on treatment plants
You can read more about the aphid addition and exclusion experiment, as well as links to prior flog entries mentioning the experiment, on the background page for this experiment.
 Echinacea Pallida at Hegg Lake Although originally used as part of Josh Drizin’s experiment with exotic grasses, this plot also has hybrids of Echinacea angustifolia and Echinacea pallida. Gretel and Nicholas Goldsmith performed reciprocal crosses between 5 non-native pallida plants found at Hegg Lake and 31 angustifolia plants in P1 and planted 66 seedlings between grasses in 2012. These plants have been revisited each summer since then. This year, on August 3rd, Laura Leventhal and I found 36 of the original 66 plants – a sharp decline from the 55 found last year. This means that 55% of the original cohort is still alive, with the survival rate this winter of 65%. Of the surviving plants, only three had more than one rosette.
Year started: Crossing in 2011, planting in 2012
Location: Experimental Plot 6, on Tower Road
Overlaps with: Echinacea hybrids — ex Pt 7, Echinacea hybrids — ex Pt 9
Data collected: Status, rosette count, longest leaf measurement, and number of leaves for each plant. Exported to CGData.
Products: Nicholas Goldsmith’s summary of the crossing done in 2011 can be found here.
You can find more information about experimental plot 6 and previous flog posts about it on the background page for the experiment.
 Echinacea pallida observed at Hegg Lake. This summer, we remeasured plants in experimental plot 7 at Hegg Lake. These plants are hybrids of Echinacea angustifolia (native) and Echinacea pallida (non-native, but planted at a nearby restoration). Shona Sanford-Long performed these crosses in 2012, Jill Pastick germinated the seeds that winter, and Stuart planted the seedlings the following spring. It is not yet known how the introduction of this non-native species will affect local Echinacea angustifolia populations. The survival rates and reproductive fitness of these plants can tell us how well the hybrids can compete with the native species. We have returned to the plot each of the last three years and measured the plants found there.
198 of the original 294 planted seedlings (67.3%) were found this year. The table below shows the fate of each cross-type in 2016 — the first name in the cross type is the maternal species, and the second name is the paternal species (e.g., ‘ang_pal’ is angustifolia mother and pallida father). These plants were measured on August 3rd and rechecked on September 2nd. No plants flowered this year, meaning that we must wait longer to assess seed set and reproductive fitness.
Cross Type
Found16 ang_ang ang_pal pal_ang pal_pal
no 34 10 20 32
yes 37 21 65 75
Start year: Crossing in 2012, Planting in 2013
Location: Hegg Lake Wildlife Management Area – Experimental Plot 7
Overlaps with: Echinacea hybrids: ex Pt 6; Echinacea hybrids: ex Pt 9
Data collected: Rosette number, length of all leaves, herbivory for each plant collected electronically and exported to CGData. Recheck information for plants not found was also collected electronically and stored in CGData.
Products: Taylor Harris’s 2015 poster demonstrating fitness benefits of pallida parenthood.
You can find more information and links to previous flog entries involving experimental plot 7 on the background page for the experiment.
Inbreeding has negative effects on Echinacea, leading to reduced survival and fitness. In isolated populations, populations could benefit from genetic diversity introduced by mating with individuals from other populations (“outcrossing”). However, gene flow from other populations may compromise a population’s adaptation to its local environment. Amy Dykstra designed an experiment to test how mating with individuals from other populations affects Echinacea fitness. In the summer of 2008, Amy and Team Echinacea performed 259 crosses between individuals randomly selected from 6 of the largest remnant populations. That fall, Amy planted the offspring of these crosses (15,491 achenes) into an experimental plot at Hegg Lake WMA.
Every summer, including 2016, we measure plant status, number of rosettes, number of leaves, and length of the longest leaf of the individuals in the plot. We also note damage (herbivory) to the leaves.
 Hegg Lake WMA (Amy’s plot is visible on the horizon to the right of the lake) Start year: 2008
Location: Hegg Lake WMA
Overlaps with: Dykstra’s local adaptation
Data collected: We collected plant fitness measurements (plant status, number of rosettes, number of leaves, and length of longest leaf) electronically.
GPS points shot: We shot points at all surviving plants (and a few that we couldn’t find this year, but will check next year) in the experimental plot, which will make finding and monitoring these plants much more efficient in the future. The points are stored in ‘AMYSCROSSIG_20160712_SULU.tsj’ and some rechecks to those points are in “AMYSCROSSING_20160830_SULU.tsj’.
Products: Read about Amy’s analysis of the interpopulation crossing experiment in her flog post from last summer.
You can find more information about Amy’s experiment and links to previous flog posts regarding this experiment at the background page for the experiment.
In 2008, Amy Dykstra began an experiment to study how adapted Echinacea populations are to their local environments. She collected achenes from three populations distributed across a wide section of Echinacea angustifolia’s range, from Western South Dakota to our study site in Western Minnesota. She established a plot near each collection site where she sowed achenes from all sites. Since then, Amy has assessed survival and fitness traits of the individuals in her plots annually.
The exciting news about this experiment is that three plants flowered this year: two had one head each, and one had vertical development of its stem, but did not form a flowering head. All three were in the Western South Dakota plot and originated from Western Minnesota seed. This summer was the first time that Amy saw any flowering in this experiment. We hope for more flowering in the future so that Amy can analyze how local adaptation affects adult life stages of Echinacea.
 Amy saw the first flowering plants in the local adaptation experiment in 2016 Start year: 2008
Location: Grand River National Grassland (Western South Dakota), Samuel H. Ordway Prairie (Central South Dakota), Staffanson Prairie Preserve (West Central Minnesota), and Hegg Lake WMA (West Central Minnesota).
Overlaps with: Dykstra’s interpopulation crosses
Data collected: Amy collected plant fitness measurements (plant status, number of rosettes, number of leaves, and length of longest leaf) electronically.
You can find more information about Amy’s local adaptation experiment and links to previous flog posts regarding this experiment at the background page for the experiment.
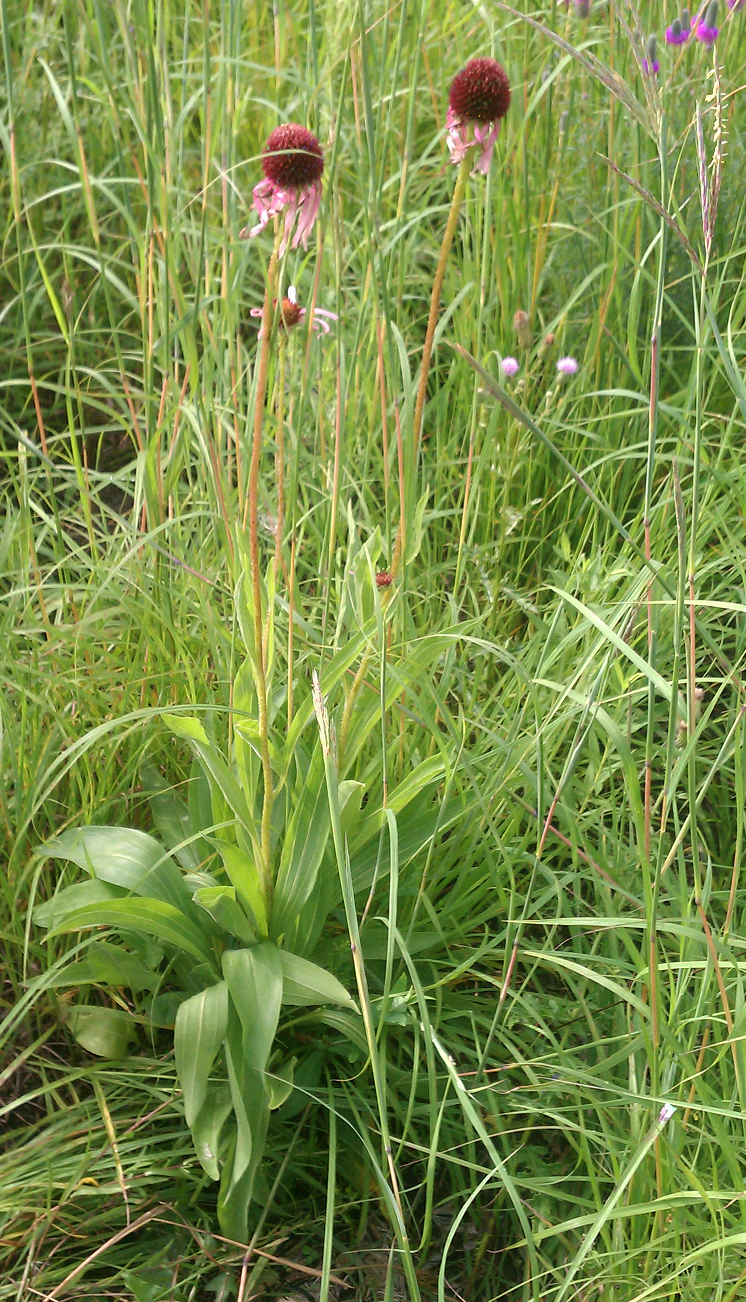
This experiment assesses effects of fire on the fitness of Cirsium hillii (Hill’s thistle) plants at Hegg Lake WMA. Like Echinacea, C. hillii inhabits dry prairies, but Hill’s thistle is listed as a Species of Special Concern in Minnesota and little is known about how it responds to fire. Burn and non-burn units were created prior to an experimental fall burn conducted by the DNR in 2014. That year, we mapped 28 C. hillii rosettes (basal and flowering).
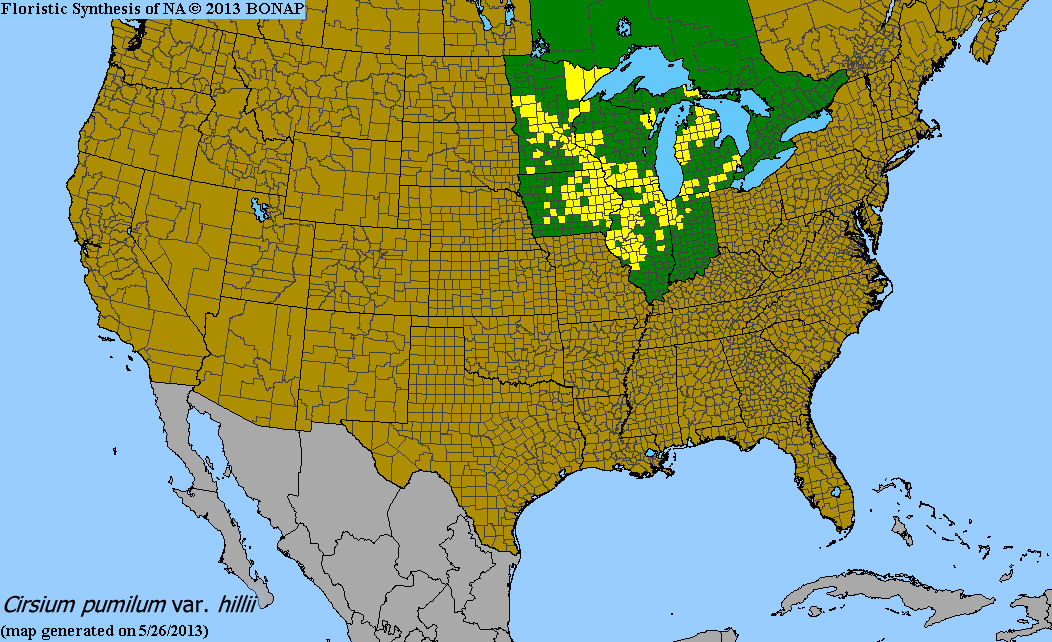
We revisited the locations this year, a non-burn year, and found three flowering rosettes. Several of the rosettes we found in previous years weren’t present this year. We weren’t sure if this was an indication of mortality since C. hillii is clonal, and it’s possible that each rosette is not a unique individual. Last year, Abbey White, a masters student in the Plant Biology and Conservation program at Northwestern, she analyzed the genetic diversity of tissue samples from each rosette. Based on a conservative delineation of genotypes, she found that there was only one individual in our C. hillii “population!” If she uses a more liberal approach, there are two individuals. We don’t know of any other C. hillii populations in Douglas County and are possibly monitoring the last individual in the area.
 The distribution of Cirsium hillii, a rare endemic to the Great Lakes region (yellow counties are where C. hillii has been found) Start year: 2014
Location: Hegg Lake WMA
Overlaps with: fire and flowering at Staffanson Prairie Preserve
Data collected: We measured the length of the longest axis of a basal rosette and the corresponding perpendicular axis. These data were recorded electronically in a memo and are backed up in Handspring.
Products:
You can find more information about our experiment on how fire affects the fitness of Cirsium hillii and links to previous flog posts regarding this experiment at the background page for the experiment.
In 2016, we continued our ongoing study of mating compatibility in the remnants that began in 2014. This experiment is designed to assess population level compatibility and to investigate whether the difference in the timing of flowering (phenology) and the distance between plants predict whether mating will be successful, or the cross will be compatible. This year, we randomly selected 10 focal plants from remnant populations and chose their four nearest neighbors to be pollen donors.
We conducted this study in six remnant populations with approximately ten focal plants at each for a total of 279 pairwise crosses. Occasionally we were unable to collect pollen from the four nearest neighbors of the focal plant because they flowered asynchronously with the focal plant, and in those cases we chose the nest nearest individual available. Excluding all other pollinators, we performed hand-crosses between the focal plants and their pollen donors and assessed style persistence the following day to evaluate the compatibility of each cross.
We observed wide variation in compatibility among sites, with focal plants at some sites compatible with an average of 90% of their nearby neighbors and only 64% at others. Further analysis will tell what relationship this pattern might have with individuals’ synchrony of flowering and proximity to mates!
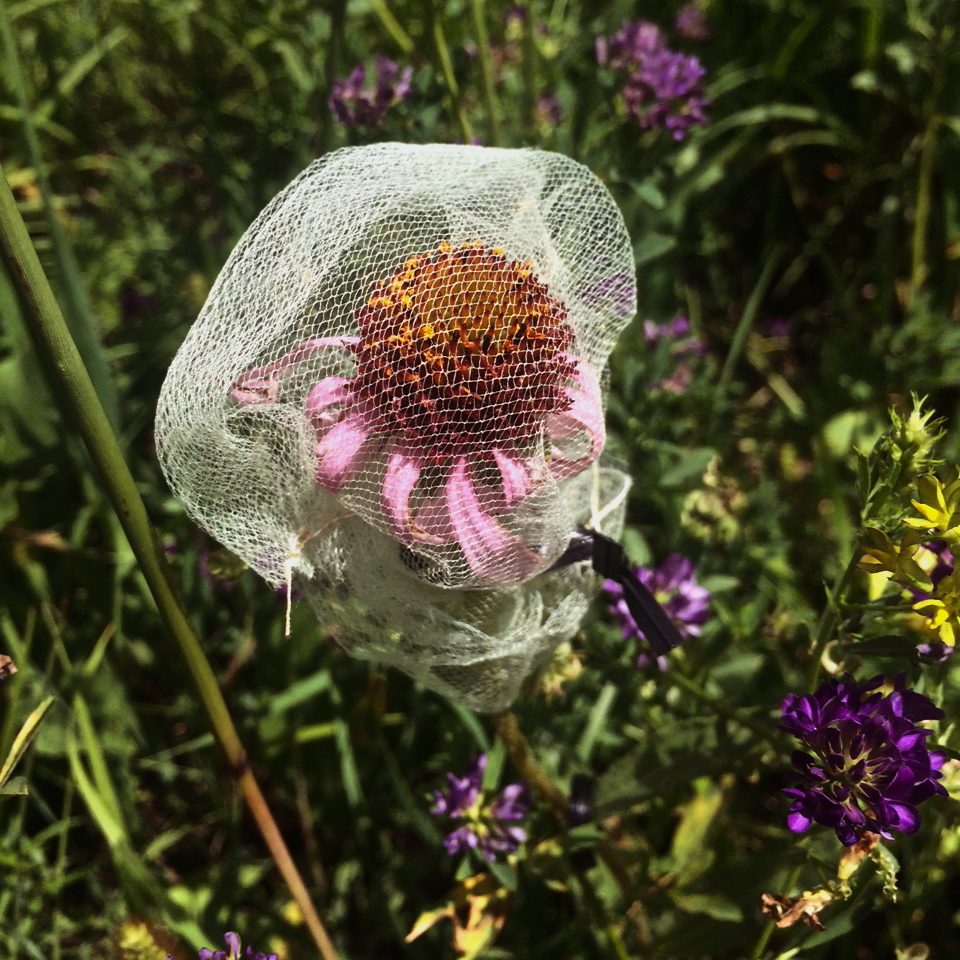
 We exclude pollinators from our focal plants and pollen donors using bridal veil material, an evocative method rich with symbolism of purity and loss of innocence. Start year: 2014
Location: large remnant populations in Solem Township, Minnesota
Data collected: We collected data about the identities of the individuals and outcome of crosses on paper datasheets. The phenology data was collected electronically. We used GPS units to collect spatial data about individuals’ location and isolation.
Products: We entered the data from 2016 and it is ready to be compiled and analyzed with the 2014 and 2015 datasets.
You can find more information about our compatibility experiment and links to previous flog posts regarding this experiment at the background page for the experiment.
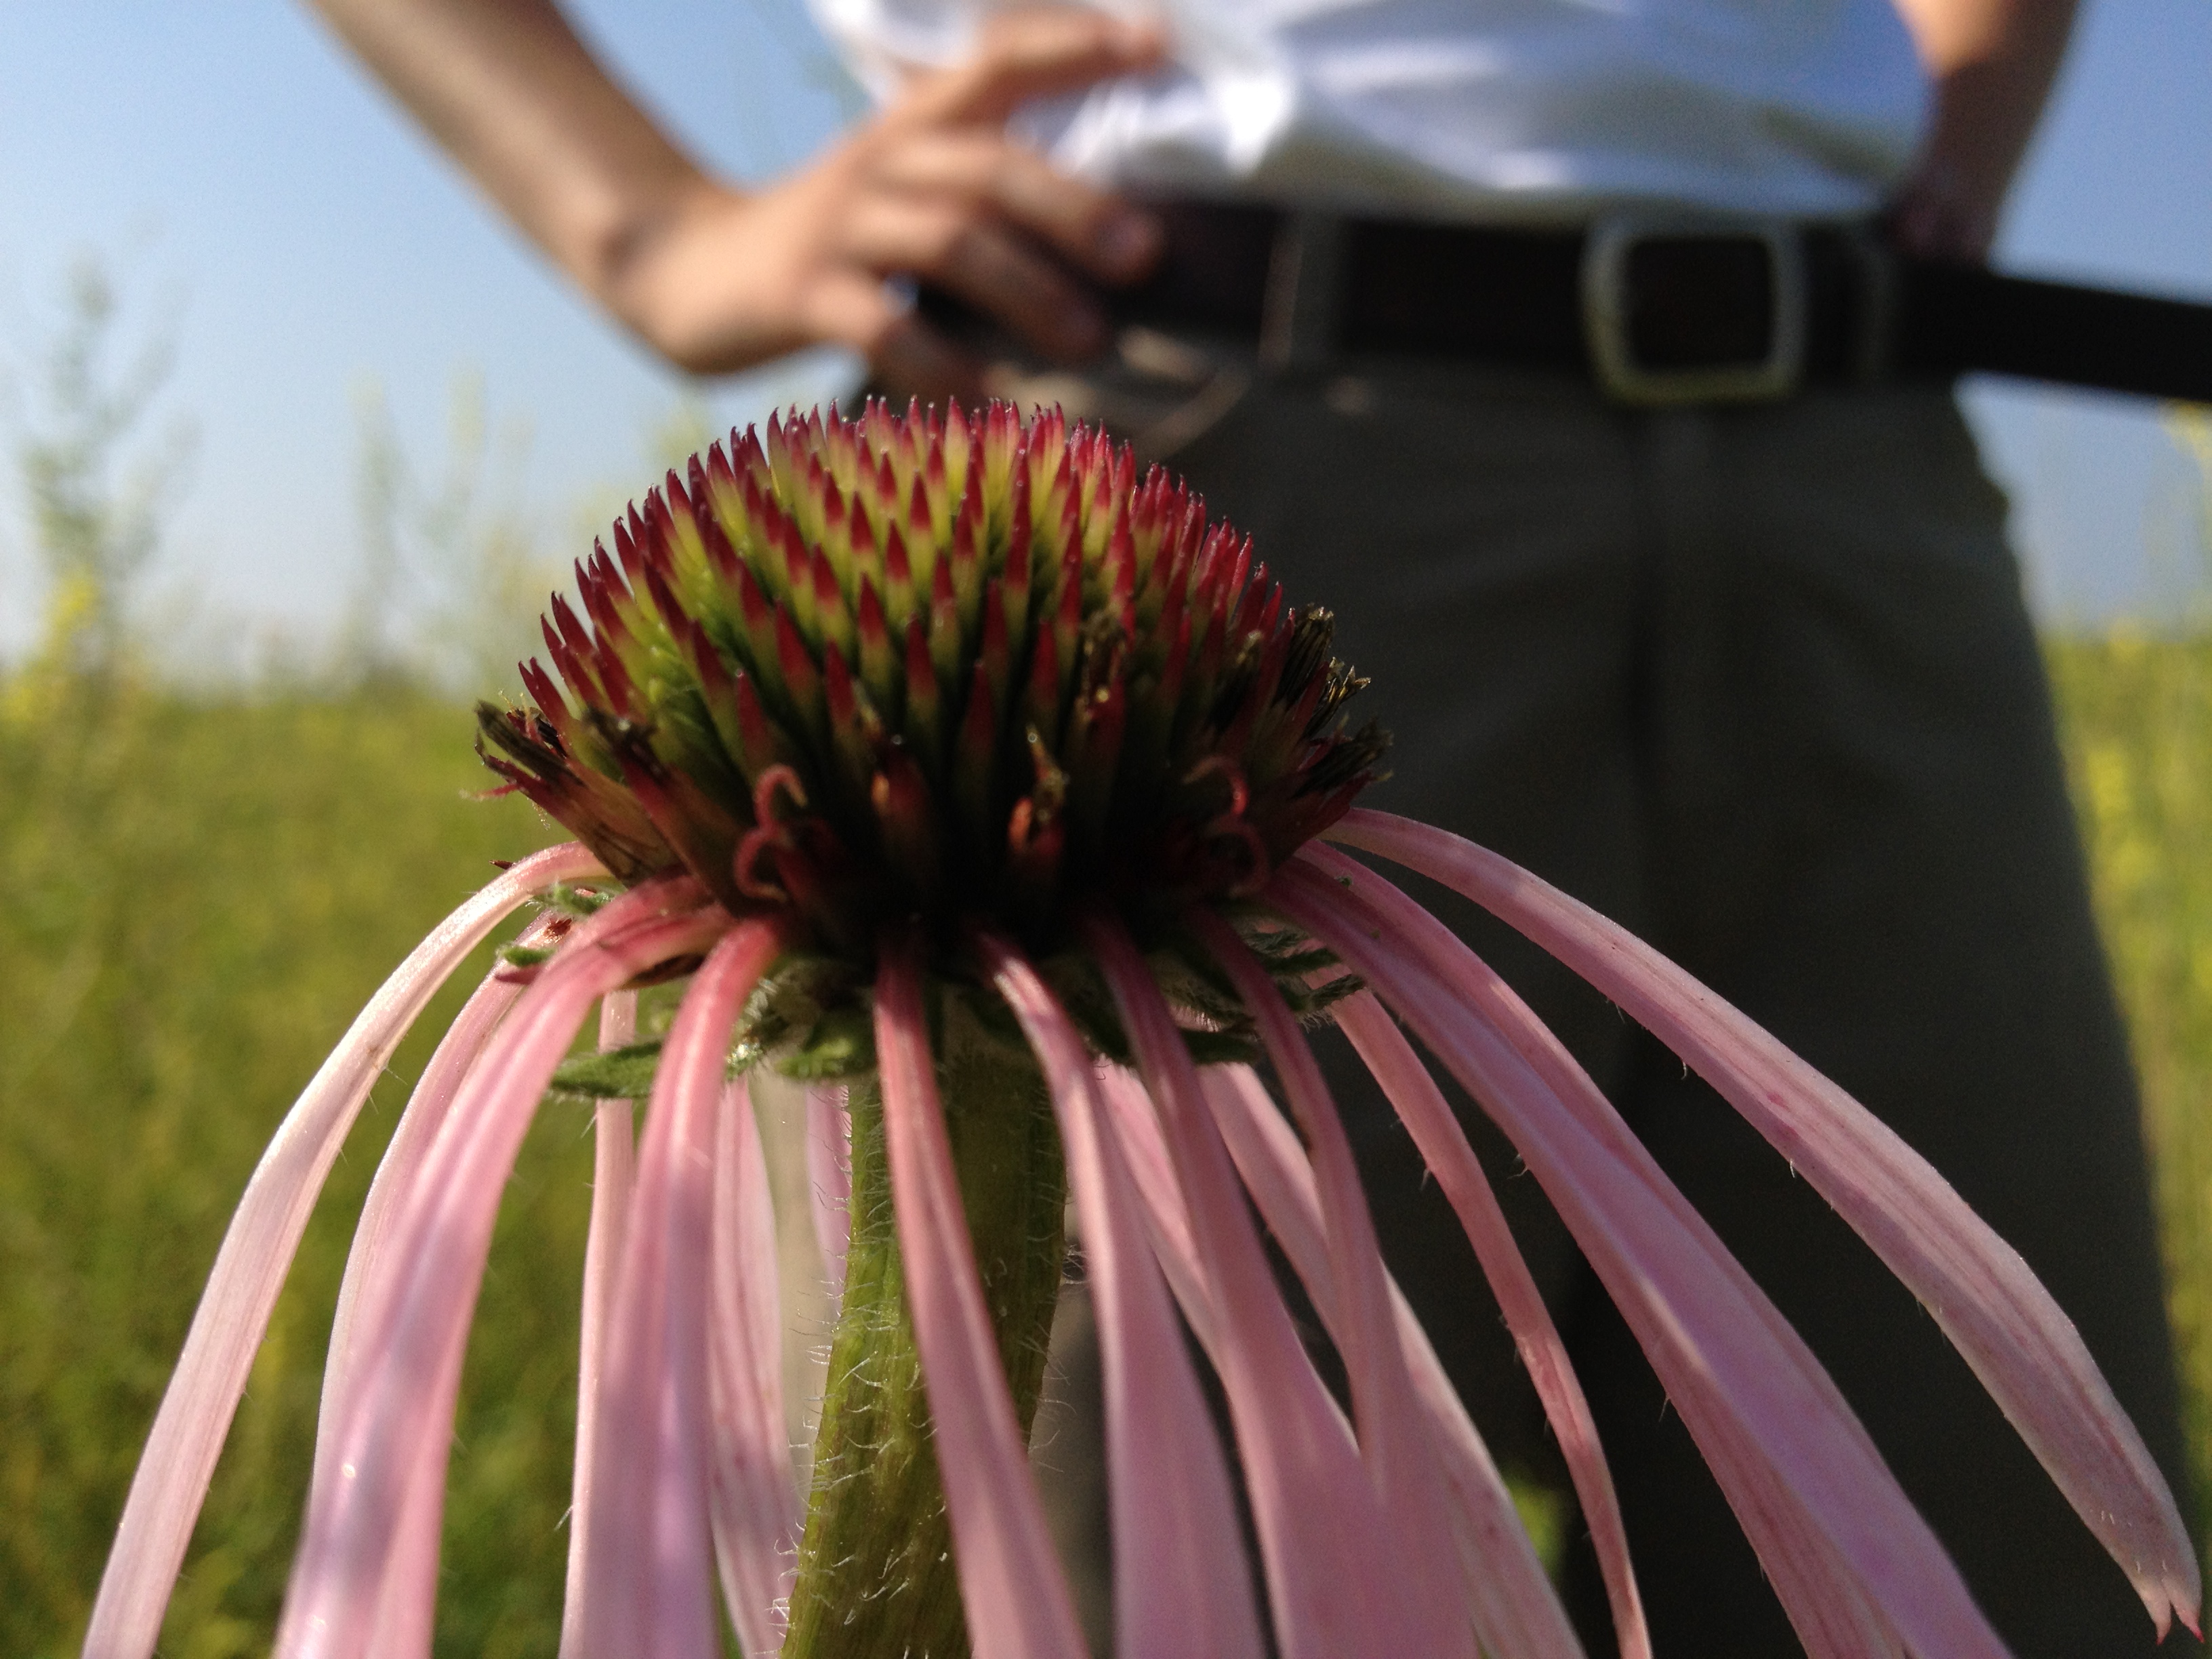
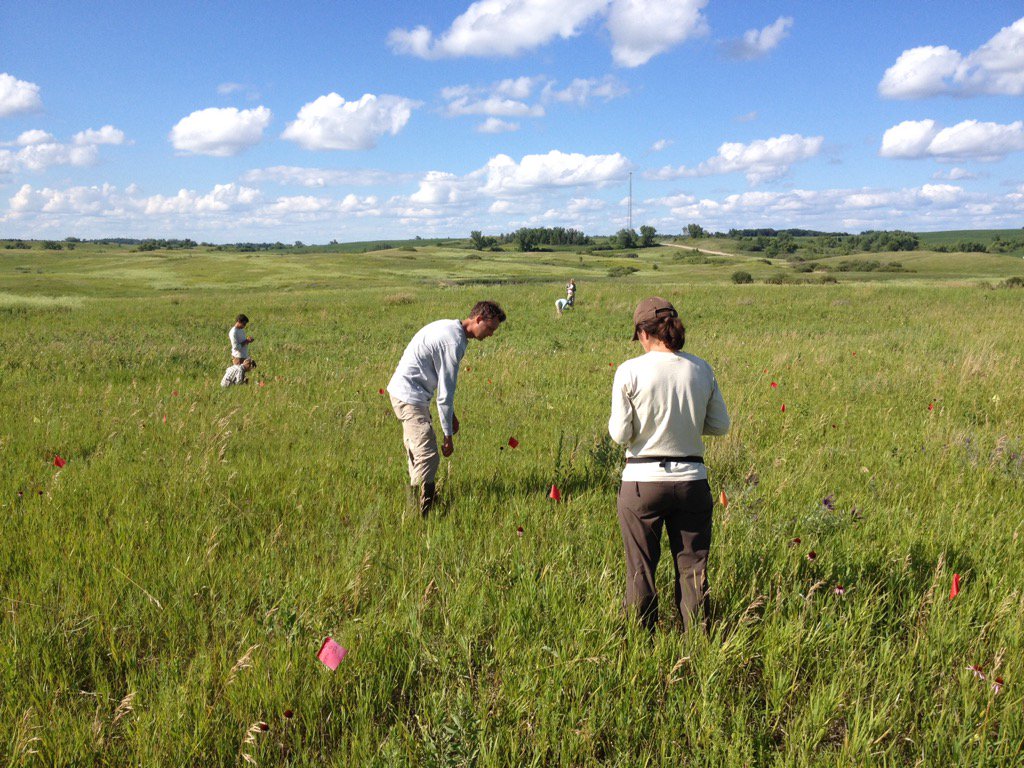
To examine the role flowering phenology plays in the reproduction of Echinacea angustifolia, Jennifer Ison planted experimental plot 2 (exPt 2) in 2006 with 3961 individuals selected for extreme (early or late) flowering timing, or phenology. In 2016, we monitored the start and end dates of flowering for the 570 flowering plants (933 heads) in the plot. The first head started shedding pollen on June 22 and the latest bloomer ended flowering on August 8th. Peak flowering was on July 7th, when 810 heads were flowering. Using the phenological data collected this summer, we will explore how flowering phenology influences reproductive fitness and estimate the heritability of flowering time in Echinacea angustifolia.
 Tracking phenology for 900+ heads in exPt2 was a big job. Here, three teams assess phenology on a nice day at exPt 2. Start year: 2006
Location: Experimental Plot 2, Hegg Lake WMA
Overlaps with: phenology in experimental plots, phenology in the remnants
Physical specimen: We harvested 870 heads from exPt 2. We were unable to harvest some heads which had been grazed by rodents. We brought the harvest back to the lab, where we will count fruits and assess seed set. Jennifer previously collected tissue samples from all individuals in the plot and plans to use these to genotype all of the individuals that flowered in 2016 this year and determine their parentage in exPt 1.
Data collected: We visit all plants with flowering heads every three days until they are done flowering to record start and end dates of flowering for all heads. We managed phenology data in R and added it to the full dataset.
Products: Will estimated heritability of flowering time using the data from 2015 and presented his findings this summer at ESA (see his poster here). He is continuing this work by assessing how heritability estimates differ between two years. He is comparing flowering in 2015 (a burn year) and 2016 (a non-burn year).
You can find more information about our experiment the heritability of flowering time and links to previous flog posts regarding this experiment at the background page for the experiment.
One of many visits to each flowering plant in prairie remnants. Assessing fitness is a key part of understanding change in any population. The Echinacea Project has focused on two quantifiable components of reproductive fitness of Echinacea angustifolia: style persistence and seed set. Styles shrivel when they receive compatible pollen, and thus persistence of styles reflects pollen limitation. A floret sets a seeds only when it has been successfully pollinated. Together, these two indicators can be used to predict how effectively individual plants produce viable offspring, giving insights into the persistence of remnant populations.
This year, we counted shriveled and non-shriveled rows of styles on each flowering head of every plant in 28 remnants three times per week. Well after the flowering season, we harvested 104 heads at a subset of these sites. The harvested heads will have their achenes removed, counted, and x-rayed by citizen science volunteers to estimate how many seeds they produced. There were several concurrent projects this summer and in the lab that use these measures, including Amy Waananen’s compatibility study and James Eckhardt’s study of edge effects.
Year: 1996
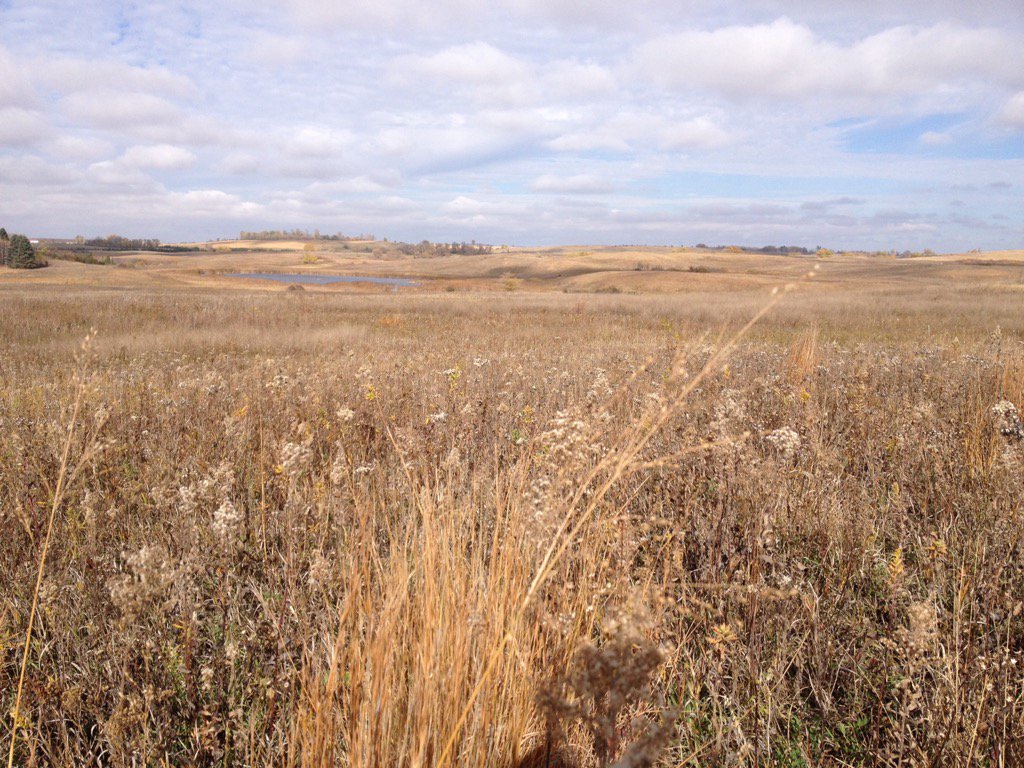
Location: Roadsides, railroads and rights of way, and nature preserves in and near Solem Township, Minnesota.
Overlaps with: flowering phenology in remnants, mating compatability in remnants
Physical specimens: 104 harvested heads, currently at the Chicago Botanic Garden
Data collected:
- Style persistence data for each flowering head, collected three times per week, stored in remData
- Dates and identities of harvested heads, stored on paper datasheets in Harvest 2016 binder and entered electronically into remData
GPS Points Shot: A point for each flowering head, stored under PHEN and SURV records in GeospatialDataBackup
Products:
You can find out more about reproductive fitness in the remnants and read previous flog posts about it on the background page for the experiment.
|
|