|
|
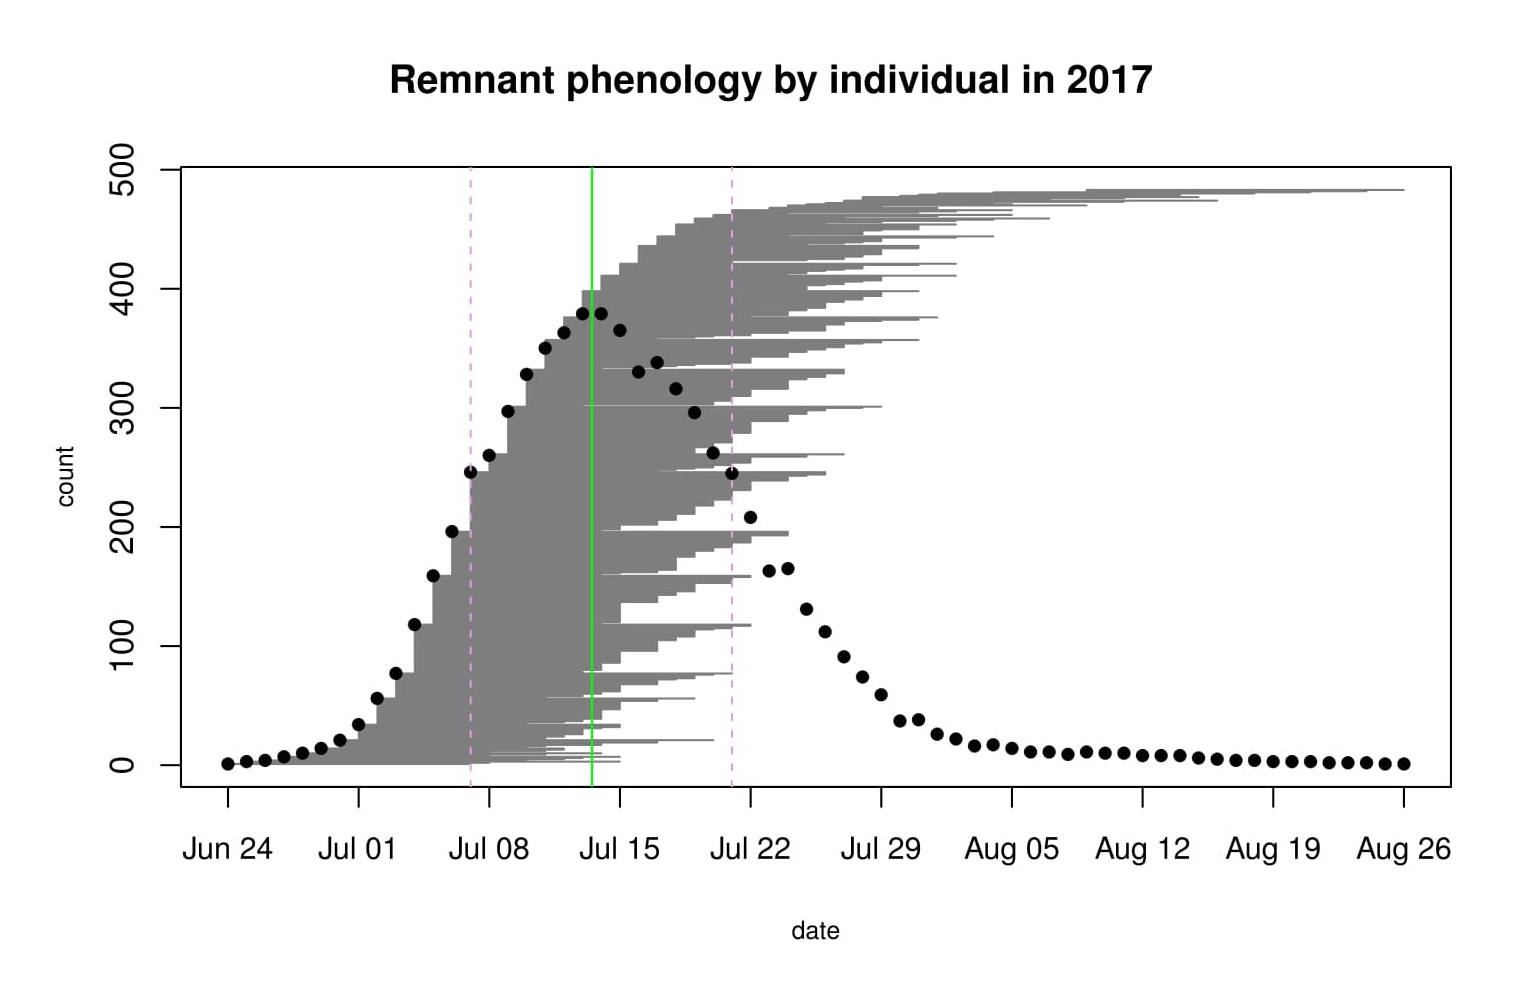
In 2017, according to our preliminary data, flowering began on June 24th with one head at the Aanenson remnant. The latest bloomer was a 5-headed plant at Steven’s Approach, and the last day its last head shed pollen was August 26th. Peak flowering for the 9 remnants we observed this year was July 13th. There was a total of 427 flowering plants producing 575 flowering heads. The figure below was generated with R package mateable, which was was developed by Team Echinacea to visualize and analyze phenology data.
 The gray shaded area is made up of horizontal gray lines, each representing the duration of one flowering head. The vertical green line represents the peak flowering date, July 13th. On average, heads flowered for approximately 2 weeks. From 2014-2016, determining flowering phenology was a major focus of the summer fieldwork, with Team Echinacea tracking phenology in all plant in all of our remnant populations. Stuart began studying phenology in remnant populations between 1996 and 1999 and several students also studied certain populations in following years. The motivation behind this study is to understand how timing of flowering affects the reproductive opportunities and fitness of individuals in natural populations.
Start year: 1996
Location: roadsides, railroad rights of way, and nature preserves in and near Solem Township, MN (2017: Aanenson, Around Landfill, East Elk Lake Road, Nessman, Northwest Landfill, Steven’s Approach, Staffanson Prairie Preserve, Town Hall)
Overlaps with: Phenology in experimental plots, demography in the remnants, reproductive fitness in remnants
Physical specimens:
- We harvested 121 Echinacea heads at 8 of the 28 remnants. These were harvested from Lea and Tracie’s “rich hood” (richness of neighborhood) plots. Not all harvested heads were monitored for the phenology dataset.
Data collected: We identify each plant with a numbered tag affixed to the base and give each head a colored twist tie, so that each head has a unique tag/twist-tie combination, or “head ID”, under which we store all phenology data. We monitor the flowering status of all flowering plants in the remnants, visiting at least once every three days (usually every two days) until all heads were done flowering to obtain start and end dates of flowering. We managed the data in the R project ‘aiisummer2017′ and will add it to the database of previous years’ remnant phenology records.
GPS points shot: We shot GPS points at all of the plants we monitored. The locations of plants this year will be aligned with previously recorded locations, and each will be given a unique identifier (‘AKA’). We will link this year’s phenology and survey records via the headID to AKA table.
You can find more information about phenology in the remnants and links to previous flog posts regarding this experiment at the background page for the experiment.
In 2017, we checked 119 focal plants at 12 remnants for nearby seedlings found in previous years. We found 123 out of the original 955 seedlings (25 fewer than the 148 found last fall). Although challenging to obtain, information about the early stages of E. angustifolia in remnants is valuable.
 Generations of Echinacea: A fallen head dropped achenes that have germinated. How many seedlings do you see? These data tell us how many years it takes plants to flower (a LONG time!) and the mortality rate for seedlings in remnants.
Between the summers of 2007 and 2013, team Echinacea observed the recruitment of Echinacea angustifolia seedlings around focal plants at 13 different prairie remnants. The locations of these seedlings were mapped relative to each focal plant and the seedlings (now former seedlings) are revisited each year. For each of these former seedlings, we make a record each year updating its status (e.g., basal, not found), rosette count, and leaf lengths. We also try to update the maps, which are kept on paper and passed down through the years.
Year started: 2007
Location: East Elk Lake Road, East Riley, East of Town Hall, KJ’s, Loeffler’s Corner, Landfill, Nessman, Riley, Steven’s Approach, South of Golf Course remnants and Staffanson Prairie Preserve.
Overlaps with: Demographic census in remnants
Data collected:
- Electronic records of status, leaf measurements, rosette count, and 12-cm neighbors for each seedling. Currently in Pendragon database
- Updated paper maps with status of searched-for plants and helpful landmarks
Products: Amy Dykstra used seedling survival data from 2010 and 2011 to model population growth rates as a part of her dissertation.
You can read more about the seedling establishment experiment and links to previous flog entries about the experiment on the background page for this experiment.
In 2017, we monitored the start and end dates of flowering for the 676 flowering plants (1116 heads) in experimental Plot 2. The first head started shedding pollen on June 26 and the latest bloomer ended flowering on August 19. Peak flowering was on July 13th. Note that these dates are subject to change as this is preliminary data that has not been fully cleaned and analyzed.
To examine the role flowering phenology plays in the reproduction of Echinacea angustifolia, Jennifer Ison planted this plot in 2006 with 3961 individuals selected for extreme (early or late) flowering timing, or phenology. Using the phenological data collected this summer, we will explore how flowering phenology influences reproductive fitness and estimate the heritability of flowering time in Echinacea angustifolia.
 One of the earlier flowering plants at exP2 this summer, a plant with 5 heads at Row 2 Position 1. Start year: 2006
Location: Experimental Plot 2, Hegg Lake WMA
Overlaps with: phenology in experimental plots, phenology in the remnants
Physical specimens: We harvested approximately 1081 heads from exPt 2 (preliminary inventory). Some of these heads had a major loss of achenes, either due to the early flowering time that we were not expecting or windy and rainy weather that dispersed the achenes quickly. We brought the harvested heads back to the lab, where we will count fruits and assess seed set for each head.
Data collected: We visited all plants with flowering heads every two days (three days after weekends) until they are done flowering to record start and end dates of flowering for all heads. We will manage phenology data in R and add it to the full dataset.
Products: Will estimated heritability of flowering time using data from 2015 and presented his findings last summer at ESA (see his poster). He is continuing this work by assessing how heritability estimates differ between years in burn and non-burn years, now including 2016.
You can find more information about the heritability of flowering time and links to previous flog posts at the background page for the experiment.
This summer we collected samples of pollinators from 39 roadside sites using yellow pan traps. We captured over 400 insects across 8 weeks. The specimens are stored frozen until pinning and identification. We will use this information to make comparisons between the pollinator communities collected in 2004. This information could inform potential diversity and abundance changes across the 13 years, and provide valuable insight into potential pollinator decline in this system.
Pollinator diversity and abundance are declining due in part to land use changes such as habitat destruction & fragmentation, pesticide contamination, and numerous other anthropogenic disturbances. The extent to which pollinator diversity and abundance is changing is not well understood, especially within tallgrass prairie ecosystems. Pollinators are important in the prairie: they provide valuable ecosystem services to native plants and to important plants used in agriculture.
The goal of this experiment was to repeat a similar study done in 2004 by Wagenius and Lyon, in which they collected information on pollinator abundance and diversity with the aim of relating landscape characteristics to bee community composition.
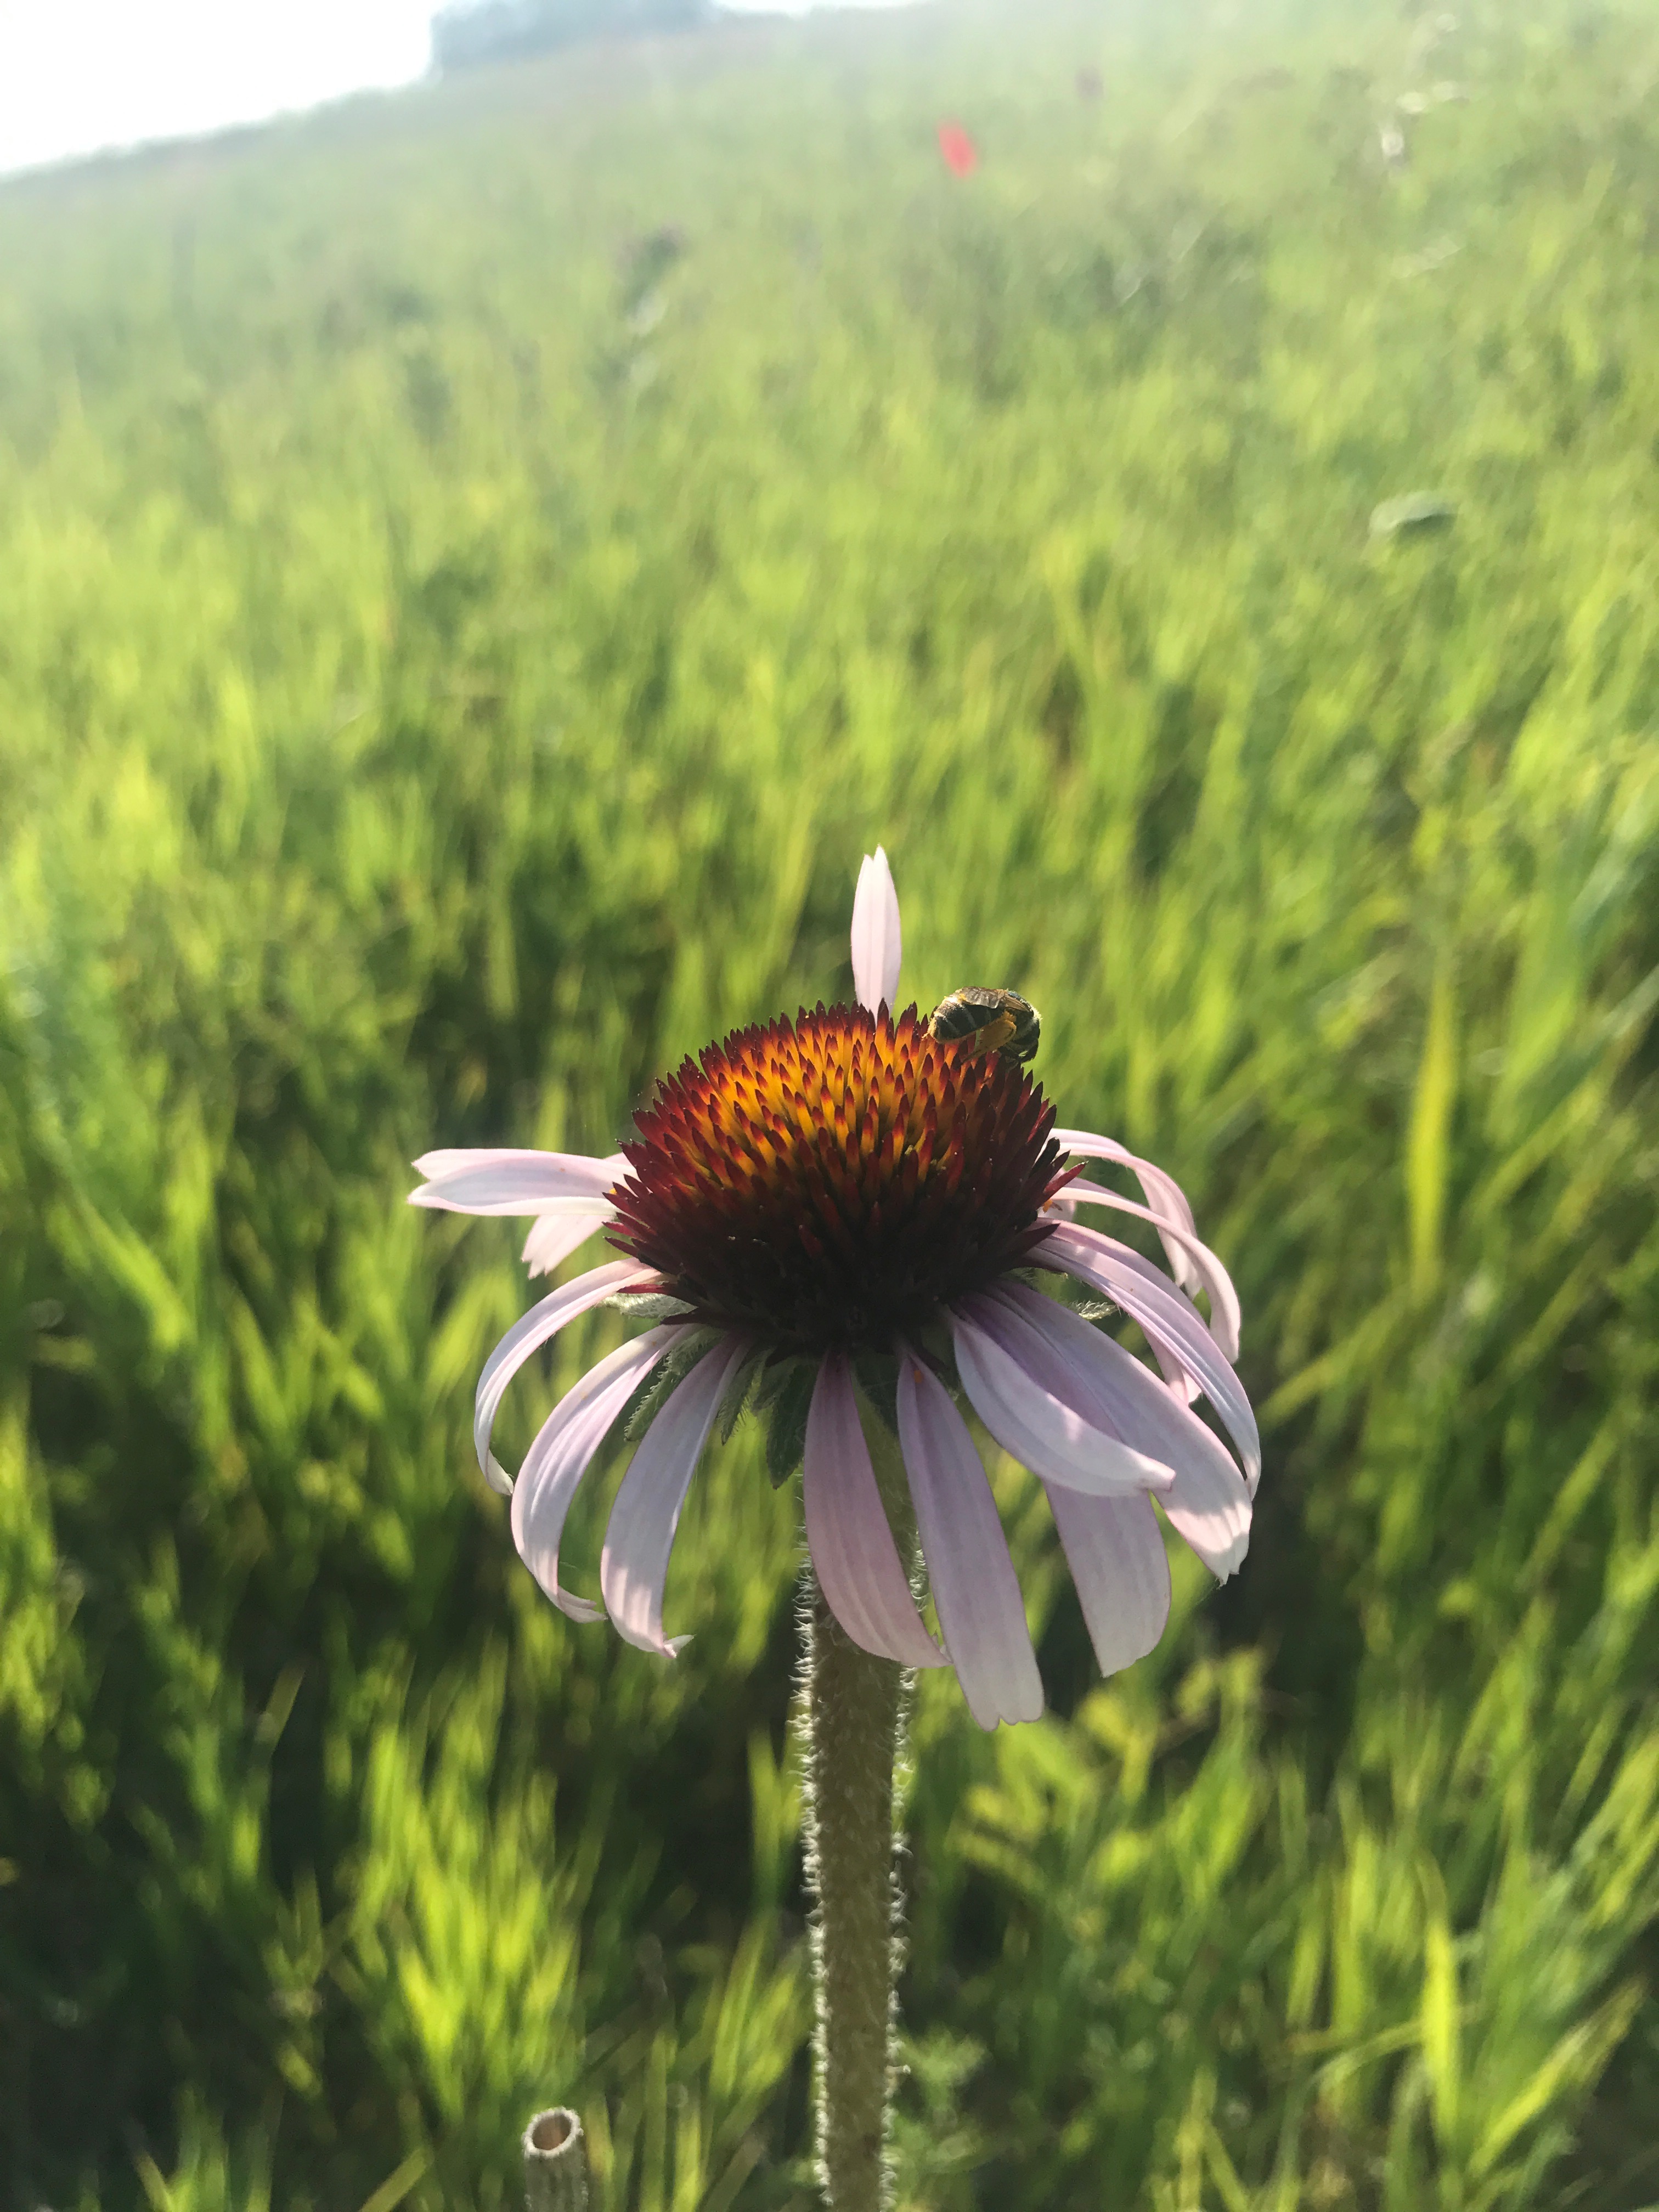
 Augochlorella sp. foraging for pollen. Our yellow pan traps are similar in color.
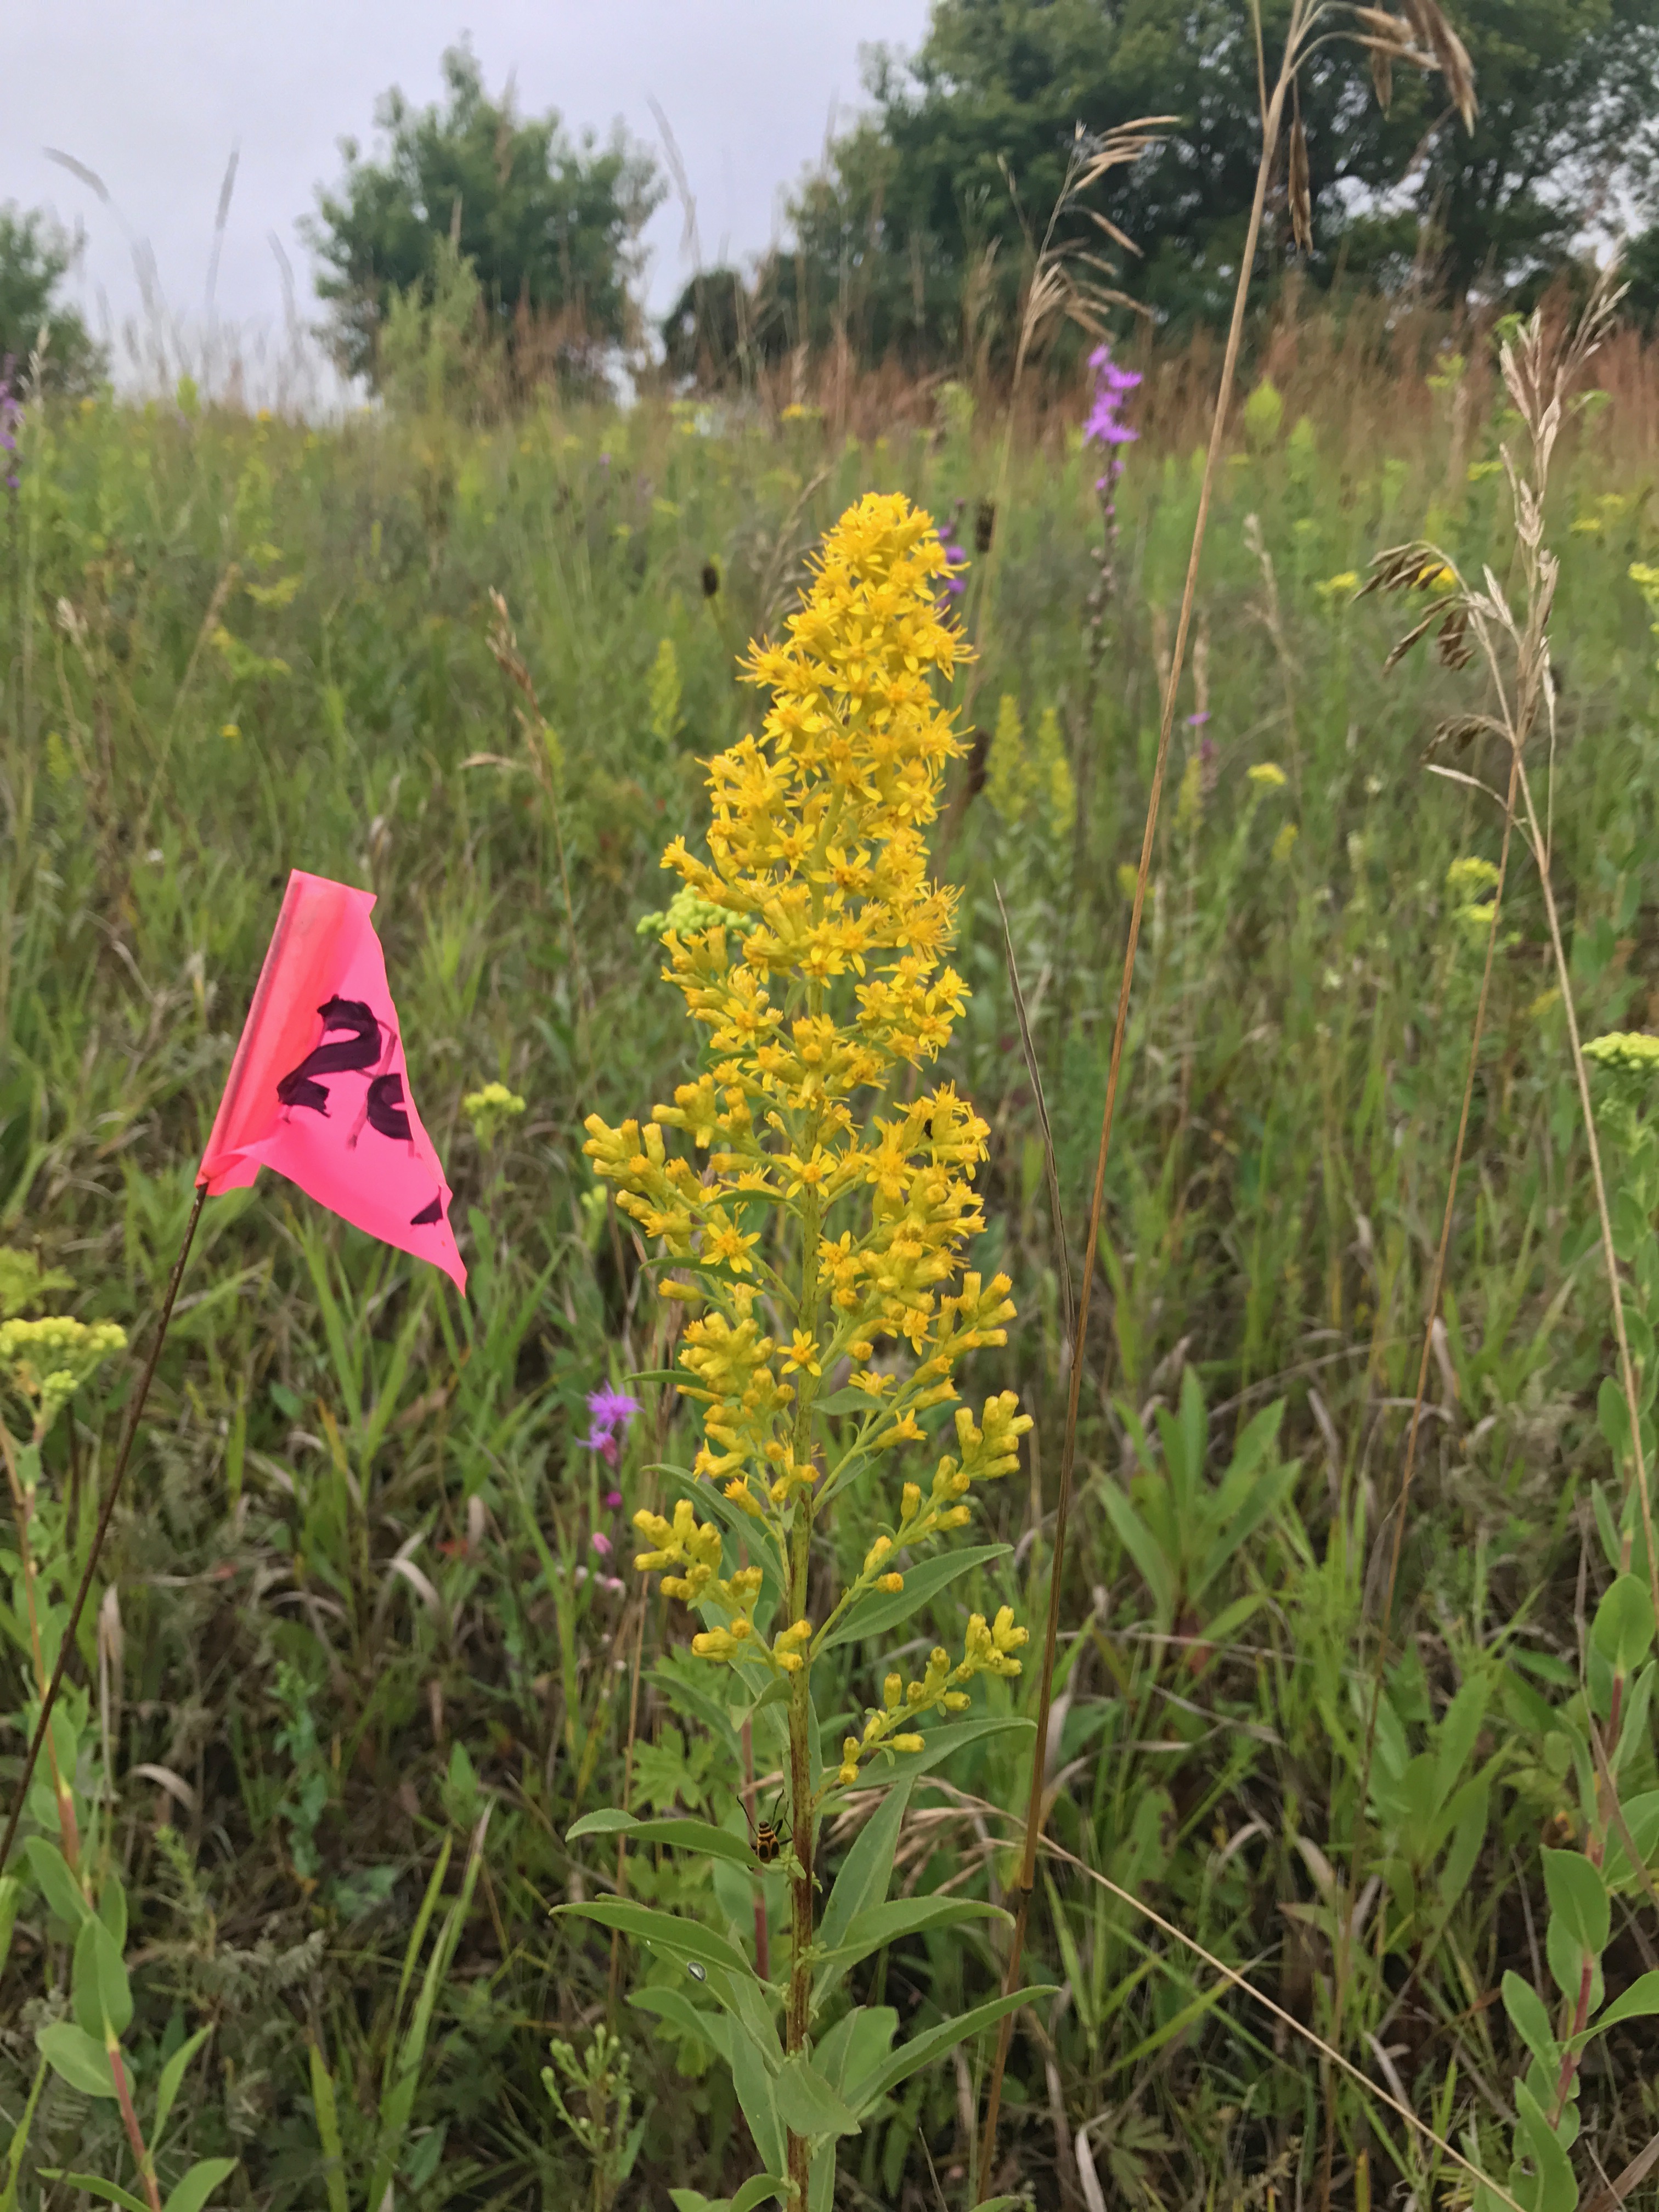
 Flowering Solidago speciosa at Staffanson Prairie Preserve. In the summer or 2017, Lea repeated her observational study quantifying flowering phenology and reproductive success (seedset) for Liatris aspera and Solidago speciosa plants located along a transect at Staffanson Prairie Preserve. Staffanson is divided into east and west units. The west unit of Staffanson was burned Spring 2016. In 2016, Lea looked for differences in phenology and reproduction of east vs. west Liatris and Solidago plants. In 2017, neither unit was burned. Data collected this year combined with data collected in 2016 will enable us to to see if burns influence phenology or reproduction. To assess phenology, Lea visited plants three times a week and recorded if they were flowering. She took GPS data for each plant included in the study. To assess reproduction (seedset), plants were harvested and brought back to the Chicago Botanic Garden so that seeds could be removed from the plant and x-rayed. This study helps us understand how fire, phenology, and reproduction are linked in species that are related to Echinacea angustifolia.
Start year: 2016
Location: Staffanson Prairie Preserve
Overlaps with: Fire and fitness of EA, Flowering phenology in remnants
Physical specimens:
- 70 harvested Liatris aspera specimens from summer 2017, located at the CBG
- 70 harvested Solidago speciosa specimens from summer 2017, located at the CBG
Data collected: Phenology data was taken on the visors every Monday, Wednesday, and Friday through the growing season. Paper harvest data sheets were used and will remain in Minnesota until the final harvest of the season.
GPS points shot: ~140 new GPS points were shot, one for each plant monitored in summer 2017 and ~180 points were staked to revisit plants that flowered last year. For each point staked, the plant status was recorded as either basal, flowering, or not present.
 Successful pollination leads to full achenes and higher fitness later in the season! This summer we counted shriveled and non-shriveled rows of styles three times per week for every Echinacea head in 8 of the 28 remnant populations. We also harvested 121 Echinacea heads to be analyzed for seedset data. This year we selected heads for harvest based on their position within randomly selected plots where Tracie Hayes and Lea Richardson collected vegetation data. In every randomly selected vegetation plot, all species were identified and we recorded their abundance. We marked any Echinacea head within a vegetation plot for harvest. Harvested heads are ready to be processed by citizen scientists at the Chicago Botanic Garden. In the lab, heads will be cleaned so that all achenes can be counted and x-rayed to determine seedset.
Measuring the reproductive success of an Echinacea angustifolia head gives insight into the fitness of the individual. In remnant populations, we measure reproductive success using two methods: style persistence and seedset. Seedset is the proportion of all seeds that are viable in an Echinacea head, and is measured in the lab after heads have been harvested. Style persistence is a fitness measure that can be taken during the field season. Styles, the showy female reproductive structures that emerge from every floret in an Echinacea head, shrivel within 24 hours if they receive compatible pollen. Keeping track of how many styles shrivel and how many persist can give us a sense of the reproductive success of that head without any lab work.
Year: 1996
Location: Roadsides, railroads and rights of way, and nature preserves in and near Solem Township, Minnesota.
Overlaps with: flowering phenology in remnants, mating compatability in remnants
Physical specimens: 121 harvested heads, currently at the Chicago Botanic Garden
Data collected:
- Style persistence data for each flowering head, collected three times per week, stored in remData
- Dates and identities of harvested heads, stored on paper datasheets entered electronically into richHood
GPS Points Shot: A point for each flowering head, stored under PHEN and SURV records in GeospatialDataBackup
Products:
You can find out more about reproductive fitness in the remnants and read previous flog posts about it on the background page for the experiment.
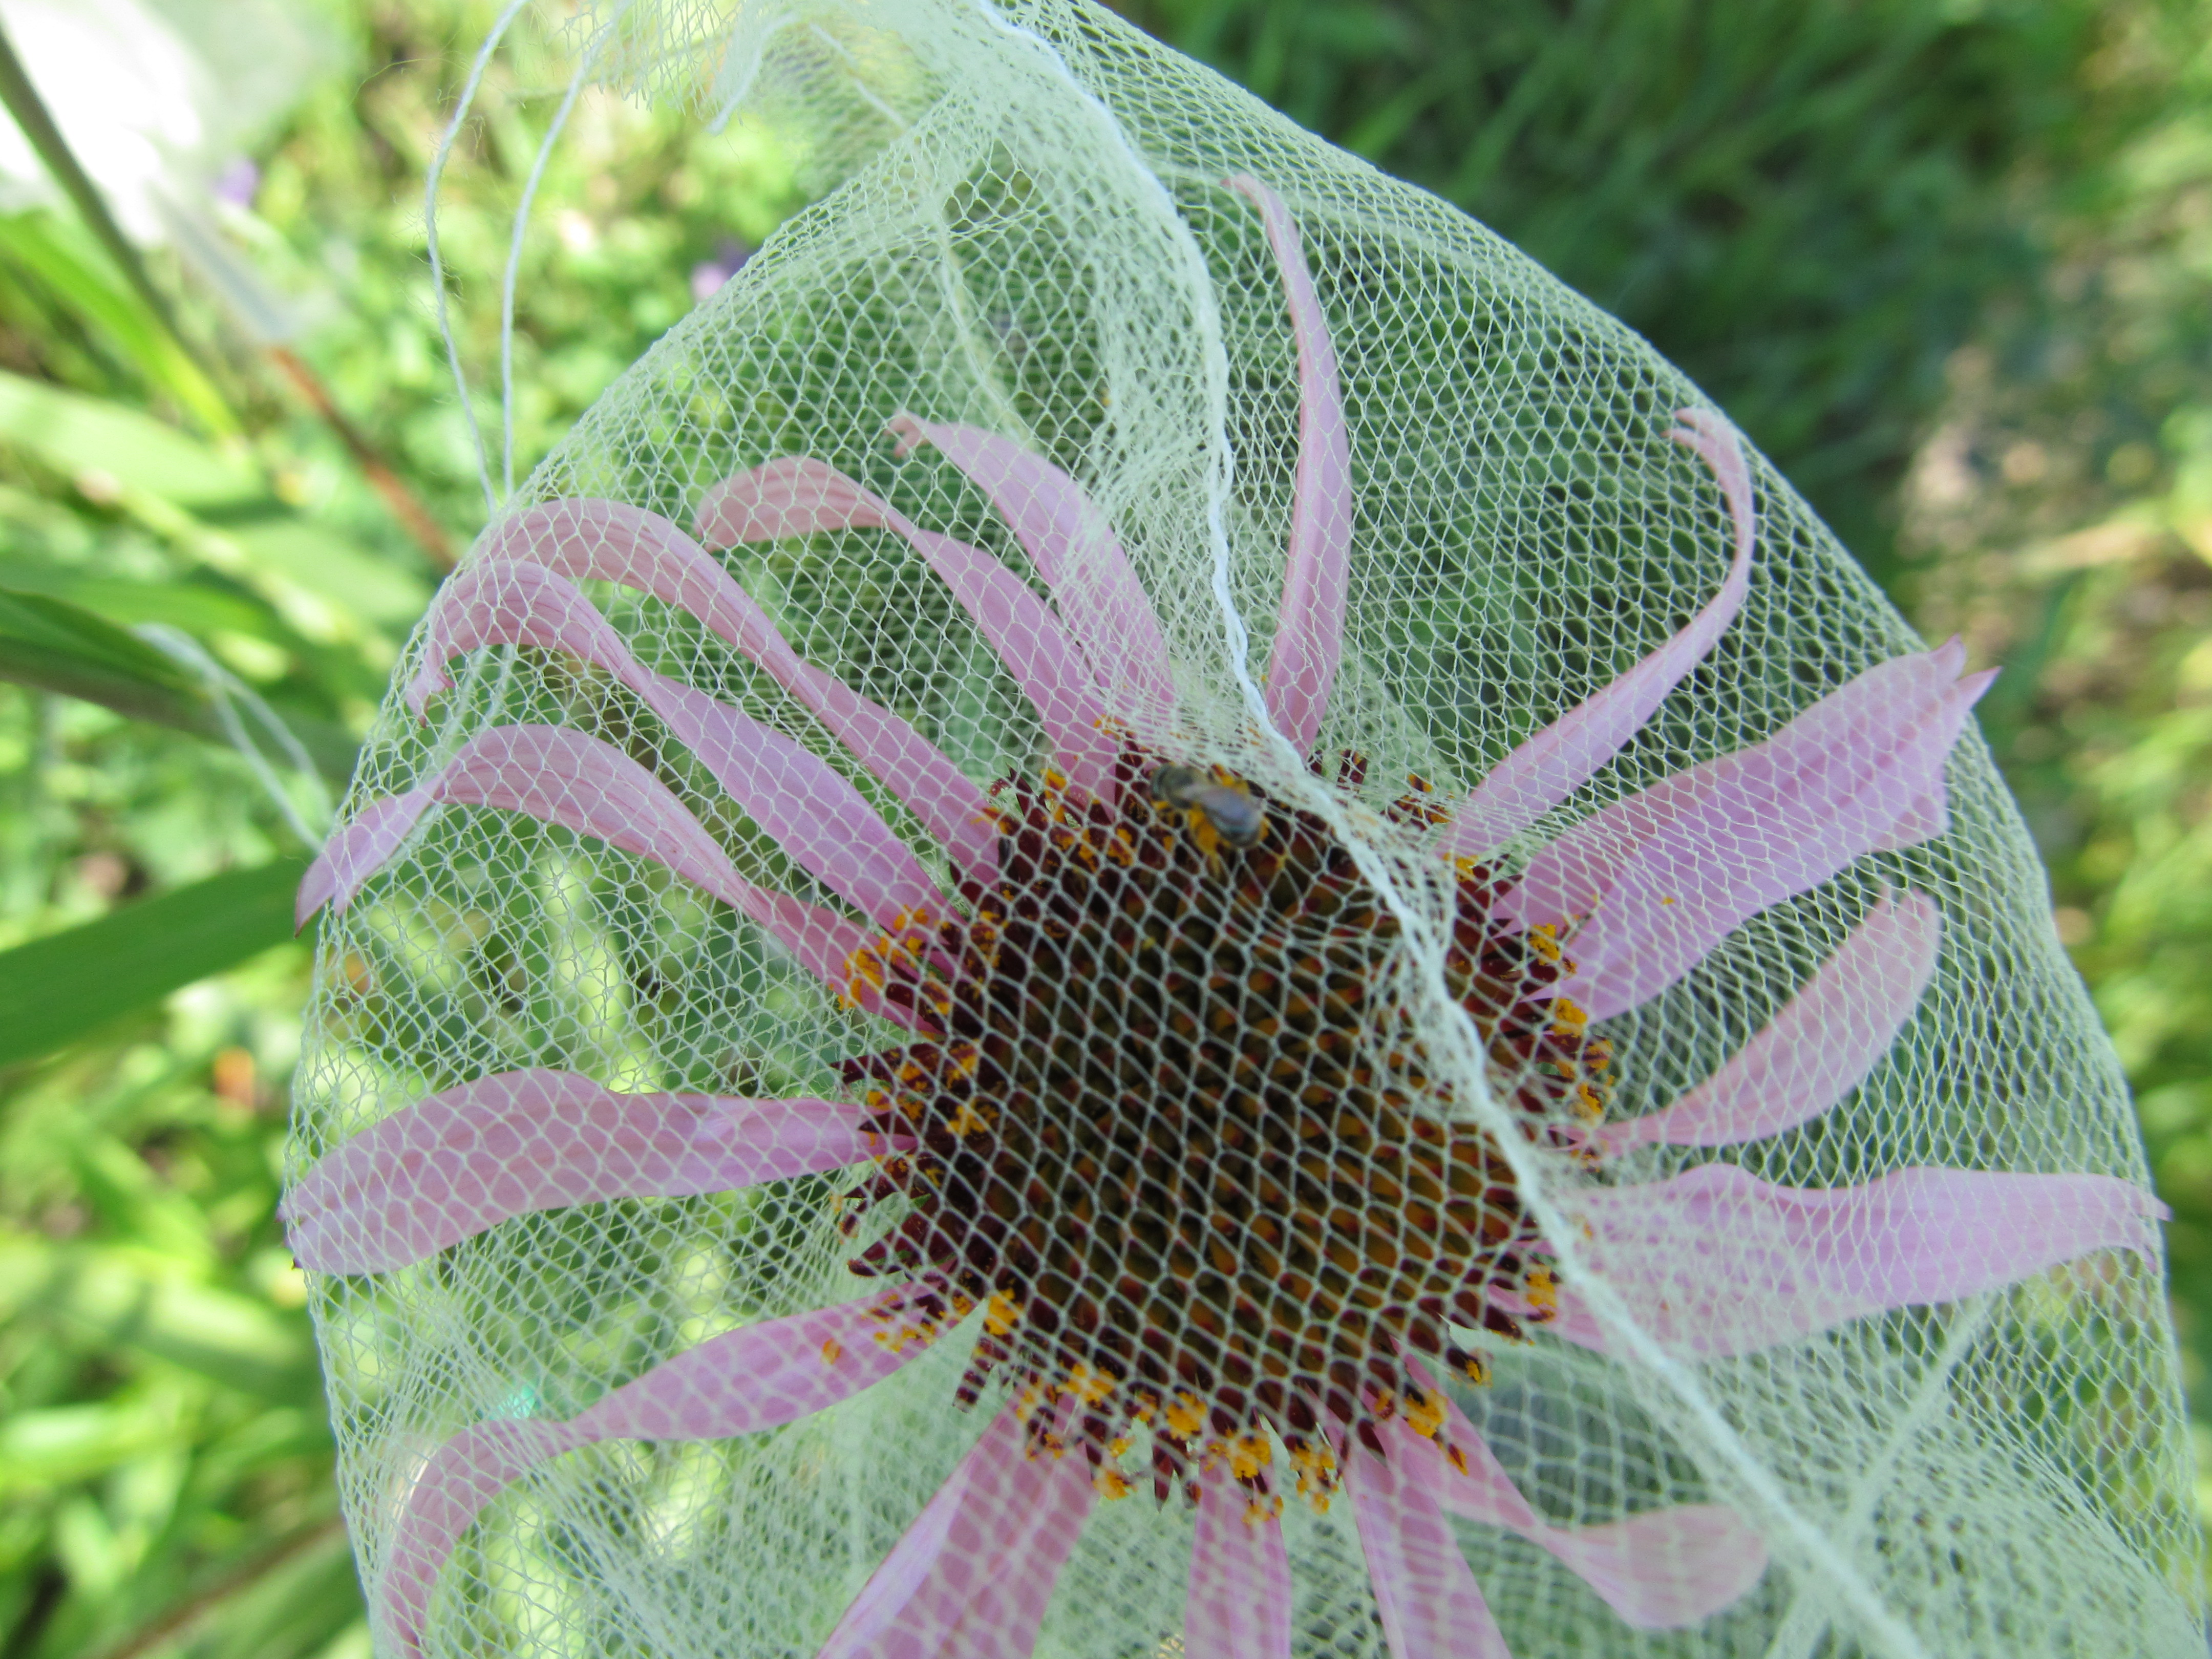
 Echinacea head with pollinator exclusion bag. Does receiving the maximum amount of pollination vs. no pollen at all affect a plant’s longevity or likelihood of flowering in subsequent years? We are trying to find out in this long-term experiment, but flowering rates have been so low in the past few years we are not learning much.
This summer, only three plants flowered of the 27 plants remaining in the pollen addition and exclusion experiment. We continued experimental treatments on these flowering plants and recorded fitness characteristics of all plants in the experiment. Of the original 38 plants in this experiment, 13 of the exclusion plants and 14 of the pollen addition plants are still alive.
In this experiment we assess the long-term effects of pollen addition and exclusion on plant fitness. In 2012 and 2013 we identified flowering E. angustifolia plants in experimental plot 1 and randomly assigned one of two treatments to each: pollen addition or pollen exclusion. When plants flower in subsequent years they receive the same treatment they were originally assigned. Because flowering rates have been so low in 2016 & 2017, differences in flowering due to treatment are not detectable.
Start year: 2012
Location: Experimental plot 1
Physical specimens: We harvested three flowering heads from this experiment that will be processed with the rest of the experimental plot 1 heads to determine achene count and proportion of full achenes.
Data collected: We recorded data electronically as part of the overall assessment of plant fitness in experimental plot 1. We recorded dates of bagging heads and pollen addition on paper datasheets.
You can find more information about the pollen addition and exclusion experiment and links to previous flog posts regarding this experiment at the background page for the experiment.
 Aphids on an Echinacea leaf This summer Team Echinacea continued adding and excluding aphids to plants in the experiment that Katherine Muller started. In 2011, Katherine Muller designated a sample of 100 Echinacea plants in experimental plot 1 for aphid addition or removal. The presence or absence of these aphids was maintained by team members once a week in the summer of 2017, for a total of 7 weeks from early July to mid August. We maintained addition on 31 plants and exclusion on 30, for a total of 61 plants. Will Reed set up a data entry system where we could enter data twice from the paper sheets and check for data-entry errors. In early October, Lea Richardson and Tracie Hayes recorded signs of senescence in the leaves of treatment plants. This data can be combined with data from our common garden measuring data to explore the richness of the Echinacea-aphid relationship.
Aphis echinaceae is a specialist aphid that is found only on Echinacea angustifolia. Read more about this experiment.
Start year: 2011
Location: Experimental Plot 1
Overlaps with: Phenology and fitness in P1
Data collected:
- Aphid counts for each treatment plant on each observation day, on paper
- Aphid counts recorded in csvs, on the teamEchinacea2017 dropbox
- Leaf senescence data, recorded on paper
- Initial and final assessment of aphid counts on treatment plants, recorded on paper
- Aphid counts also included in p1 measuring data
Products:
- 2016 paper by Katherine Muller and Stuart on aphids and foliar herbivory damage on Echinacea
- 2015 paper by Ruth Shaw and Stuart on fitness and demographic consequences of aphid loads
- 2015 poster by Daniel Brown and Kyle Silverhus (Lake Forest College) on achene and seed set differences on treatment plants
You can read more about the aphid addition and exclusion experiment, as well as links to prior flog entries mentioning the experiment, on the background page for this experiment.
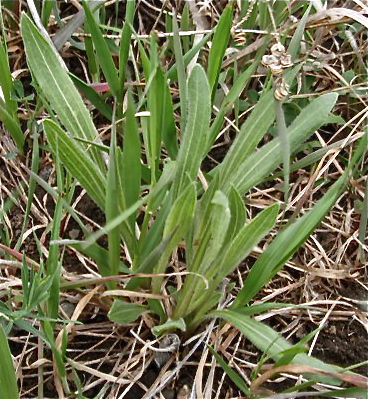
This year we monitored the original 28 C. hillii rosettes at Hegg Lake WMA to check the fitness and persistence of our original individuals/population. Presently, 10/28 rosettes remain, all as non-flowering basal rosettes. For each rosette, we measured the length of the longest axis and the corresponding perpendicular axis. No burns were conducted this year.
This experiment assesses effects of fire on the fitness of Cirsium hillii (Hill’s thistle) plants at Hegg Lake WMA. Like Echinacea, C. hillii inhabits dry prairies, but Hill’s thistle is listed as a Species of Special Concern in Minnesota and little is known about how it responds to fire. Burn and non-burn units were created prior to an experimental fall burn conducted by the Department of Natural Resources (DNR) in 2014. That year, we mapped 28 C. hillii rosettes (basal and flowering).
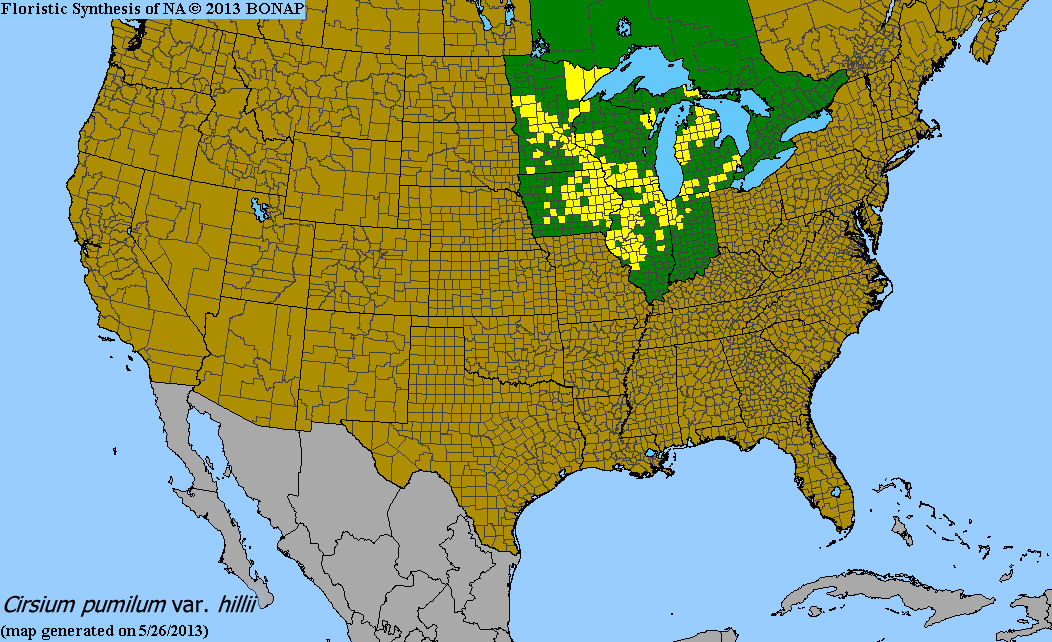
 The distribution of Cirsium hillii, a rare endemic to the Great Lakes region. Last year was also a non-burn year, although of rosettes found, there were three flowering rosettes. It’s challenging to determine cases of mortality with this species, since C. hillii is clonal, and it’s possible that each rosette is not a unique individual.
In 2015, Abbey White found that there was only one or two individuals in our C. hillii “population!” We don’t know of any other C. hillii populations in Douglas County. We are possibly monitoring the last individual in the area.
You can find out more about Cirsium hillii fire & fitness and read previous flog posts about it on the experiment background page.
 We observed that 95% surviving members of the 1996 cohort were basal in 2016 Does receiving the maximum amount of pollination vs. no pollen at all affect a plant’s longevity or likelihood of flowering in subsequent years? In this experiment we assess the long-term effects of pollen addition and exclusion on plant fitness. In 2012 and 2013 we identified flowering E. angustifolia plants in experimental plot 1 and randomly assigned one of two treatments to each: pollen addition or pollen exclusion. When plants flower in subsequent years they receive the same treatment they were originally assigned.
Across all experiments, 2016 was a low flowering year. Only four plants flowered of the 29 plants remaining in the pollen addition and exclusion experiment. We continued experimental treatments on these plants and recorded fitness characteristics.
Start year: 2012
Location: Experimental plot 1
Physical specimens: We harvested four flowering heads from this experiment that will be processed with the rest of the experimental plot 1 heads to determine achene count and proportion of full achenes. The labels for these heads, beginning with the letter “p,” identify them as part of the pollen addition and exclusion experiment.
Data collected: We recorded data electronically as part of the overall assessment of plant fitness in experimental plot 1. We recorded dates of bagging heads and pollen addition on paper datasheets.
You can find more information about the pollen addition and exclusion experiment and links to previous flog posts regarding this experiment at the background page for the experiment.
|
|