Here’s the final dataset for my compatibility experiment. The experiment is officially ended today (I collected the last bit of data). The dataset contains GPS data (column name distBetween). I missed one plant while GPS-ing, so I used the hand-measured data (for flag #6 at Nessman’s). I also corrected several errors in the datasheet.
Data for Analysis — cswitzer — 31 July 2011.csv
We spent some time GPS-ing the plants, so we could get the exact distances between them. Here is a csv file with the gps data.
I have been working on analyzing all my data. I looked at plots of each of my individual sties, as well as all the data combined. The data are almost exactly opposite of what I expected.
Here’s the script I’ve been exploring:
callinCompatRScript31july2011.R
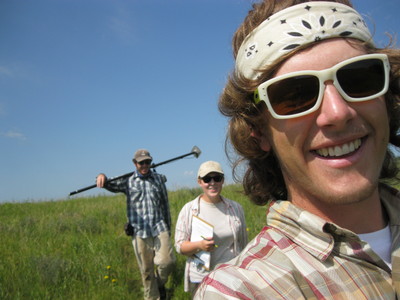
Here’s a picture of Josh, Amber Z, and I out in the field (having a lot of fun).


Leave a Reply