
For his REU research project, Will is investigating heritability of flowering phenology in experimental plot 2 (p2), which was planted in 2006 with 3961 individuals selected for extreme (early or late) flowering phenology. This summer Will and Team Echinacea monitored the phenology of all 646 flowering plants (1216 individual heads) in p2, as well as the phenology of their parents in p1. Flowering in p2 began on the 4th of July and ended on August 26th. The peak day of flowering was July 27th when 1018 heads were flowering. The average duration of flowering for a head was 12.1 days. It was a huge year for flowering in p2 with nearly 5 times more heads than 2014 and over 16 times more than 2013. Will is comparing the flowering schedules of the p2 plants with the 2005 phenology records of their parents. As the plants in p2 mature, and perhaps flower more frequently, we will continue to gather data on family lines of Echinacea to discern the genetic component of their flowering phenology.
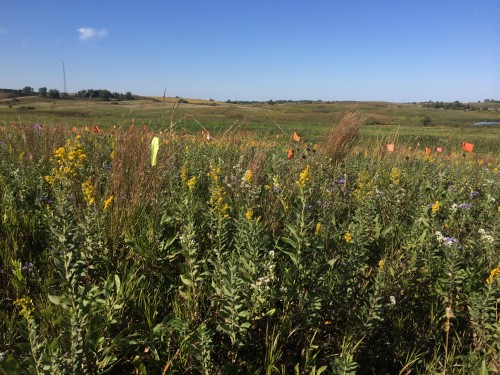
Many flags indicate many flowering plants in experimental plot 2
Start year: 2006
Location: Experimental plot 2 (Hegg Lake WMA)
Overlaps with: phenology in experimental plots
Products: The 2015 phenology records from p2 will be added to the existing multi-year ExPt2 phenology dataset. Will is using tools from the R package echPhenology developed by Team Echinacea to analyze and produce visualizations of the flowering schedule observed in p2. He plans to present his findings at a conference in spring or summer 2016.
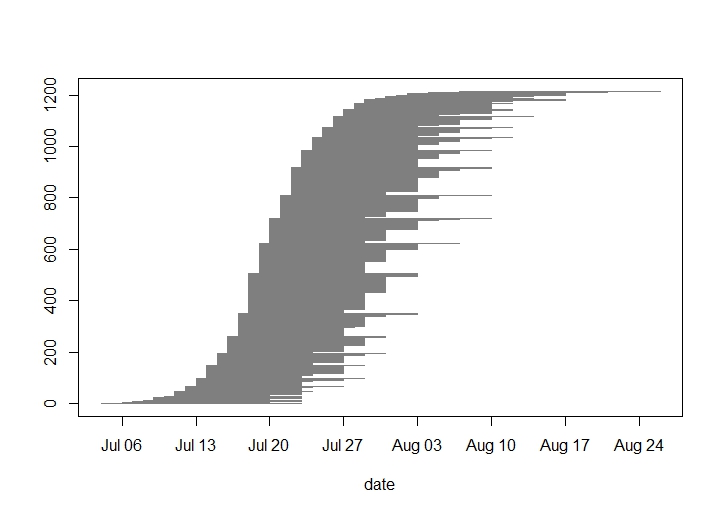
2015 flowering schedule of all heads in p2: First day of flowering was July 4th, peak was July 27th, and the last day was August 26th.
Read previous posts about this experiment.