
Hello flog!
Unfortunately for all you T-Swift fans out there, I will not actually be devoting much of this blog to her… Instead, I am going to talk about the fascinating world of R, a statistical analysis coding program that allows you to organize and graph your data.
Since my time at the garden is coming to an end this week, I have begun to learn how to analyze my data within R. R can be a little complicated because often times even a Blank Space can mess up an entire line of code. However, with lots of help (like lots, from R genius Michael) I was able to organize and even plot some of my results! An important lesson- if your code doesn’t work the first time, Shake It Off and try again!
For my project, I am aiming to create two different graphs, a series of histograms and soil texture triangles. A histogram will show the amount of sand, silt, and clay within each of the 8 sites. Then to understand the texture differences, a soil triangle will plot the percentages of sand, silt, and clay in what type of soil they correlate to. For example, 45% sand, 40% silt, and 10% clay might fall at the bottom of the triangle in the sandy loam portion. Who knows maybe I’ll have Fifteen graphs by Friday!
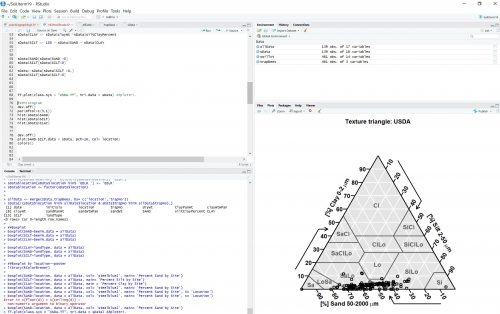
A preview of my graphs!
Even though R can be a pretty Delicate program, it is extremely helpful! But being able to efficiently code has always been one of my Wildest Dreams. So, for now, there’s no Bad Blood between R and myself.
T-Swift out, till next time!
Leave a Reply