
Every year we keep track of flowering phenology in our main experimental plots, exPt1 and exPt2. Fewer plants than usual flowered in exPt1 in 2016: 149 plants (179 heads) flowered between June 24th and August 7th. The population’s mean start date of flowering was July 5th and the mean end date was July 18th. Peak flowering in 2016 was on July 10th, when 143 heads were in flower. For comparison, peak flowering in 2015 was on July 27th, when there were nearly 10x as many heads flowering as on this year’s peak. The earlier phenology and low numbers of flowering we observed this year relative to 2015 is likely due at least in part to the plot burn schedule (2015 was a burn year and 2016 was a non-burn year), but there were still many fewer flowering plants than any season, burn or non-burn, in the past 10 years.
We kept track of 934 flowering heads in ExPt2, where the first head started shedding pollen on June 22 and the latest bloomer ended flowering on August 8th. Peak flowering was on July 7th, when 810 heads were flowering. ExPt2 was designed to study the heritability of phenology—you can read more about progress of that experiment in the upcoming 2016 heritability of phenology project status update.
At the end of the season we harvested the heads and brought them back to the lab, where we will count fruits (achenes) and assess seed set.
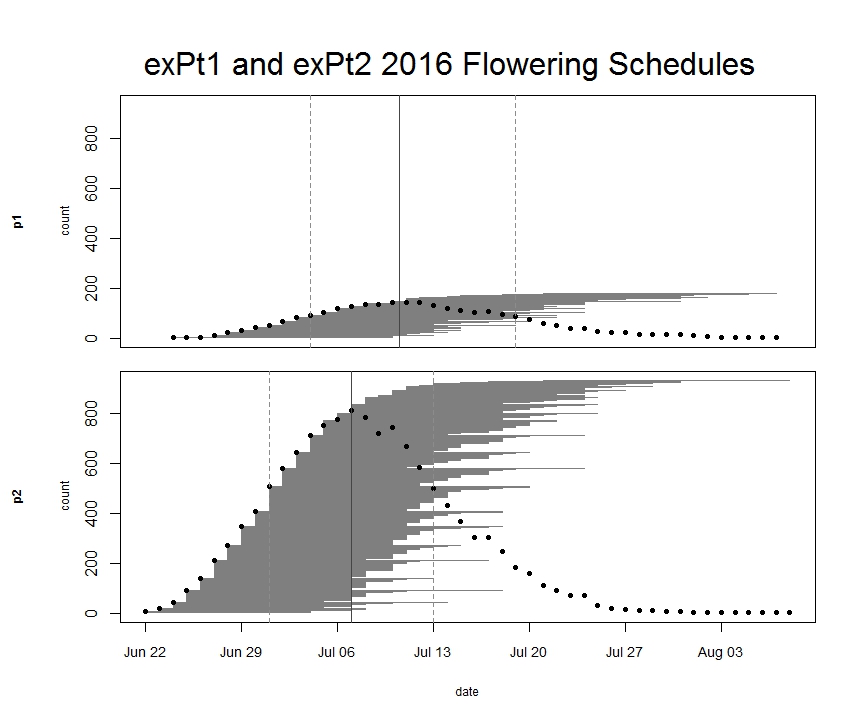
ExPt1 and Expt2 flowering schedules from 2016. Dots represent the number of flowering heads on each date. Horizontal line segments represent the duration of each heads flowering and are ordered by start date. The solid vertical line indicates peak flowering, while the dashed lines indicate the dates when 25% and 75% of heads had begun flowering, respectively. Click to enlarge!
Start year: 2005
Location: Experimental Plots 1 and 2
Overlaps with: Heritability of flowering time, common garden experiment, phenology in the remnants
Physical specimens: We harvested 177 heads from exPt1 and 870 from exPt2. Attentive readers may note that we harvested about 64 fewer heads than we tracked for phenology. That’s because before we could harvest many seedheads at exPt2, rodents chewed through their stems and ate some fruits (achenes). We recovered most of the heads that were grazed from the ground and made estimates of number of fruits lost due to herbivory, but we couldn’t find some heads. Arg. We brought the harvest back to the lab, where we will count fruits and assess seed set.
Data collected: We visit all plants with flowering heads every three days until they are done flowering to record start and end dates of flowering for all heads. We managed phenology data in R and added it to the full dataset. The figure above was generated using package mateable in R. If you want to make figures like this one, download package mateable from CRAN!
You can find more information about phenology in experimental plots and links to previous flog posts regarding this experiment at the background page for the experiment.
Leave a Reply