
One of the large tasks that the team does every year is measure the first experimental plot (p1). This is the largest of the the experimental plots with a daunting 10,673 total positions. The plot is broken up into 46 rows, some of these rows are so long that we have broken them up into segments. There are 141 total segments.
I will be posting daily (or close to daily) updates on our measuring progress right here on the flog. Yesturday (Aug 03 2021) was our first day of measuring p1. We start with one of the inbreeding experiments, the team measured a total of 18 segments over the course of 3 ish hours with 4 measuring pairs.
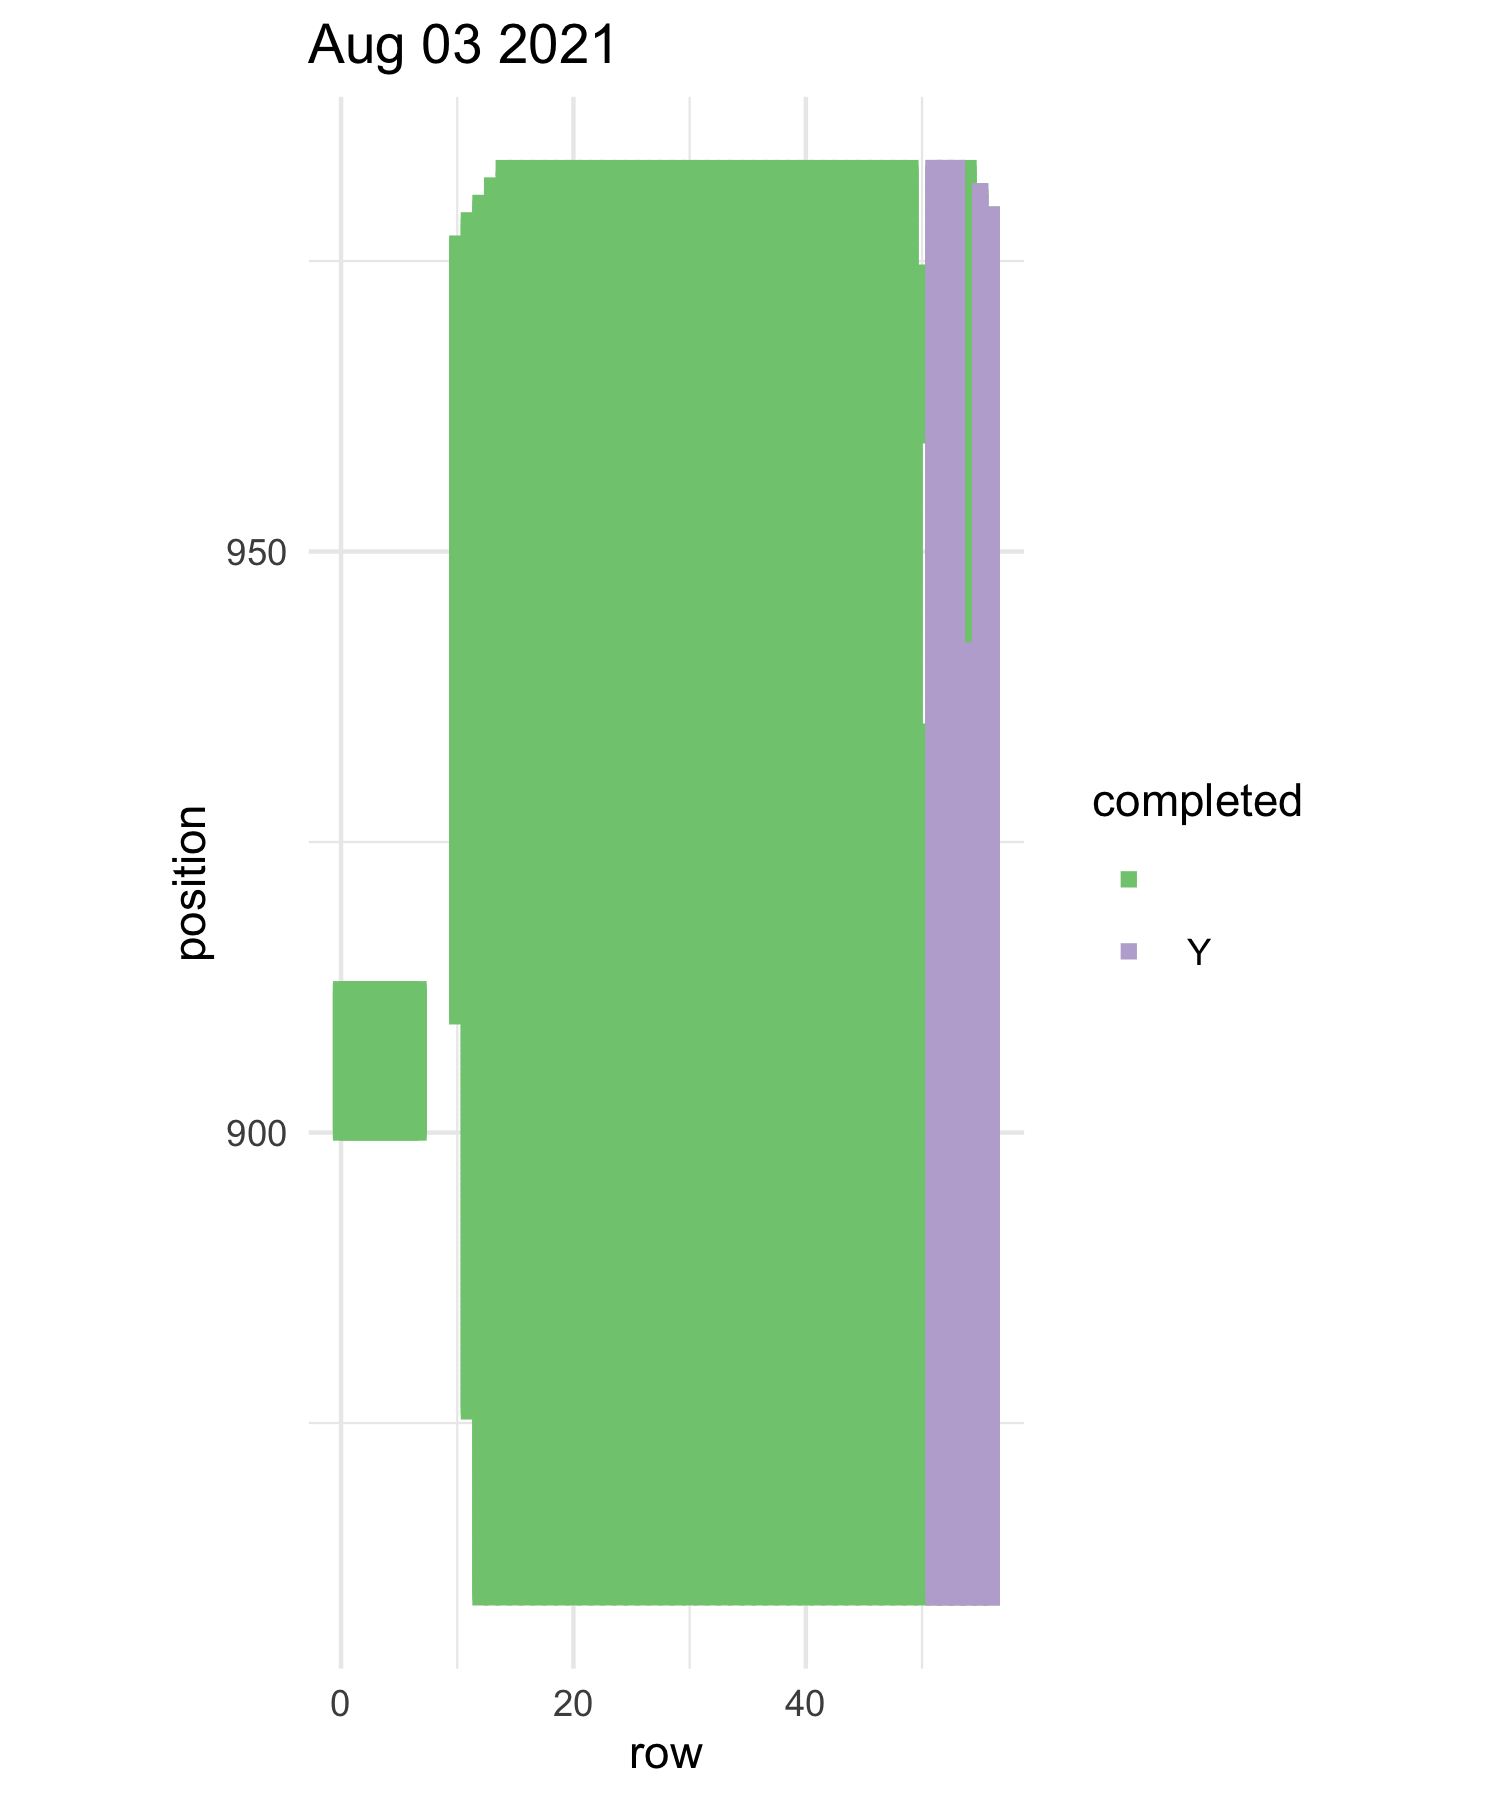
Below I have attached a map of the plot, it is colored with which positions have been measured and what we have yet to do. There is a lot left to do but we have made GREAT progress for just one day!

lavender is completed records green is what we have left. positions go N-S rows are W-e
Leave a Reply