
Hey! Trevor here! Today, Nina and I continued our work on the R platform, aggregating data and creating figures to be included in our final reports, which (spoiler alert!), will be available on the Flog starting Friday! So if you’re interested in checking out our work, feel free to look at those to get a sense of our projects.
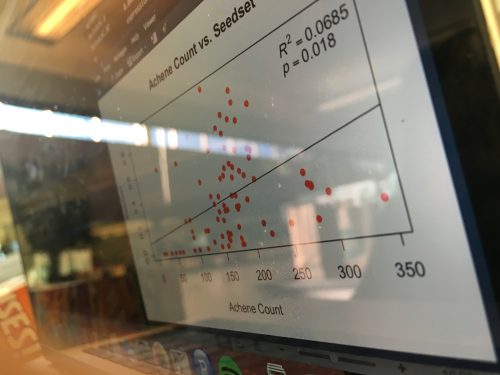 Nina calculated the percent of invasive species for each of her plots using data from the United States Department of Agriculture (USDA) website. She used these percentages to create various graphs to attempt to predict the success of echinacea based on the number of invasive species. However, she found that this was not an effective way of predicting echinacea success. Aside from these quantitative activities, Nina also worked on “beautifying” her graphs, which includes adding R-squared and p values. Look at the red graph to the left, isn’t it beautiful?!
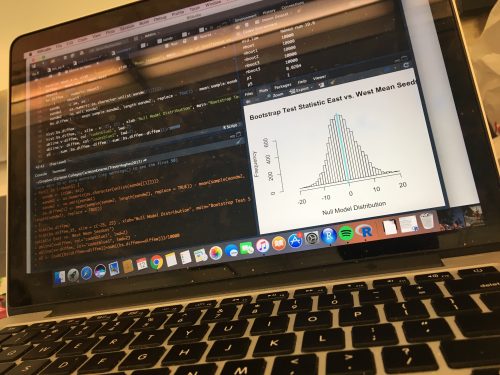
I finished up my work on the top/middle/bottom data and progressed onto the seed counts and cleaning data from the Liatris and Solidago species, which meant that I learned how to merge two different “csv” files together; a challenge, but a challenge I accepted. Afterwards, I worked through some obstacles to effectively calculate the mean seed-set for the East and West sides for the Staffenson site. East had a higher mean seed set at 0.34, compared to west’s 0.20. In the realm of ecology, that’s a big difference! Currently, I am working on calculating the p value for these findings; it’s a process.
Nina and I hope to finish up working in R tomorrow (we’re almost there!) and begin writing our papers.
Until next time,
Trevor 🙂
Leave a Reply