
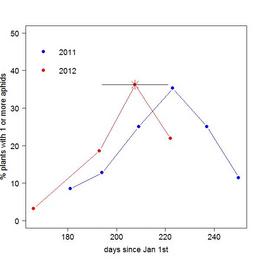
During the summers of 2011 and 2012, I conducted a survey of aphid infestation in a section of the main experimental plot to track, among other things, seasonal changes in the distribution and abundance of Aphis echinaceae on Echinacea. With help from members of team Echinacea, I conducted 6 bi-weekly surveys in 2011 and 3 monthly surveys in 2012. In both years there was a sharp rise and fall in the frequency of aphid infestation. The plot below shows the percentage of plants in the survey area observed to have 1 or more aphids on each dates. In 2011, the peak of aphid infestation (i.e. when the highest percentage of plants hosted aphids) was around August 12th. In 2012, the peak date of aphid infestation occurred some time between July 13th and August 9th. I was not able to observe the peak directly due to a sudden die-off of aphids before my third survey. I estimated the peak frequency of aphids as the percentage of plants with live or dead aphids on August 10th (indicated by the asterix and x-error bar).
I was also able to get a sense of aphid phenology from my aphid addition/exclusion experiment. In 2011 and 2012, I added or excluded aphids from 100 plants that were not flowering in 2011. The graph below shows the mean abundance of aphids in each experimental group over the summer of 2012:
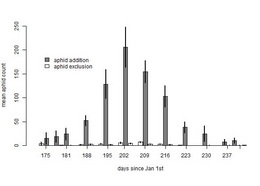
Based on this graph, I estimate that the peak of aphid infestation for 2012 occurred around July 22nd (202 days after January 1st), about two weeks before last year’s peak.
Leave a Reply