
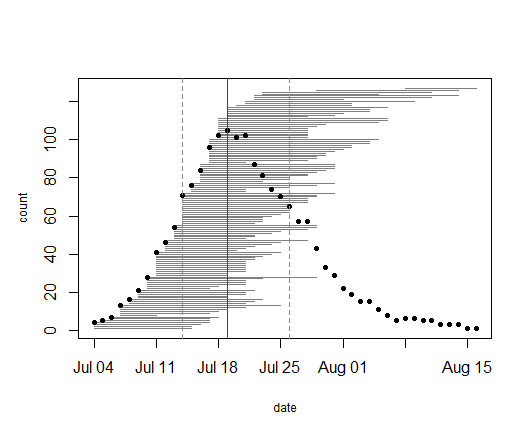
In 2019, we collected data on the timing of flowering for 95 flowering plants (127 flowering heads) in 8 remnant populations, which ranged from 1 to 29 flowering heads. The earliest bloomers (four plants at four different remnants) initiated flowering on July 4. Plant 24050 in the aptly named remnant population North of Northwest of Landfill was the latest bloomer, shedding its last anthers of pollen on August 16. Township mowers had mowed over this plant earlier in the season, which is perhaps why it took longer for it to sprout a new flowering stem. Altogether, the flowering season was 43 days long. Peak flowering was on July 19, when 105 heads were flowering.
This season marked the 19th season of collecting phenology records in remnant populations! Though we do not have data for all populations every year, Stuart monitored phenology in all of our remnant populations in 1996 and in following years (2007, 2009, 2011-2019) students and interns studied phenology in particular populations. From 2014-2016, determining flowering phenology was a major focus of the summer fieldwork, with Team Echinacea tracking phenology in all plants in all of our remnant populations. The motivation behind this study is to understand how timing of flowering affects the mating patterns and fitness of individuals in natural populations.
Flowering occurred much later this season than previous years, with peak flowering falling a full 14 days later in the year than 2018, when flowering started on June 20, and 10 days later than 2017. Of all the years that we data for flowering phenology in the remnant populations in and around Solem Township, this season was the second-latest, with only the 2013 season beginning later, on July 6. However, this observation comes with the caveat that sampling effort varied between years and some years focused on particular contexts, such as population where a portion had experienced a spring burn (see Fire and Flowering at SPP). Many other plants and animals in Minnesota seemed to have delayed phenology this spring and summer, perhaps a result of an unusually wet and snowy spring.
Start year: 1996
Location: Roadsides, railroad rights of way, and nature preserves in and around Solem Township, MN
Overlaps with: phenology in experimental plots, demography in the remnants, gene flow in remnants, reproductive fitness in remnants
Data/materials collected: We identify each plant with a numbered tag affixed to the base and give each head a colored twist tie, so that each head has a unique tag/twist-tie combination, or “head ID”, under which we store all phenology data.We monitor the flowering status of all flowering plants in the remnants, visiting at least once every three days (usually every two days) until all heads were done flowering to obtain start and end dates of flowering. We managed the data in the R project ‘aiisummer2019′ and added the records to the database of previous years’ remnant phenology records, which is located here: https://echinaceaproject.org/datasets/remnant-phen/.
We shot GPS points at all of the plants we monitored. Soon, we will align the locations of plants this year with previously recorded locations and given a unique identifier (‘AKA’). We will link this year’s phenology and survey records via the headID to AKA table.
We harvested a random sample of 1/3 of the flowering heads from each remnants in August and September, plus an X additional heads from populations that were highly isolated, for a total of X harvested seedheads. These are currently stored at the University of Minnesota. This winter, I will assess the relationship between phenology and reproductive fitness by x-raying all of the seeds we collected. In addition, I will determine the paternity (i.e., pollen source) for a sample of seeds by matching the seed genotype to the potential pollen donors. Doing so will shed light on how phenology influences pollen movement and gene flow patterns.
You can find more information about phenology in the remnants and links to previous flog posts regarding this experiment at the background page for the experiment.
Products: I presented a poster based on the locations and flowering phenology of individuals from summer 2018 at the International Pollinator Conference in Davis, CA this summer. The poster is linked here: https://echinaceaproject.org/international-pollinator-conference/.
Leave a Reply