
In 2020, we collected data on the timing of flowering for 855 flowering plants (1071 flowering heads) in 31 remnant populations. The plants ranged from having 1 to 8 flowering heads. The earliest bloomers initiated flowering on June 22nd . Plant 22195 at NWLF was the latest bloomer, only beginning to shed pollen on September 14th, nearly a month after the second-latest flowering plant had ceased producing pollen (August 18th). As is typical for the latest bloomer of a season, township mowers had mowed over this plant earlier in the season, which is perhaps why it took longer for it to sprout a new flowering stem. Peak flowering was on July 9th, when 886 heads were flowering.
A major part of the motivation behind this year’s effort in monitoring phenology was to collect baseline data on flowering rates and timing. Team Echinacea recently received funding to perform prescribed burns in these populations. Next summer, we will compare flowering patterns in populations before and after fires to understand how burns drive the effects of timing of flowering on mating patterns and fitness of individuals in natural populations.
Start year: 1996
Location: Roadsides, railroad rights of way, and nature preserves in and around Solem Township, MN
Overlaps with: phenology in experimental plots, demography in the remnants, gene flow in remnants, reproductive fitness in remnants
Data/materials collected: We identify each plant with a numbered tag affixed to the base and give each head a colored twist tie, so that each head has a unique tag/twist-tie combination, or “head ID”, under which we store all phenology data.We monitor the flowering status of all flowering plants in the remnants, visiting at least once every three days (usually every two days) until all heads were done flowering to obtain start and end dates of flowering. We managed the data in the R project ‘aiisummer2020′ and will add the records to the database of previous years’ remnant phenology records, which is located here: https://echinaceaproject.org/datasets/remnant-phen/. The dataset is ready to be updated, but I don’t believe it has been at the time of writing.
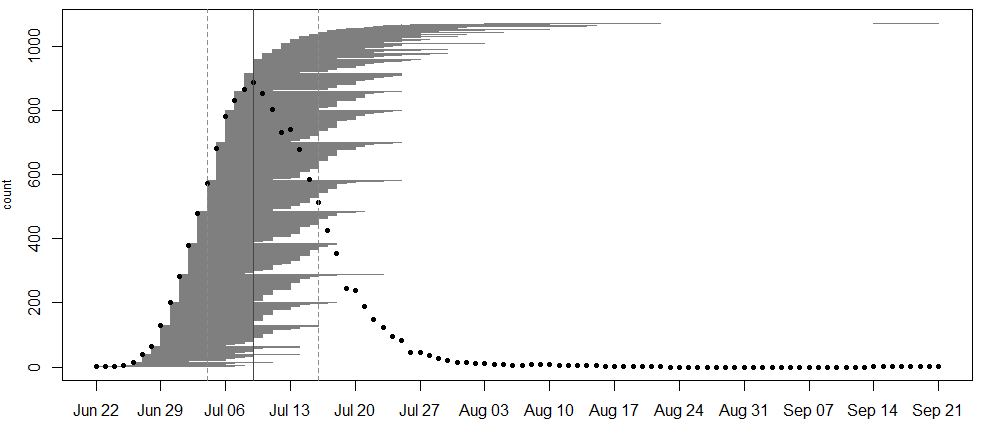
A flowering curve (created here using the R package mateable) summarizes the flowering phenology data that we collected in 2020, indicating the number of individuals flowering on a given day and the flowering period for all individuals over the course of the season.
We shot GPS points at all of the plants we monitored. Soon, we will align the locations of plants this year with previously recorded locations and given a unique identifier (‘AKA’). We will link this year’s phenology and survey records via the headID to AKA table.
You can find more information about phenology in the remnants and links to previous flog posts regarding this experiment at the background page for the experiment.
Products: A dataset of flowering phenology is ready to be posted on the website. It is currently located in Dropbox\remData\105_assessPhenology\phenology2020\phen2020_out and is available upon request. The headIds in this dataset have not yet been merged with the akas (long-term identifiers) in the demography dataset.
Leave a Reply