Friday was a fun day in the lab! After the morning lab
meeting, where Erin presented her study proposal on quantifying the correlation
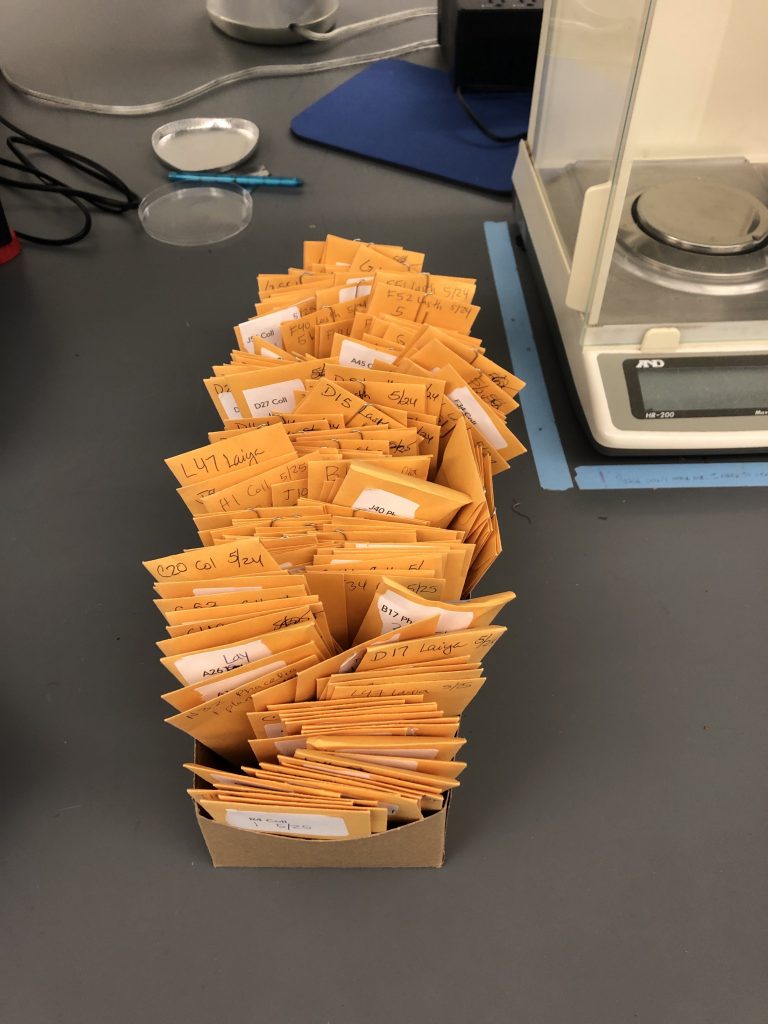
between Echinacea spatial isolation and flowering intervals, I continued weighing
biomass samples. I was able to get through about half the Day 3 samples and I
am hopeful I will be able to finish the rest by November 14th.
Half of the Day 3 samples
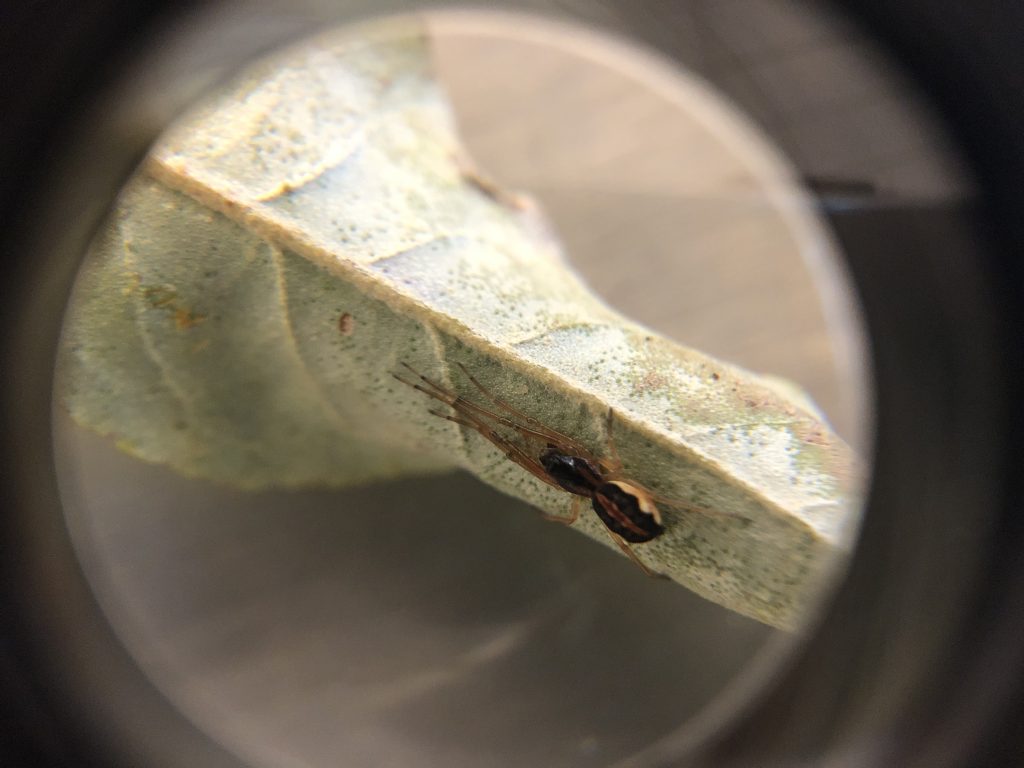
I brought a few friends along to the lab today from Goose Lake Prairie down in Morris, IL. A small spider I found nuzzled in a Grey Dogwood branch and a rather sizable praying mantis who was picking fights with cars in the parking lot. The mantis was a bit slow in the morning which made her easy to handle. The spider was also very cooperative even allowing itself to be put under a microscope. At this level of detail, one can see the spider’s heart beat in its abdomen. Fun fact spiders do not have a classical circulatory system but rather a heart that pumps haemolymph into sinus surrounding its internal organs. After thoroughly examining both specimen I released them back into the wild so each could go back to living their lives having learned a valuable lesson about hairless apes and glass jars.
Prairie SpiderSpider heartbeatReleased to hunt birds and mug garden patrons
The seasons have finally
begun to shift here at the Garden with the last heat waves of summer breaking
onto crisp October shores. Friday morning, I continued my working weighing
biomass, adding 88 new samples to the data set. There are still many samples to
be weighed but I believe I have now passed the halfway point.
Friday morning’s samples weighed and entered
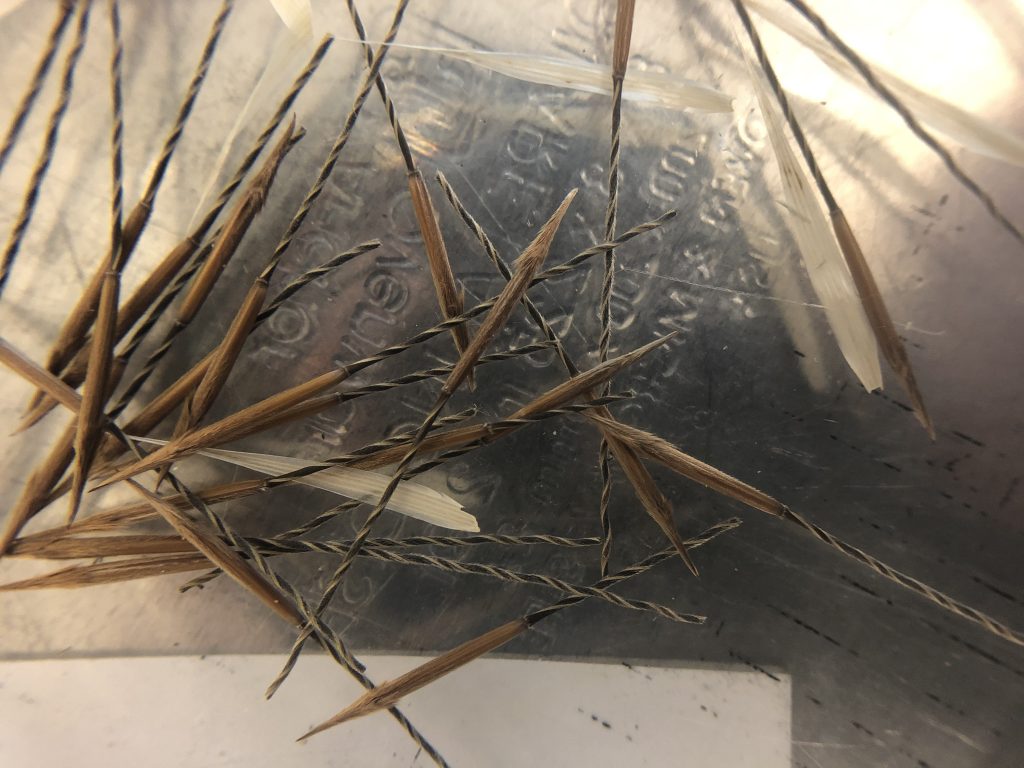
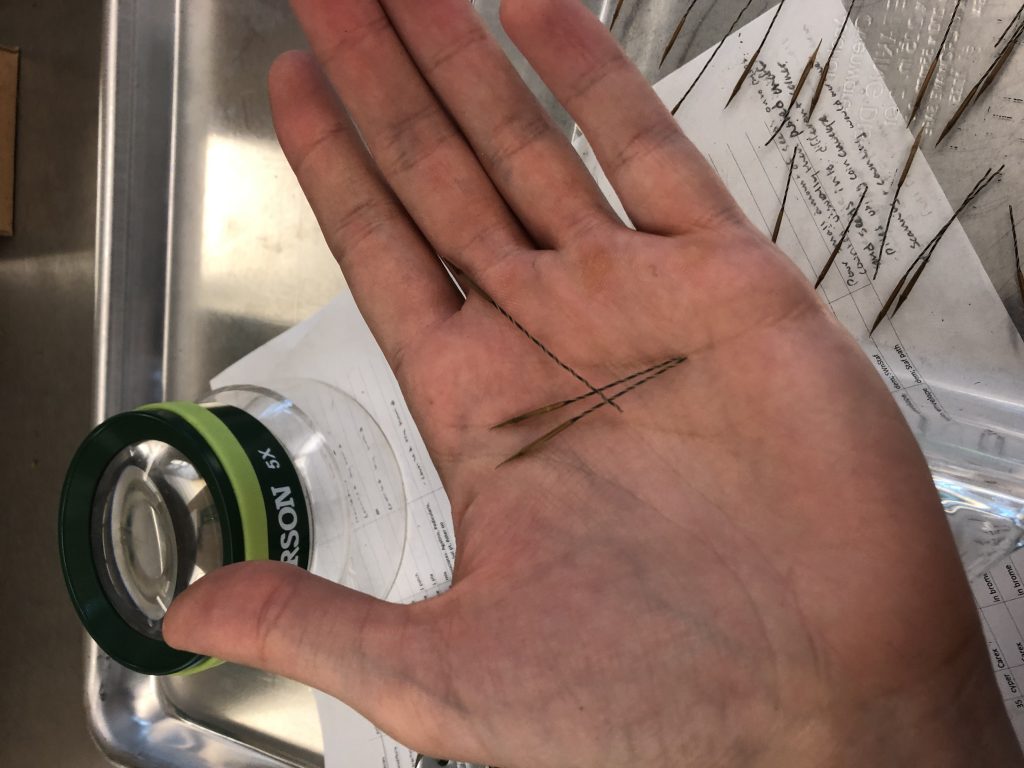
In the afternoon I returned to counting seeds. Stuart explained that the seeds I was counting were no ordinary seeds, but in fact ones that were very rare and difficult to collect, and that my counts would play a pivotal role in determining whether they were to be preserved or propagated. I felt proud that I was contributing to prairie conservation in such a direct and meaningful way. It was also fascinating to see firsthand the multitude of designs and strategies plants have for seed dispersal!
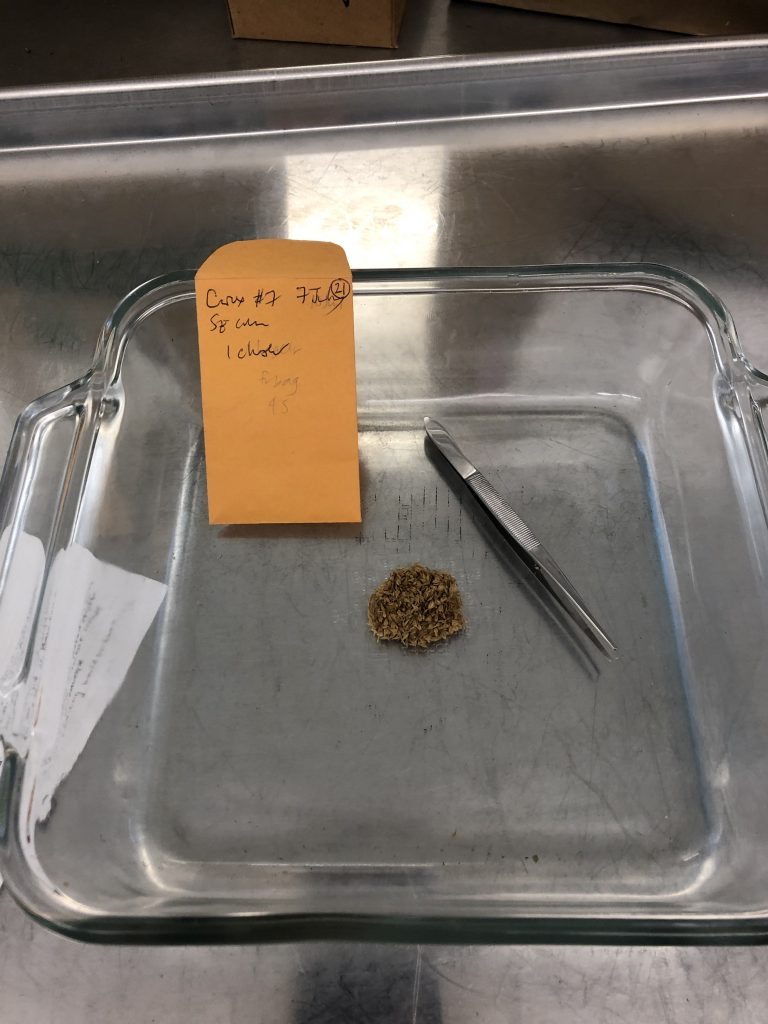
Hesperostipa spartea seeds (the spiral ends twist at different rates depending on humidity)Hesperostipa spartea seeds + hand for scaleLooks can be deceiving, there are close to 880 Carex seeds in this small pile!
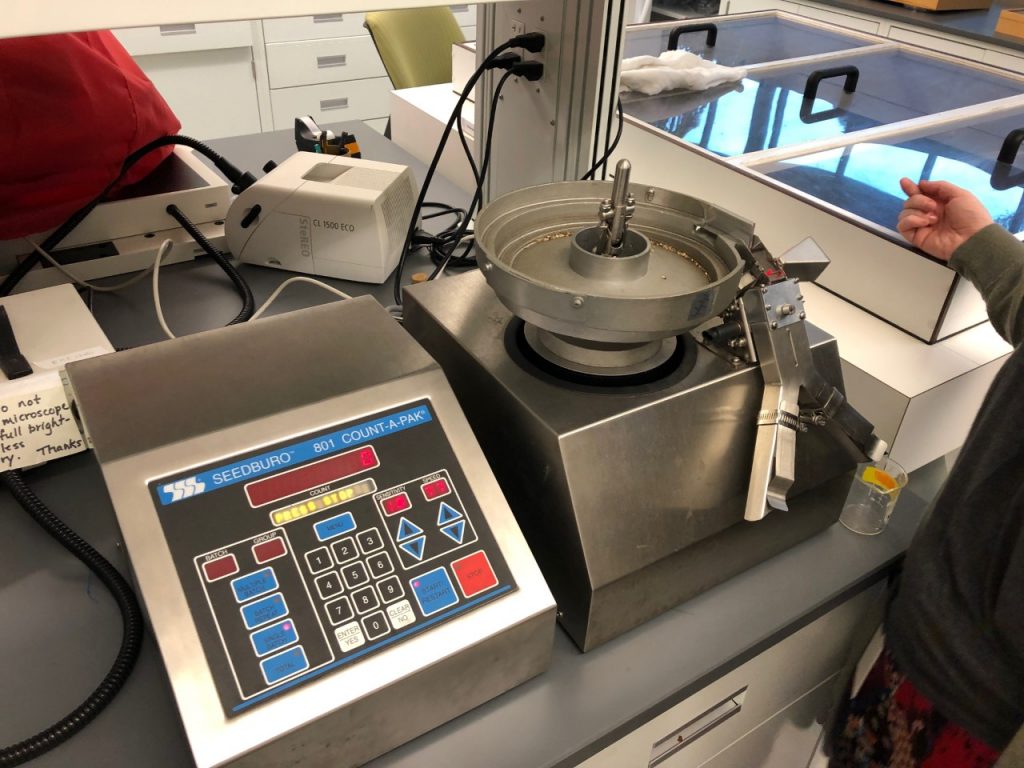
Today I was challenged to count seeds from a few different species of plants. The intention behind this assignment I believe was to teach me how to utilize the Lab’s SeedBuro™ 801 Count-A-Pak® using a variety of seed types. However, the seed-counter had other plans, absolutely refusing to count in spite of our sweet pleads and gentle coaxing. Without the mechanized aid of the SeedBuro™ I was forced to improvise. First, in classic American fashion, I tried brute force, emptying each pack into a Pyrex dish and counting every seed by hand. This worked well for the first few packs of 50-60 seeds but I soon found myself overwhelmed as the seeds began to number into the hundreds. For the large seed packets, I decided to deduce a count by dividing the total mass by that of a single seed mass (SSM). I found the SSM by taking 5 random samples of 10 seeds from the packet in question, weighing them, and averaging those masses. I then divided that average by ten which gave me my SSM. Finally, I took the total seed mass and divided it by the SSM which gave me a seed count. This procedure allowed to me to count a 2,390 Carex seed sample in just a few minutes.
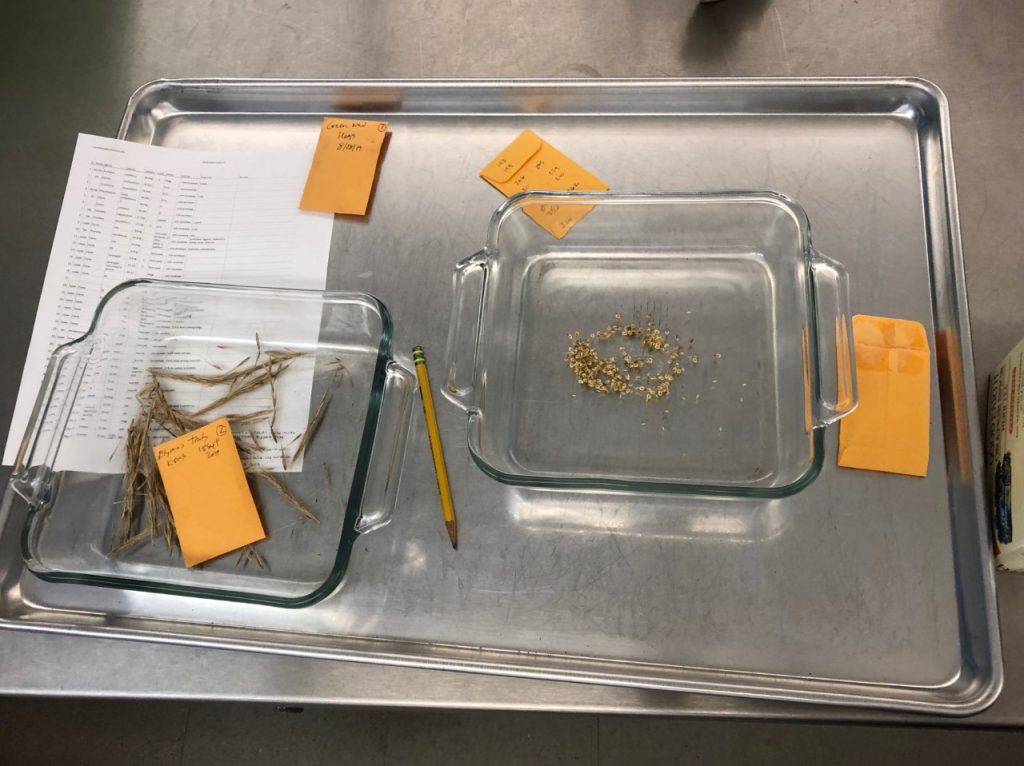
Seeds from two different plant families (Poaeceae on the left and Cyperaceae on the right) to be countedThe seed counter adamant that there are no seeds in the tray
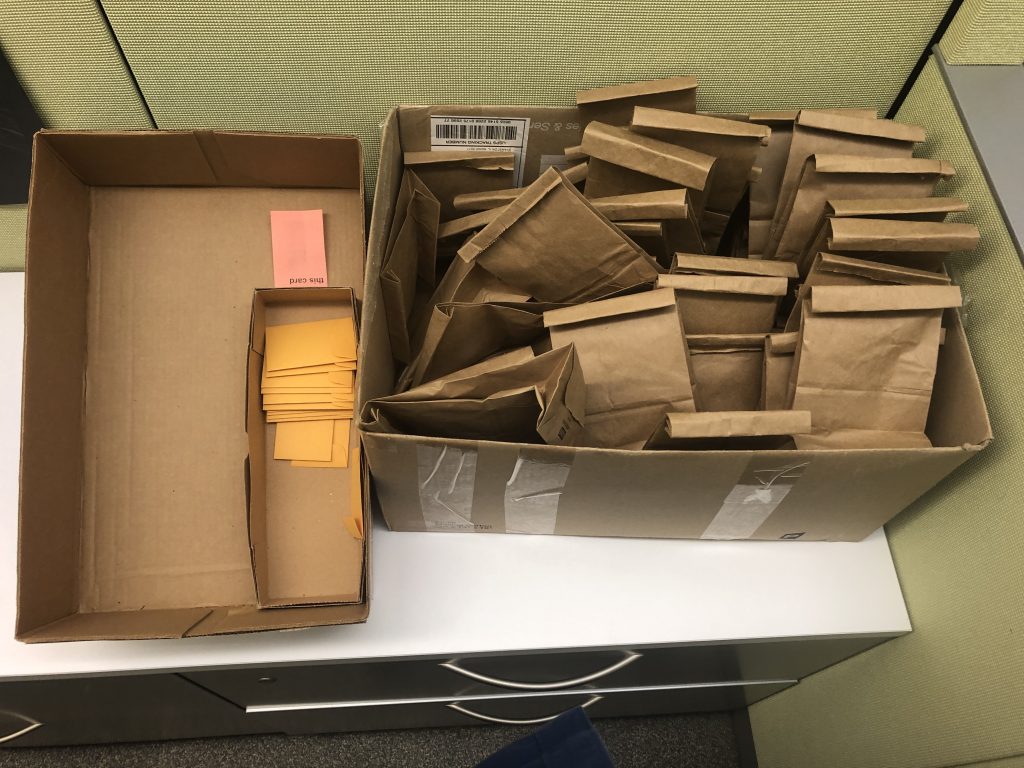
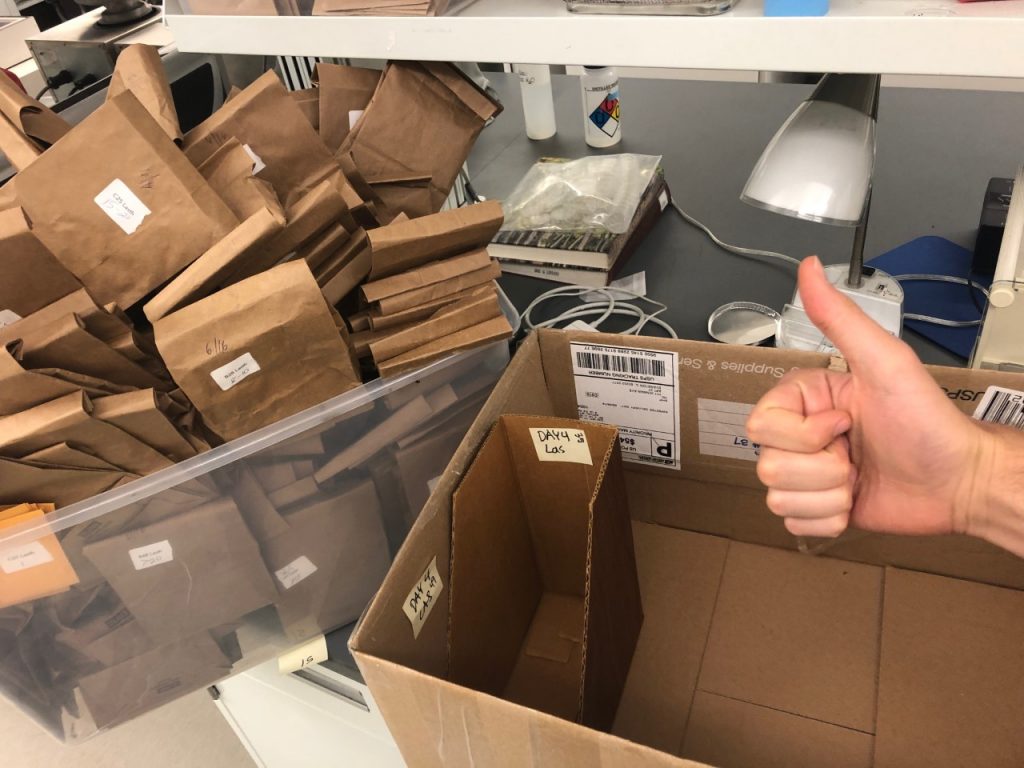
After an afternoon of seed counting I returned to work weighing biomass and finally completed weighing the contents of the second Day 4 cardboard box. I have now collected the biomass data from over 420 plants. I am very excited to begin learning how best to process and analyze all this data!
The clear tub is filled with all the newly weighed samples from the box on the right.
It was a quiet and productive day
the Lab save for a few interruptions from our fine arachnid colleagues, who are
lately becoming rather bold. This afternoon Lea introduced me to ImageJ, a free
and opensource image processing software developed by the NIH. To study how spacing
effects reproductive success Lea took photographs of her stunt ranch plots 9
times between April 17 and June 16 2019. These photographs will be analyzed with
ImageJ to identify flower species and location within each of the plot and
eventually the processed data will be combined to create a large spatial data
map. At least that’s the goal, right now we are more in a building expertise
phase. Having made little headway this afternoon, I plan to continue tinkering
with the software on my own and hopefully have a working analysis macro in a few
weeks. Additionally, I continue to add entries to the biomass dataset which I
hope will help provide a deeper insight into plants reproductive success.
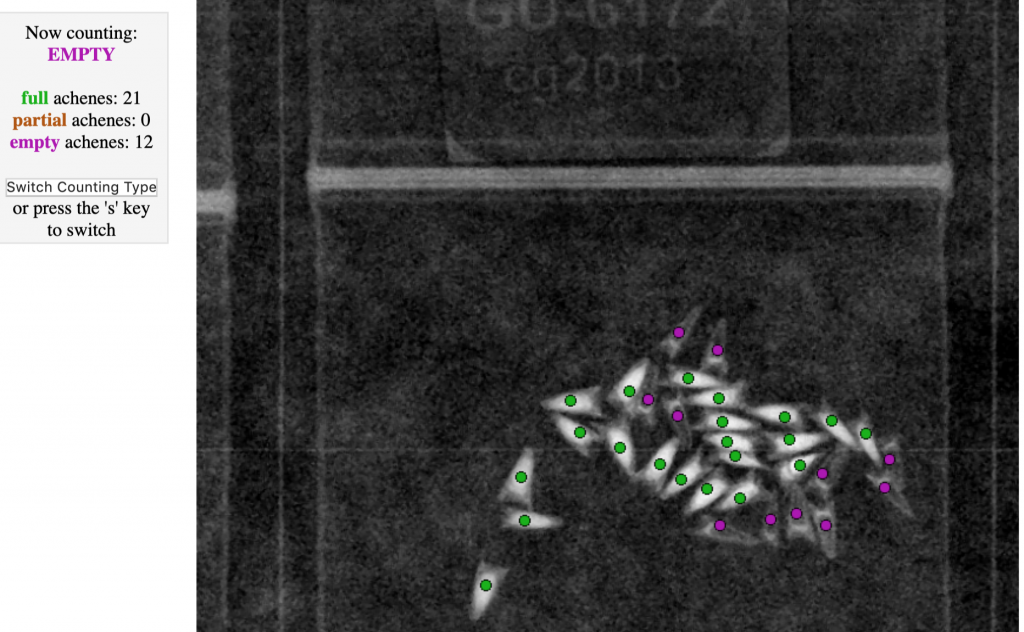
This morning Priti and I learned how to use the computer to count scanned achenes. I found counting to be a much smoother process than cleaning and, in a couple of hours, had counted over 5,000 achenes. An average Echinacea head produces about 150 achenes. The number of achenes a head produces is a pretty good indicator of what is called “reproductive effort”, the energy expended in the pursuit of reproduction. Sadly, a harsh reality of life is that reproductive effort doesn’t always translate into reproductive success. A much better predictor of fitness is seed set or achene viability, however this is difficult to find without splitting open every single achene. However here at the Echinacea Project they have quite the clever work around, X-Rays! Each sample of achenes are randomized and those fruits that make it through are collected into sheets of 20 samples and doused with low, completely safe levels of white-hot X-radiation. The X-ray images are fed into a computer program which allows researchers (like me!) to see inside and classify them by the fullness of their embryo (Empty, Full, or Partial). This provides a stronger indicator for the fitness of the individual plant. The coming week I am excited to learn more about what affects Echinacea seed set or reproductive success.
Maybe the fittest plants are those who avoid collection
It has been an exciting and busy two
weeks here in the Lab. I have been weighing the collected biomass of four species
of California wildflowers (Lasthenia californica, Layia platyglossa, Collinsia
heterophylla, and Phacelia tanacetifolia) to assess their reproductive fitness.
A poster (https://www.youtube.com/watch?v=oRo2z_u-9EE) completed this past summer by Keyzamar Román found that, at least for Lasthenia,
fruit production is highest in heads produced early in the growing season where
seed set is highest later in the growing season. I am curious to discover if
the biomass follows a similar trend or whether it remains consistent after the
plant has reached maturity. I hope to have a complete data set soon and, in
that effort, I have since increased my samples per hour weighed from a rookie
15 to a meaty 25.
My name is David Zimmerman and I am a new Echinacea Project intern for Fall of 2019. I am a student at the College of DuPage, where I also work as a tutor concentrating on introductory Biology. Never having worked in a lab before, I am very excited to learn how plant and population biology research is conducted and for the opportunity to translate what I learn into a research project. I am very thankful for this opportunity and looking forward to working with you all in the future!
A little more about me:
My interest in prairie ecology was sparked relatively recently after a series of injuries sidelined me from my job as a musician. To help the healing process I began to take daily walks through the Schulenberg Prairie. As winter melted into spring I observed the landscape change with new growth pushing up through snow and debris. Curious, I bought a field guide to identify all the new plant life that now accompanied me on my walks. The more species I identified the more that appeared and as the prairie reached it full height in late summer I marveled at how such a rich ecosystem could seemingly appear from nowhere and how little I really knew about the world around me. This realization has propelled me in my study of Biology and Ecology and I am thrilled to continue my educational journey this fall at the Echinacea Project.