
The team has dwindled, and so has our progress on p1 this last month… With other priorities such as demo/surv and e-traps wrapping up in the next couple weeks, hopefully we can get back to it!
|
||||
|
The team has dwindled, and so has our progress on p1 this last month… With other priorities such as demo/surv and e-traps wrapping up in the next couple weeks, hopefully we can get back to it! Members of Team Echinacea do a good job while measuring. Members of Team Echinacea are also humans (mostly, I think). We make mistakes! Maybe we searched for a plant that is there, but we couldn’t find it. Or maybe we had missteps while recording data. That’s why an essential part of our work each summer is identifying errors and inconsistencies in our database and then revisiting these in the field to check our work, as well as searching again for any plants we marked as can’t finds. Thanks to the ghost of interns past, there is quite a bit of framework and functions that already exist to handle this work. It’s also a bit of a hodgepodge to keep track of, especially when you don’t have last year’s cg intern to show you around (we miss you Lindsey!) Here, I am documenting my personal journey in figuring out the who what when where why and hows of this process. I’ll continue updating this as I learn more. Step 1: preRaw -> raw The first step in the process is to take the data from the visors, which we call “preRaw” and turn it into a “raw” state that we can more easily work with. This is mostly a quality control step that a) formats the data how we like it and b) identifies and eliminates any carriage return issues that would be a source of head scratching down the line. We do this step in a single script, but in separate steps for exPt08, exPt10, and then the rest of the plots as one. The same goes for the head data. Ideally, we would put in the work to combine all plots into one. Unfortunately there is a labor shortage, shall we say. 2024 script: ~cgData/summer2024/measureRaw/makeRawMeasure.R Step 2: raw -> good Next, we put the data through some more formatting tweaks. We also create a column called “recQ” (record quality) and tentatively mark every record we have as “good”. Any record with this field marked as “good” will be included in measureGood/plantAll_2024.txt and measureGood/headAll_2024.txt. Even prior to fixing errors, these can be useful in other processes, like setting up harvest. 2024 scripts:
Step 3: making “good” actually good That’s just the trick, isn’t it? There are a number of ways we go about getting good records. For some records, the mistake is obvious and easy to fix in R. When this is the case, you make the change in the offending column(s) directly in “pp” or “hh”, the plant and head measure data frames, respectively. If it’s as simple as updating plant status to basal, only the plant status field needs to be update and the recQ field remains set to good. If the entire record is bad, you can modify recQ to be something other than “good” to keep the record from being included in plantAll or headAll (e.g., “dup record”). Other times, we have to revisit the location in the field. When this is the case, we identify the issue and change recQ from “good” to a descriptive note about the issue. For example, any issue that I feel is worthy of a revisit in the field, I make sure to change the recQ to “revisit; xxx” with “xxx” being a brief note about the issue. The hh df is special in that it also has an “auditNote” column, where you can add additional notes about any issues. I’m not sure why this is exclusive to the head data. Some ways we identify issues:
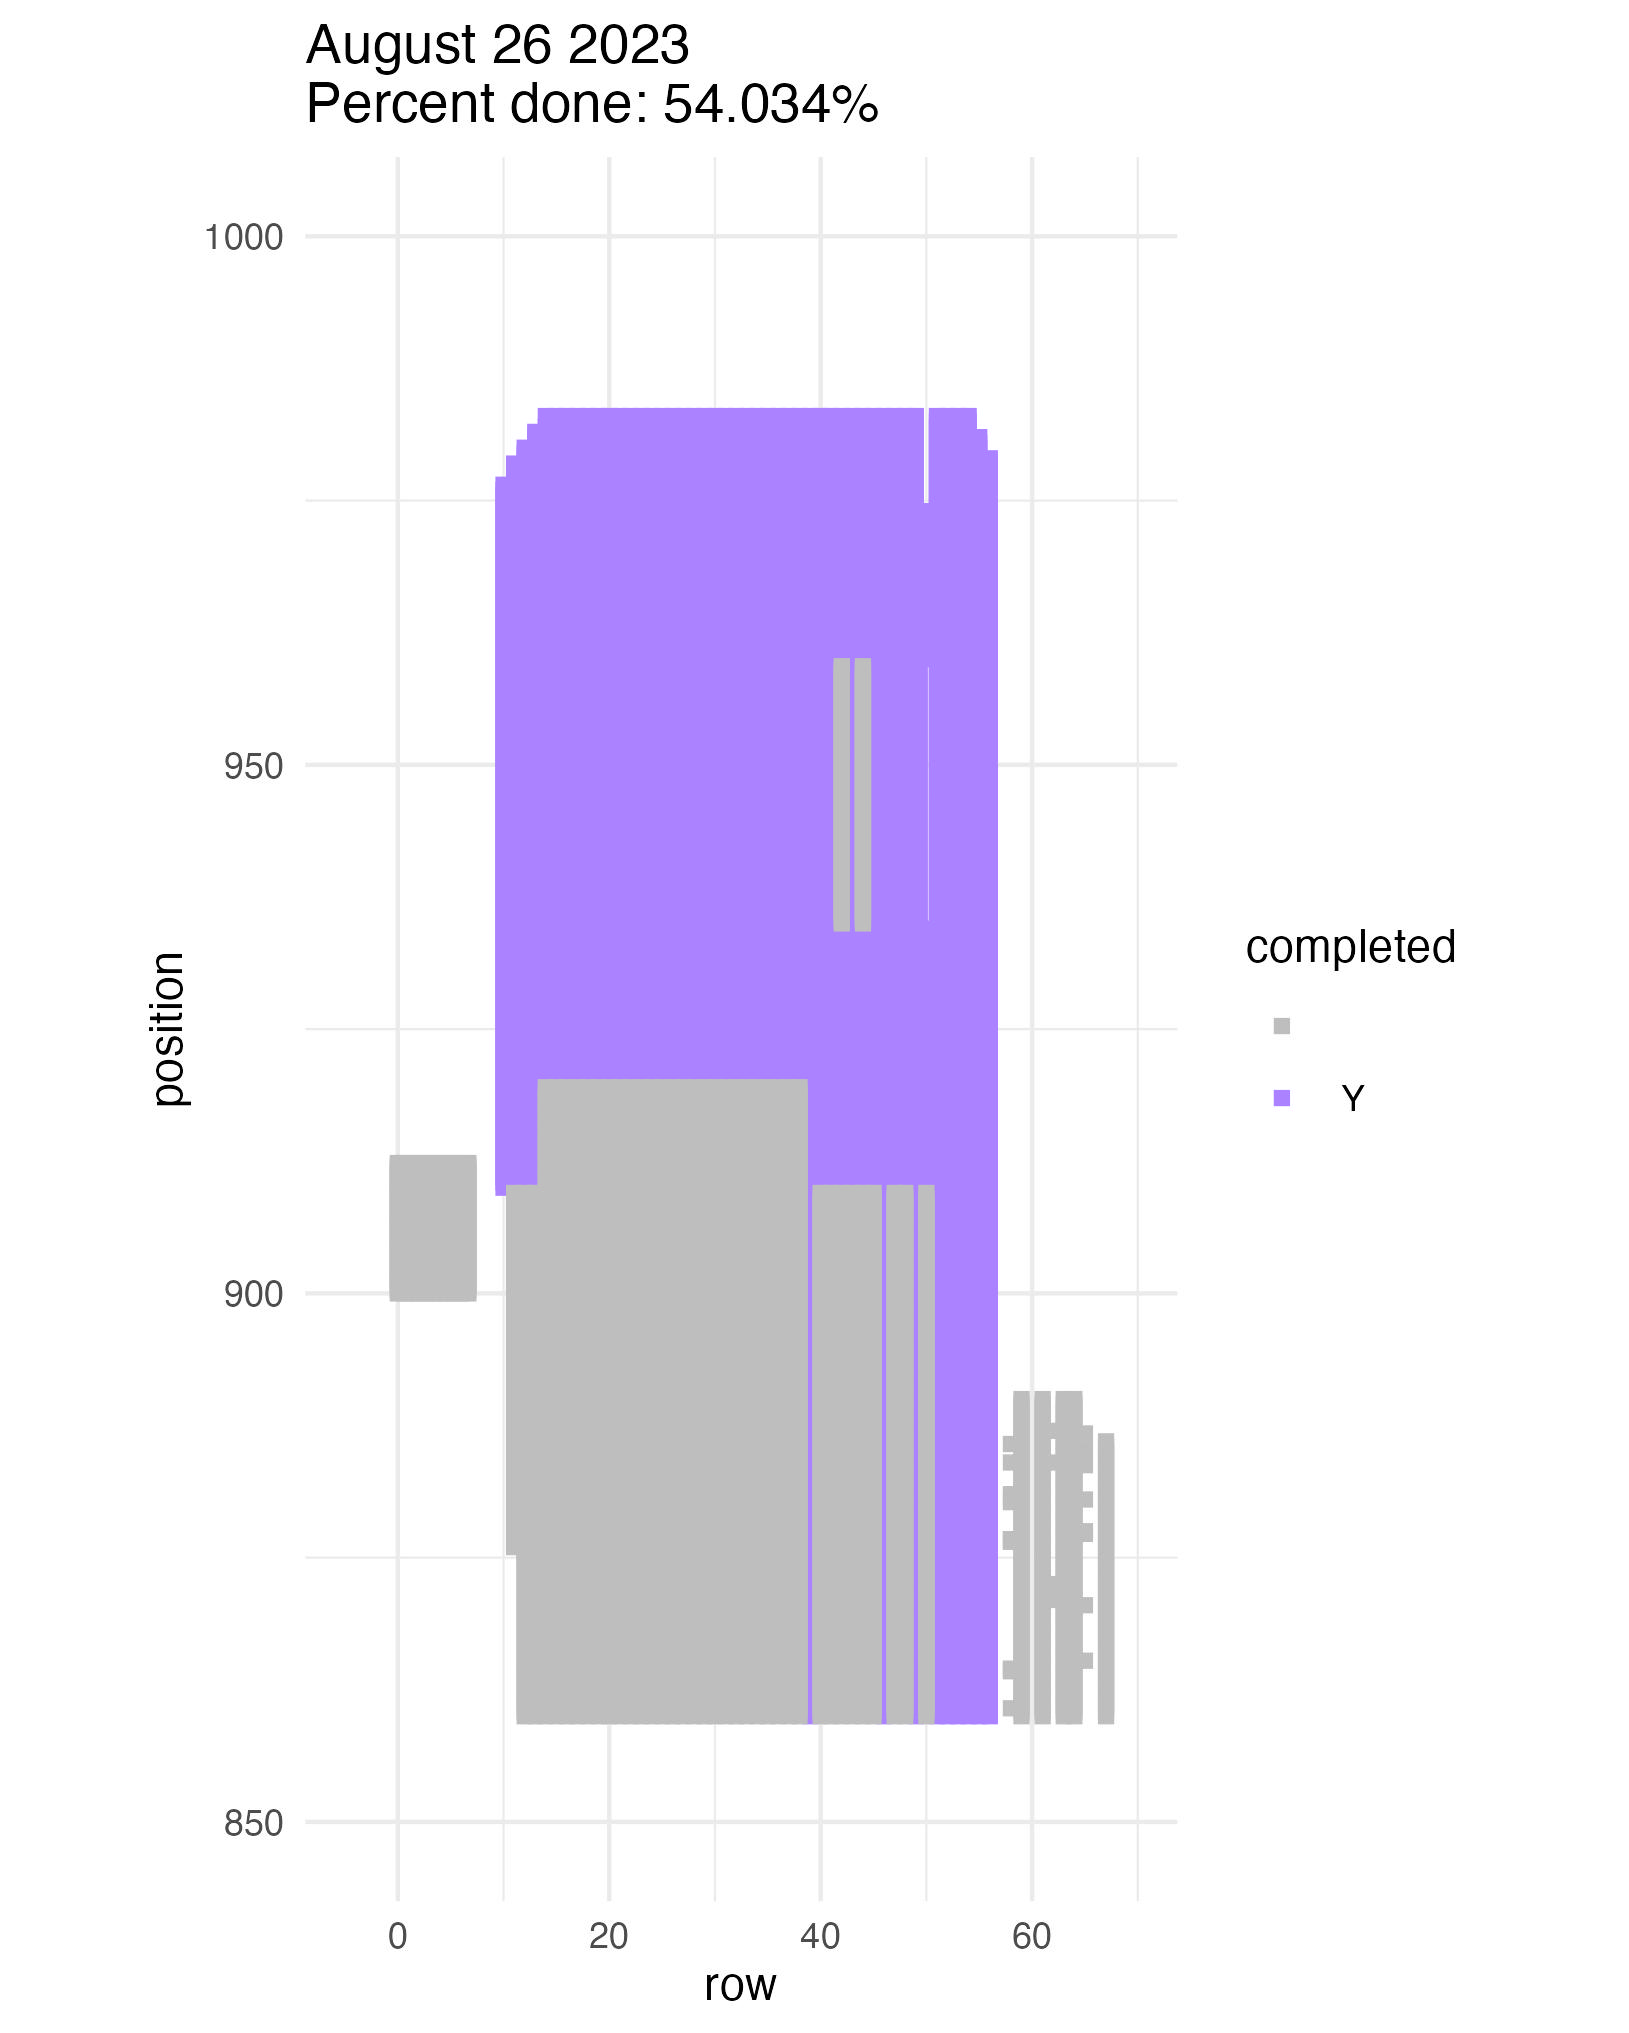
To be continued… The team is making excellent time! These fast measuring skills no doubt transferred to speedy times at Flekkefest this weekend. 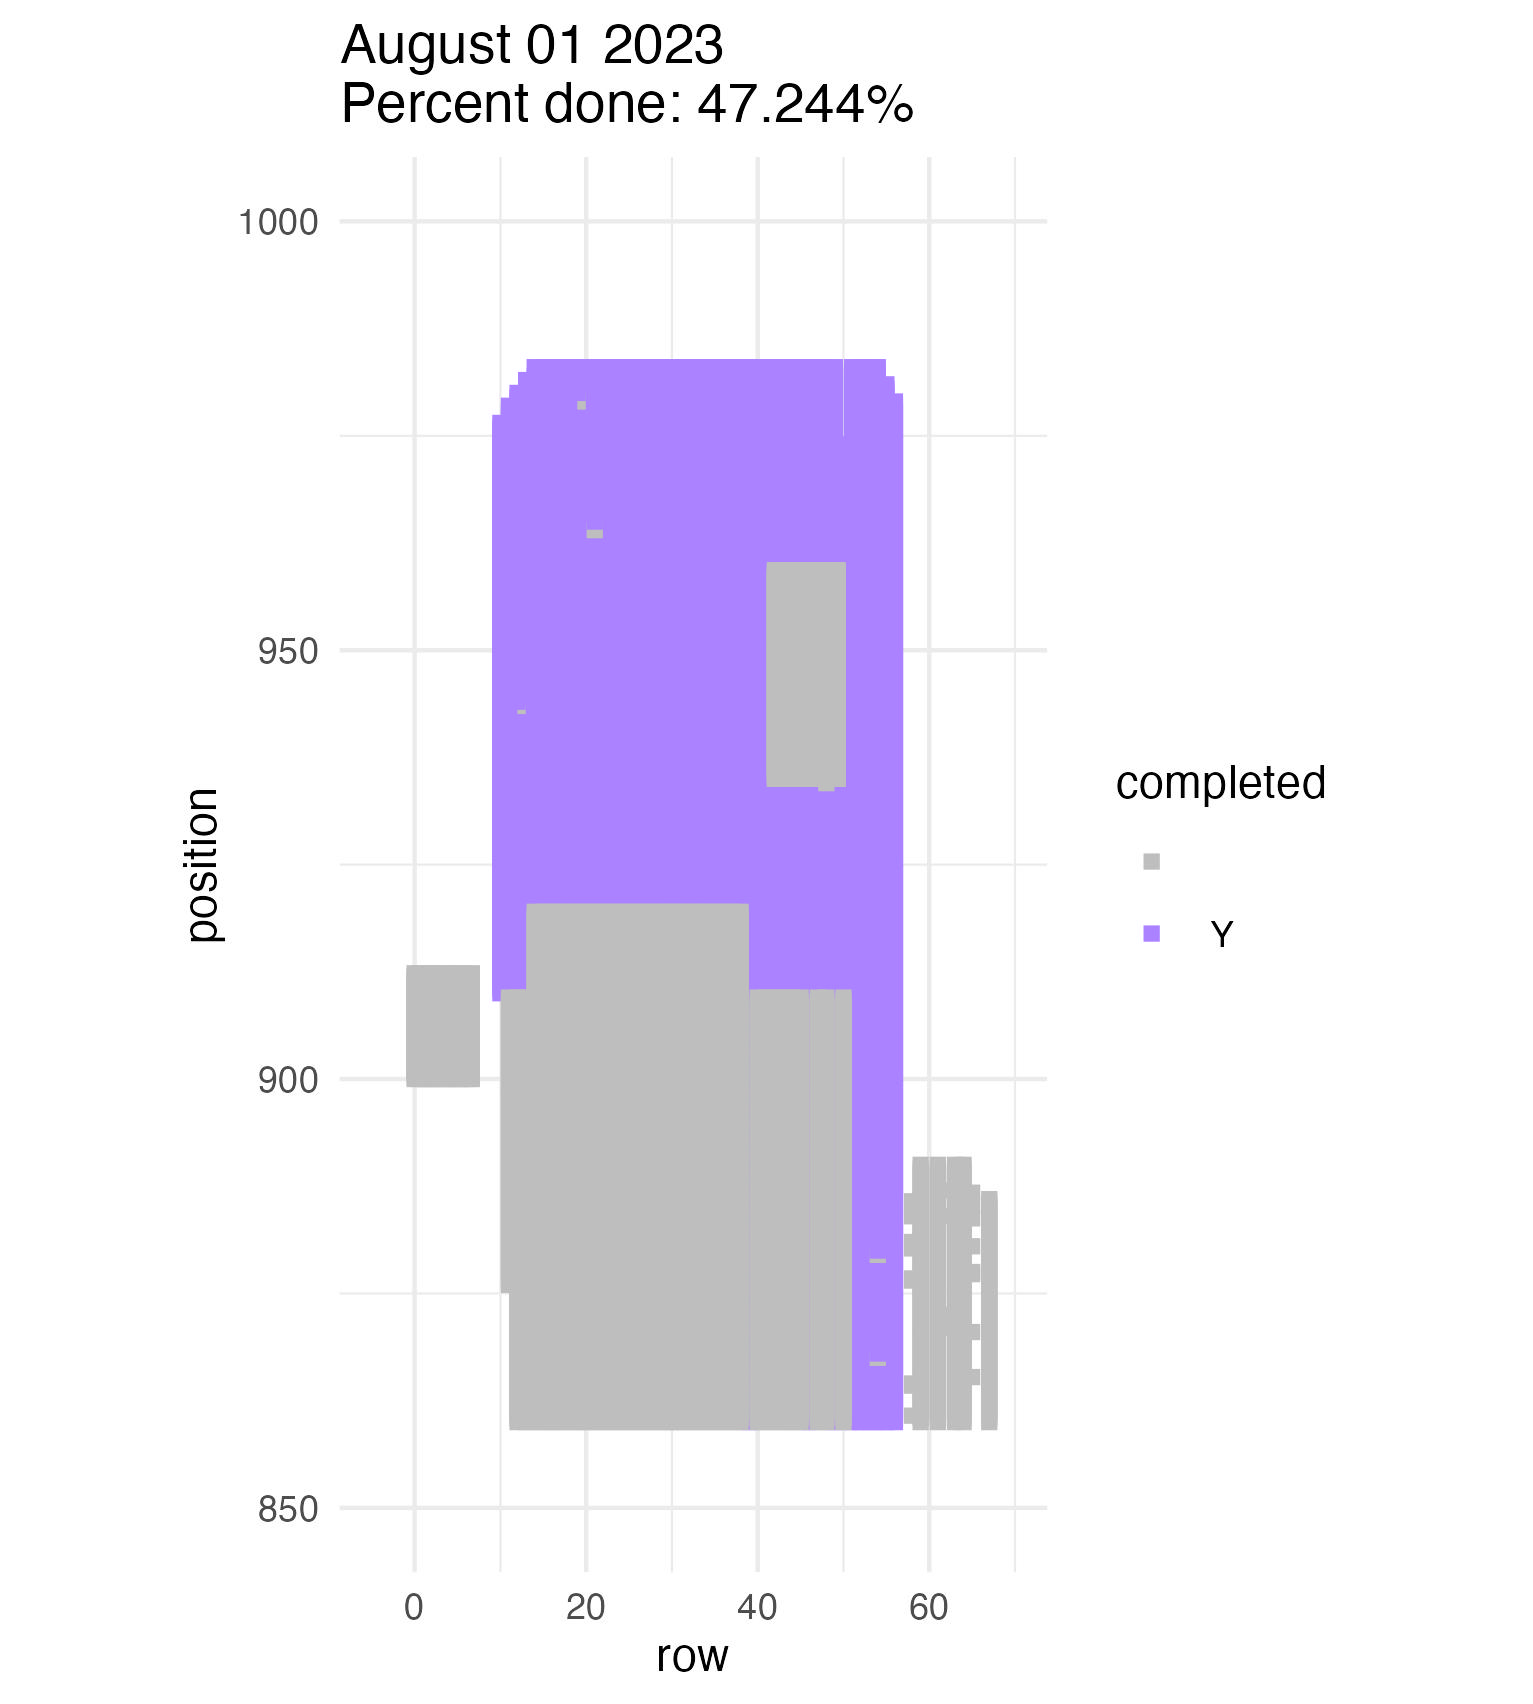 Another crew of 6 today brought us up past 38% done measuring p1. Yeehaw! 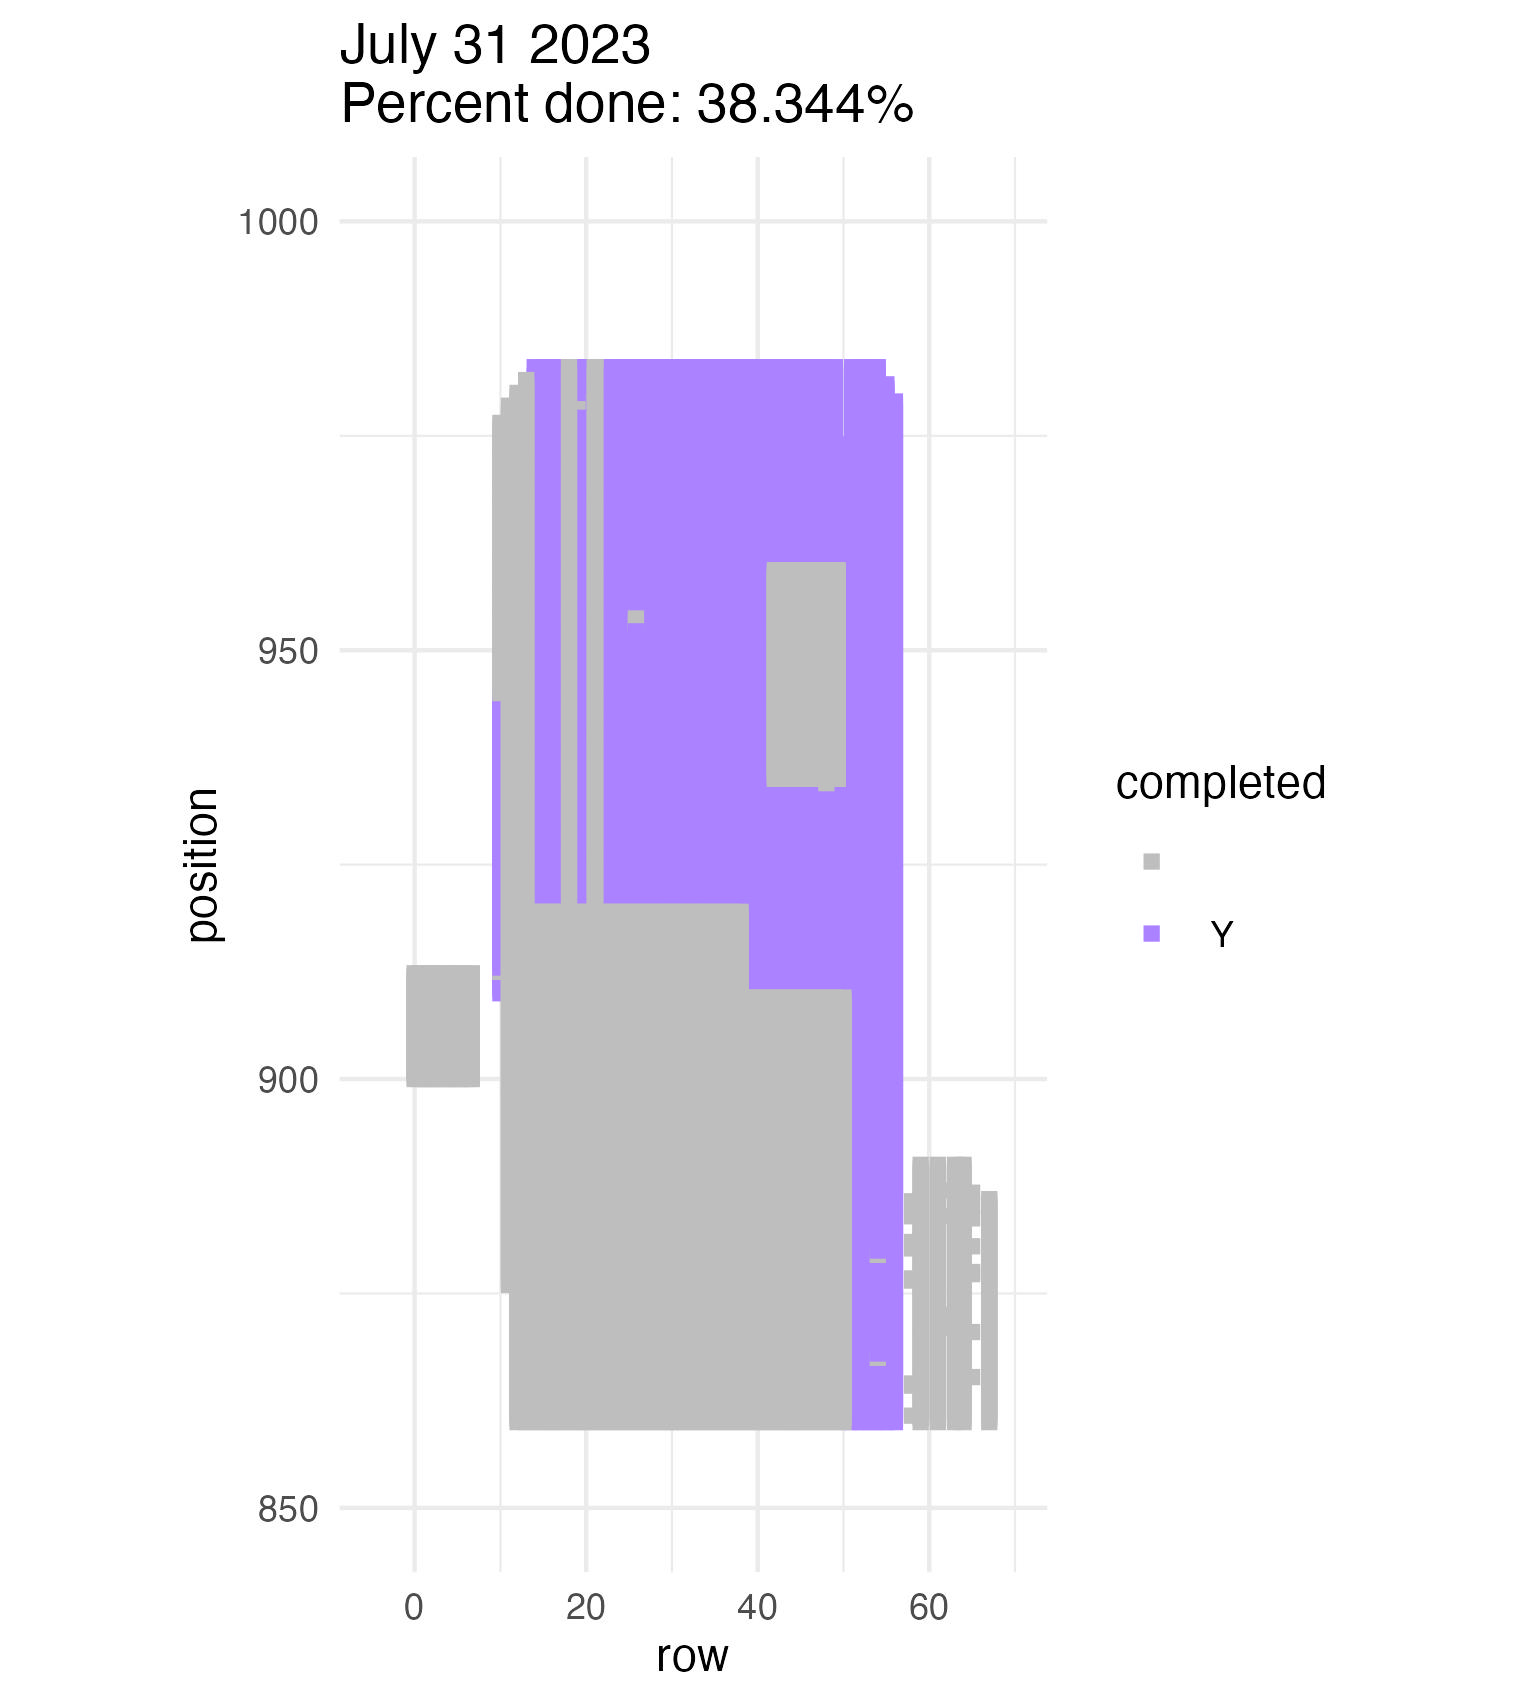 Small crews can make big strides! There were only 6 of us out there this morning, but we managed to crack 30% done. 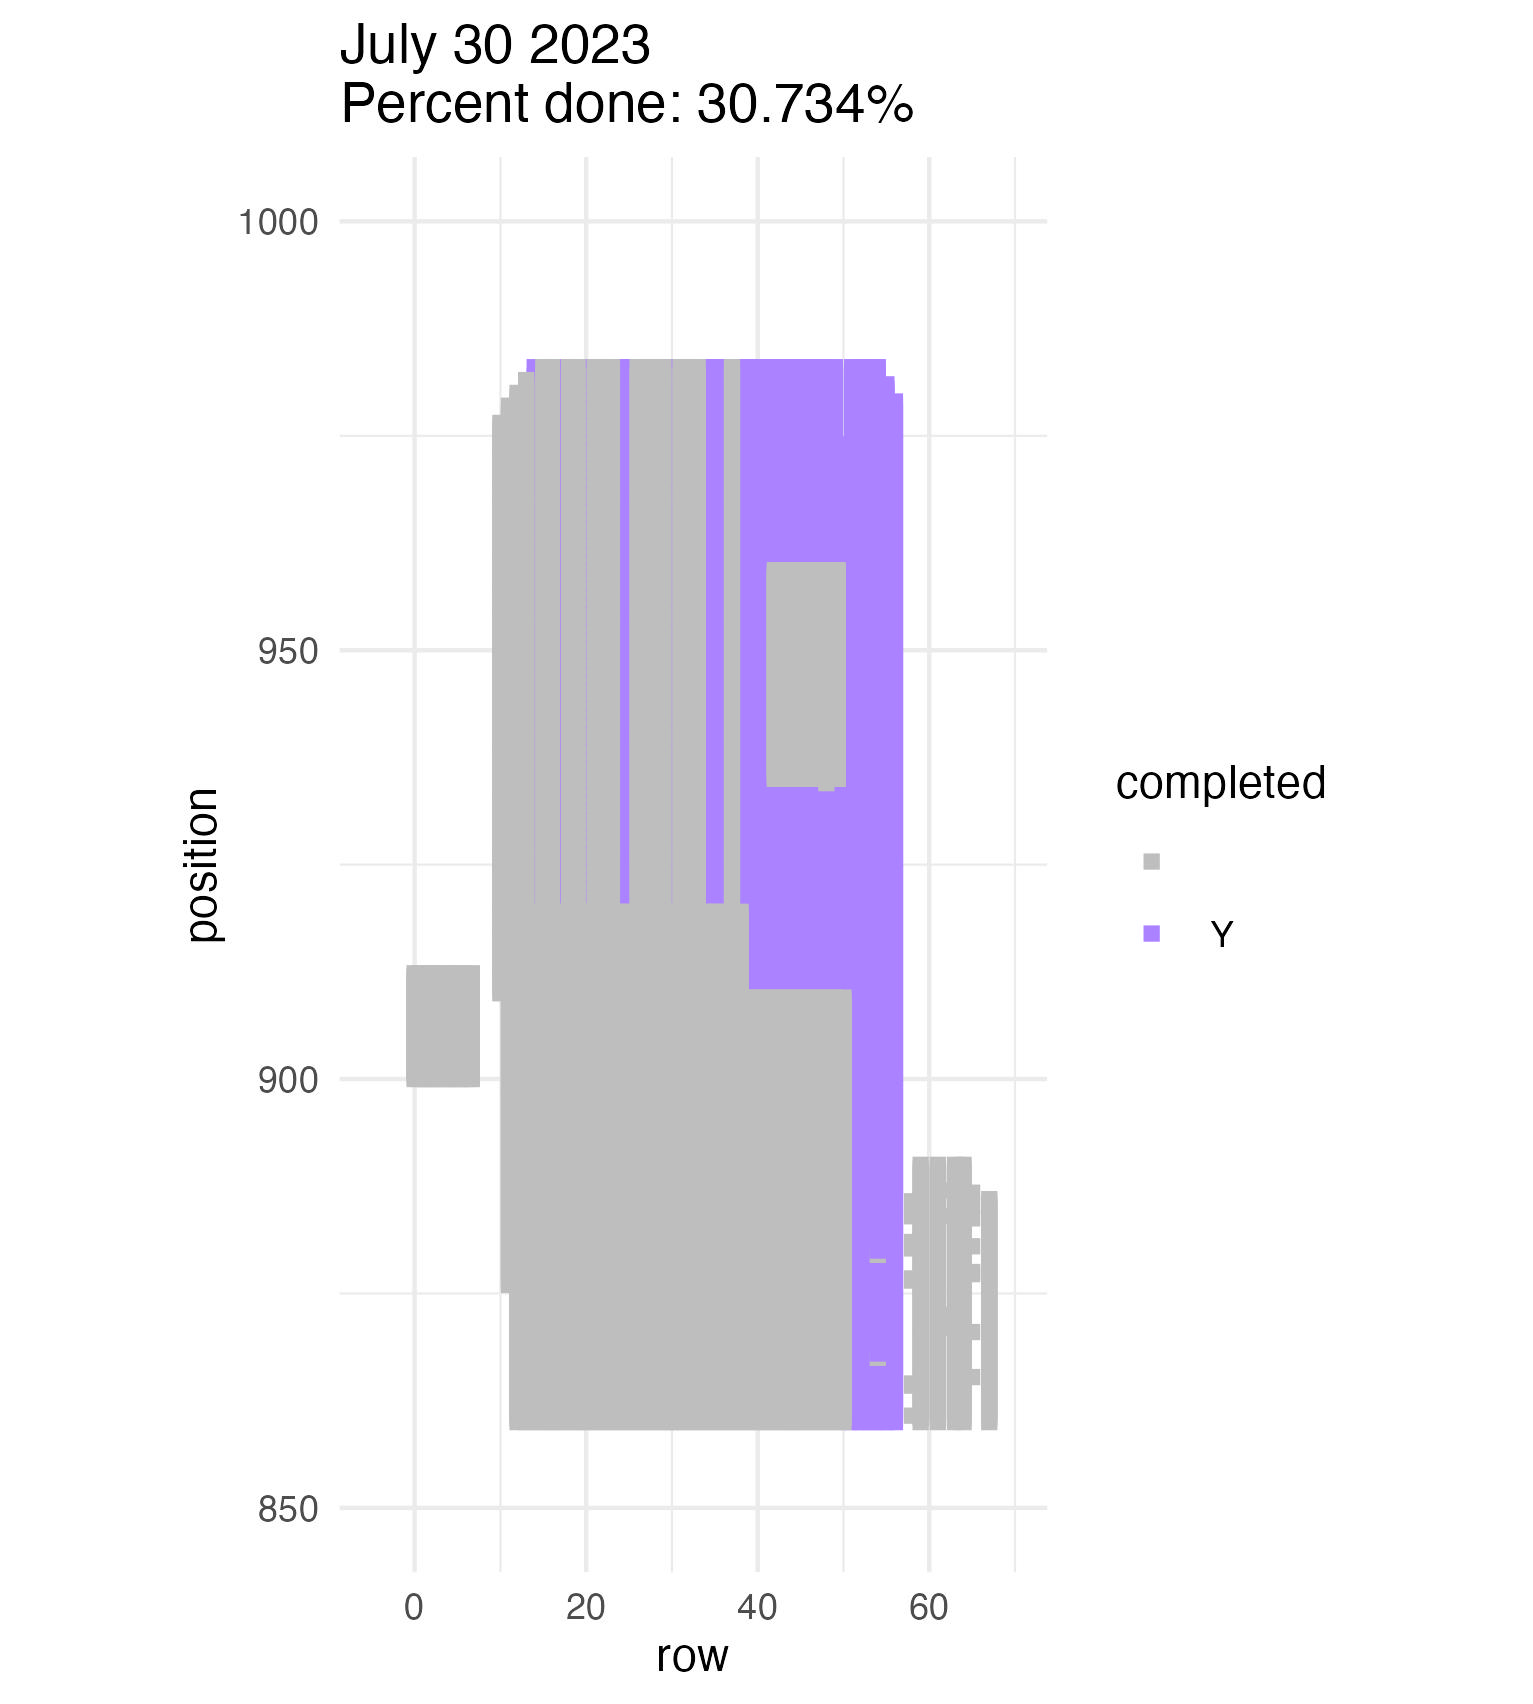 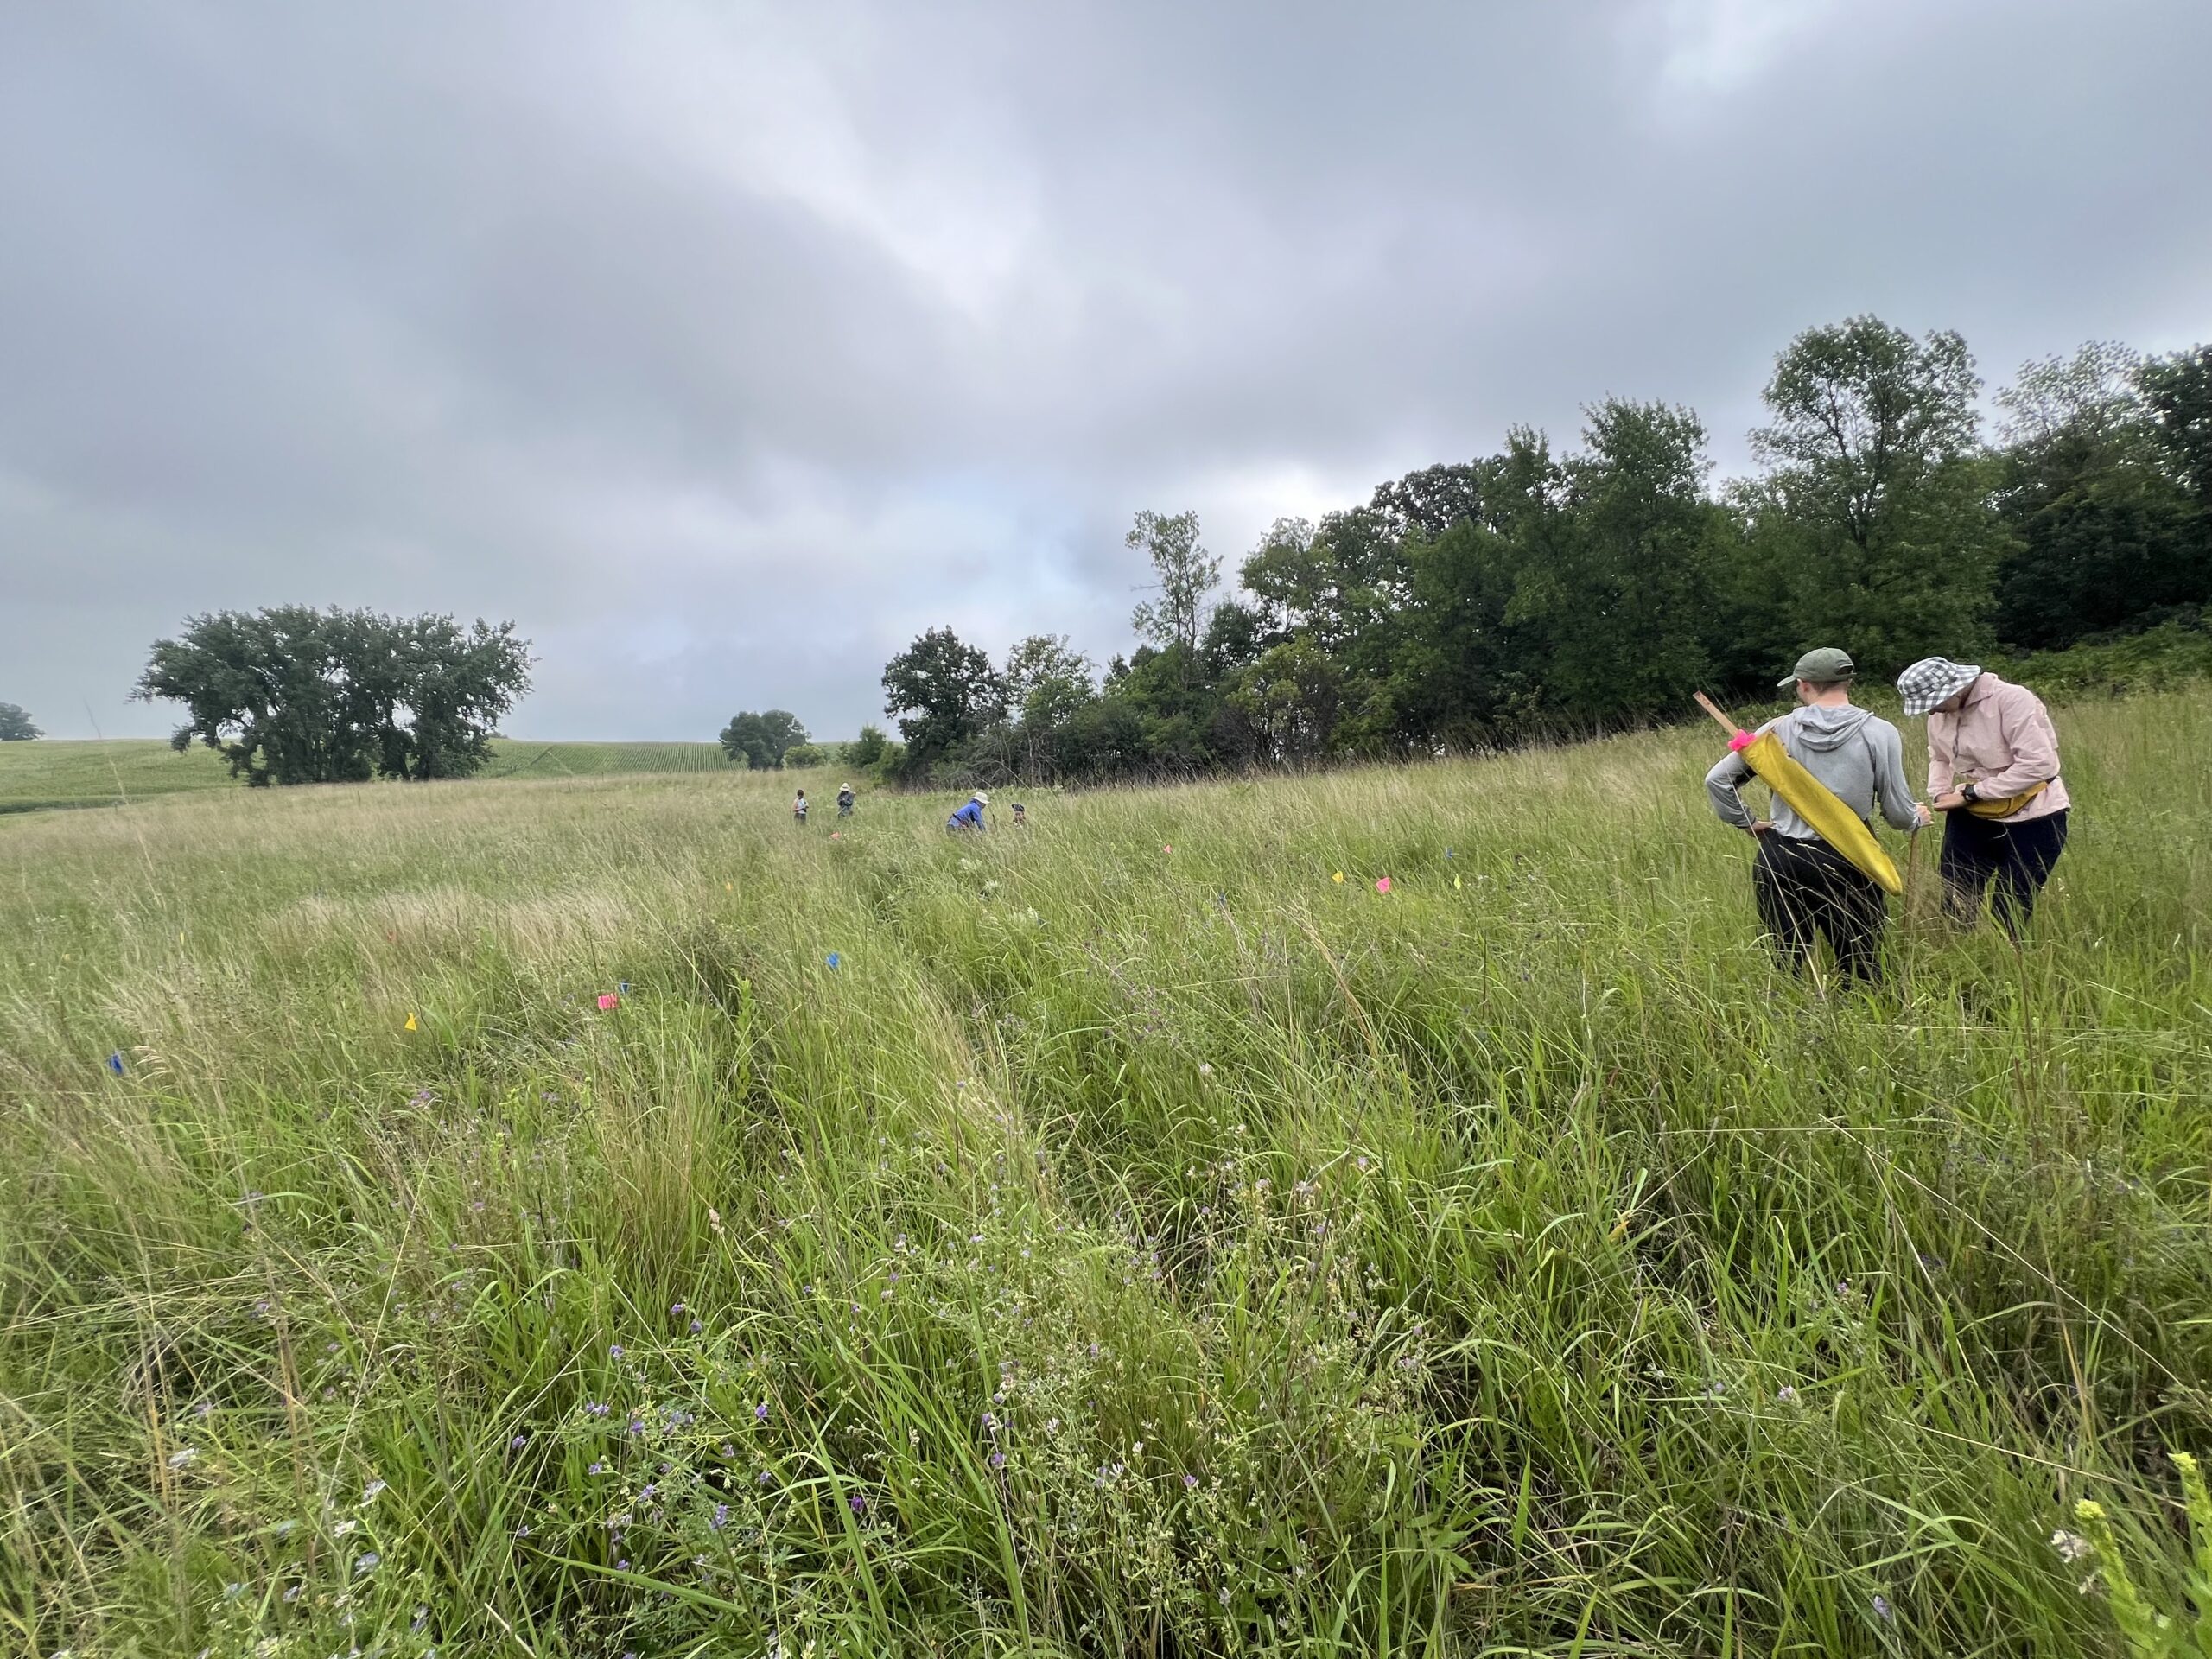 Friday, 26 July, 2024, was the first day we started measuring p1 this year! Coincidentally, this was the same day we started last year. This monumental task involves visiting 10992 positions in the plot and assessing the status of the plants there (or not, in the case of plants we have not been able to find in >3 years. RIP. Presumably.) After measuring again this morning, I booted up the old progress tracker (in the cgData repo, if you ever need it) to see how we’re doing. After making some adjustments (for the colorblind out there), here’s our progress over the last two days: 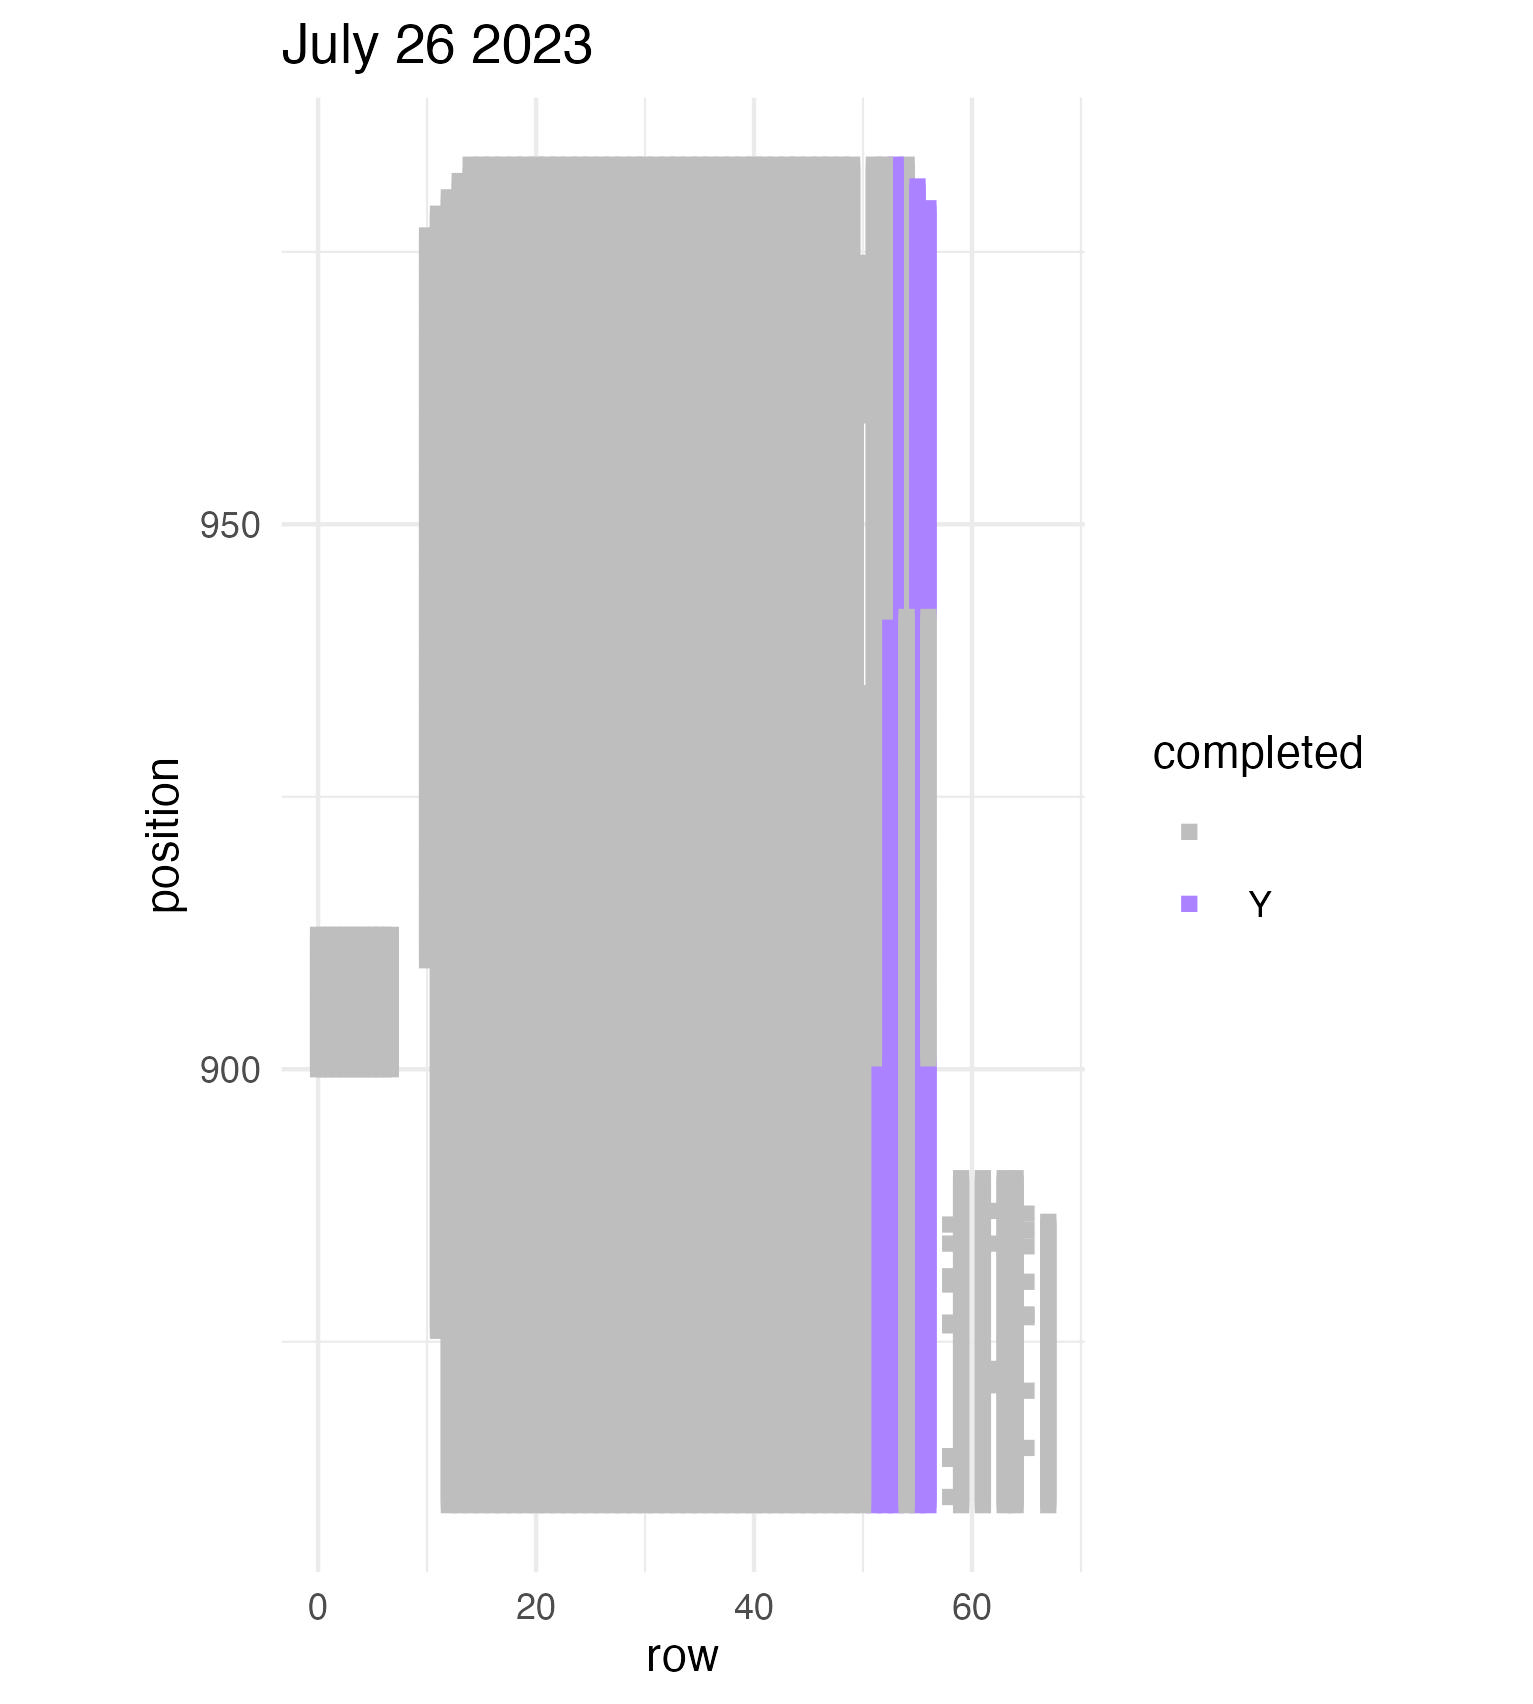 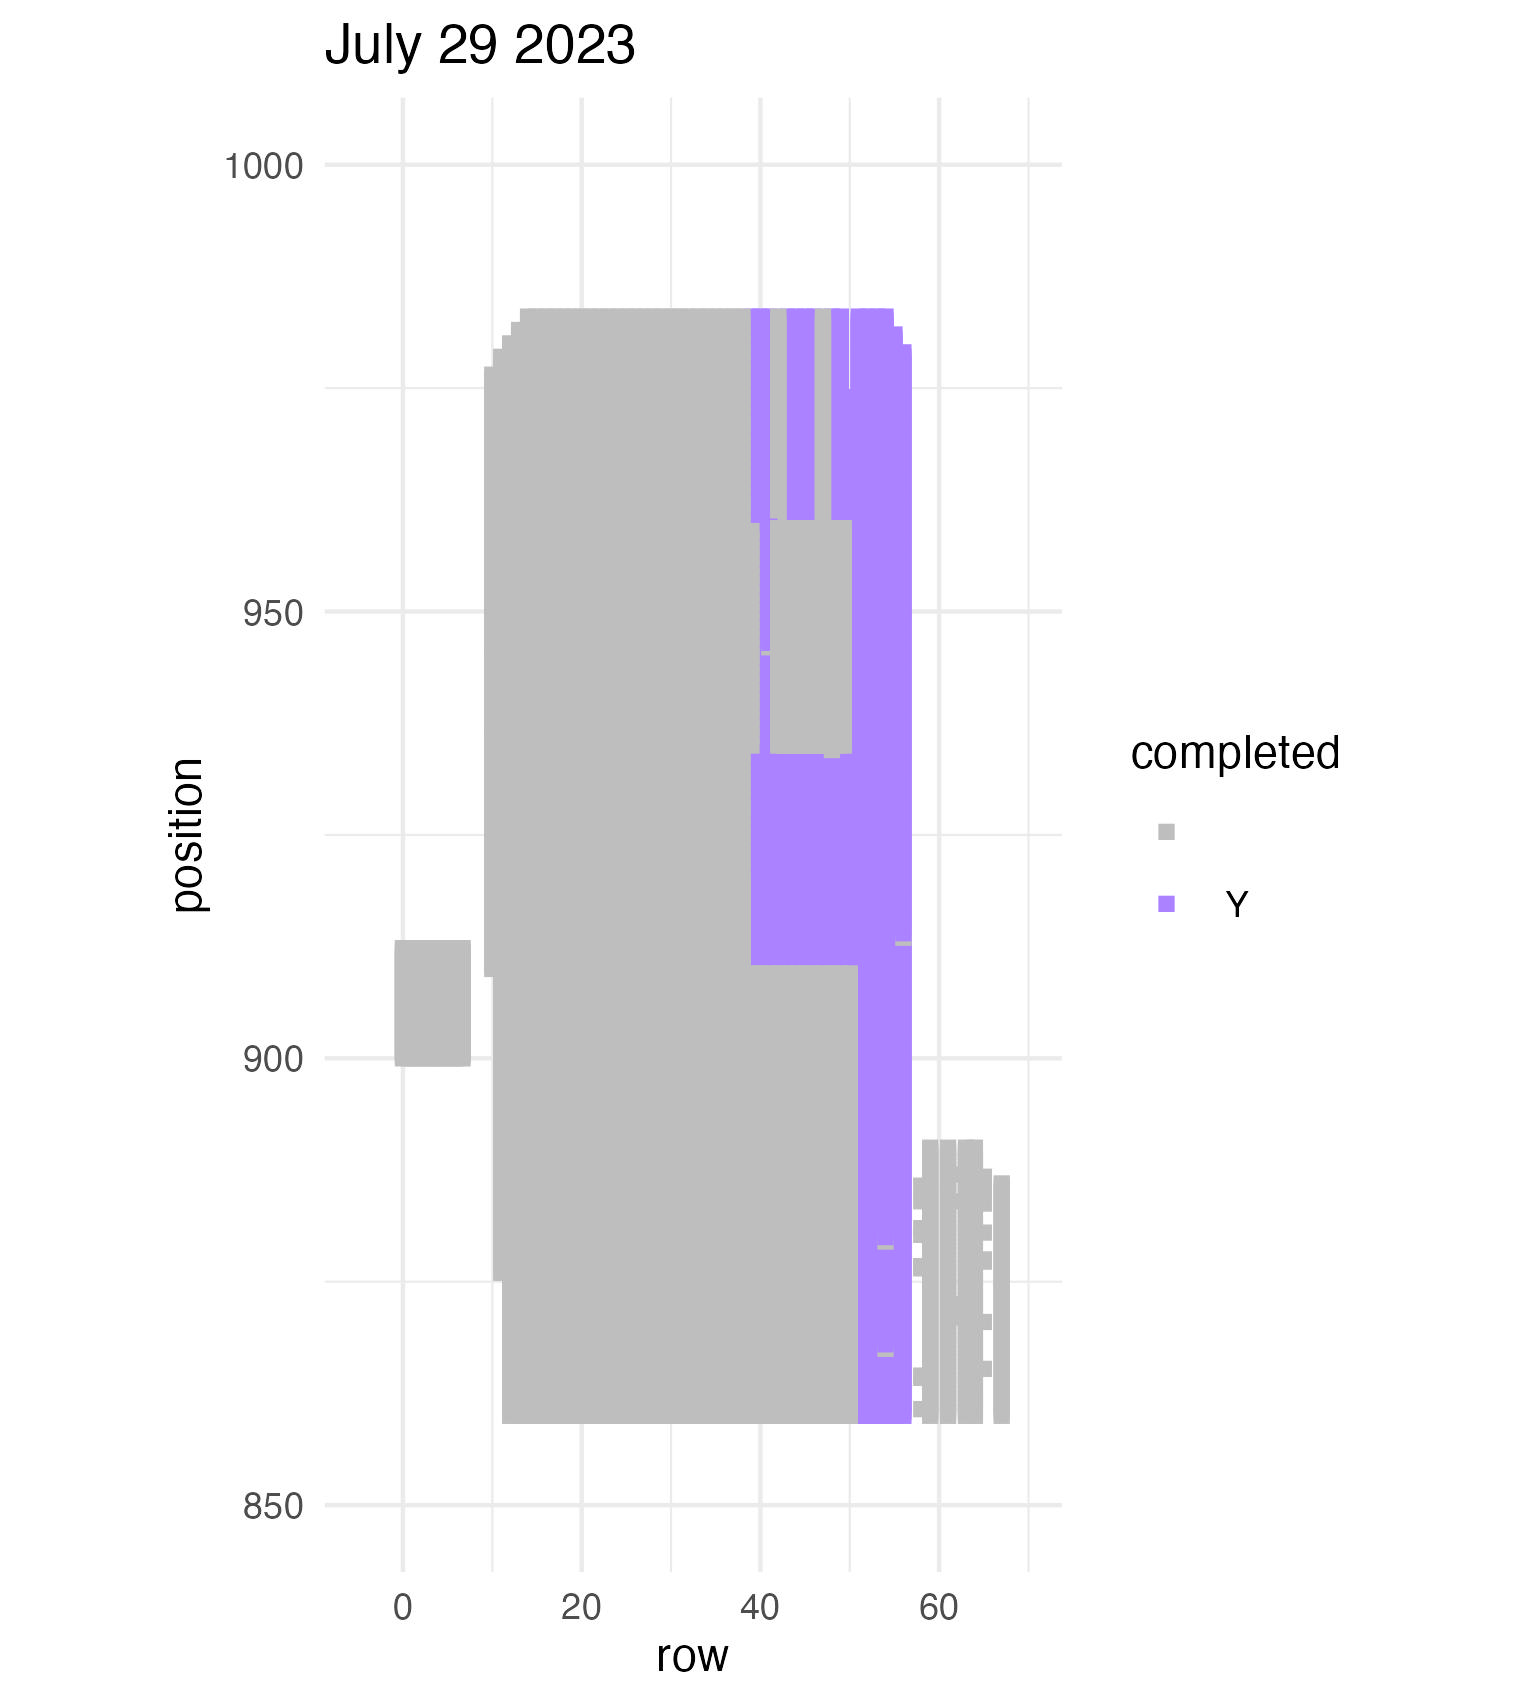 Today was also RET Brittany’s last day with the field team. Brittany, you will be sorely missed, and we hope you bring a bit of the prairie to share with your students! 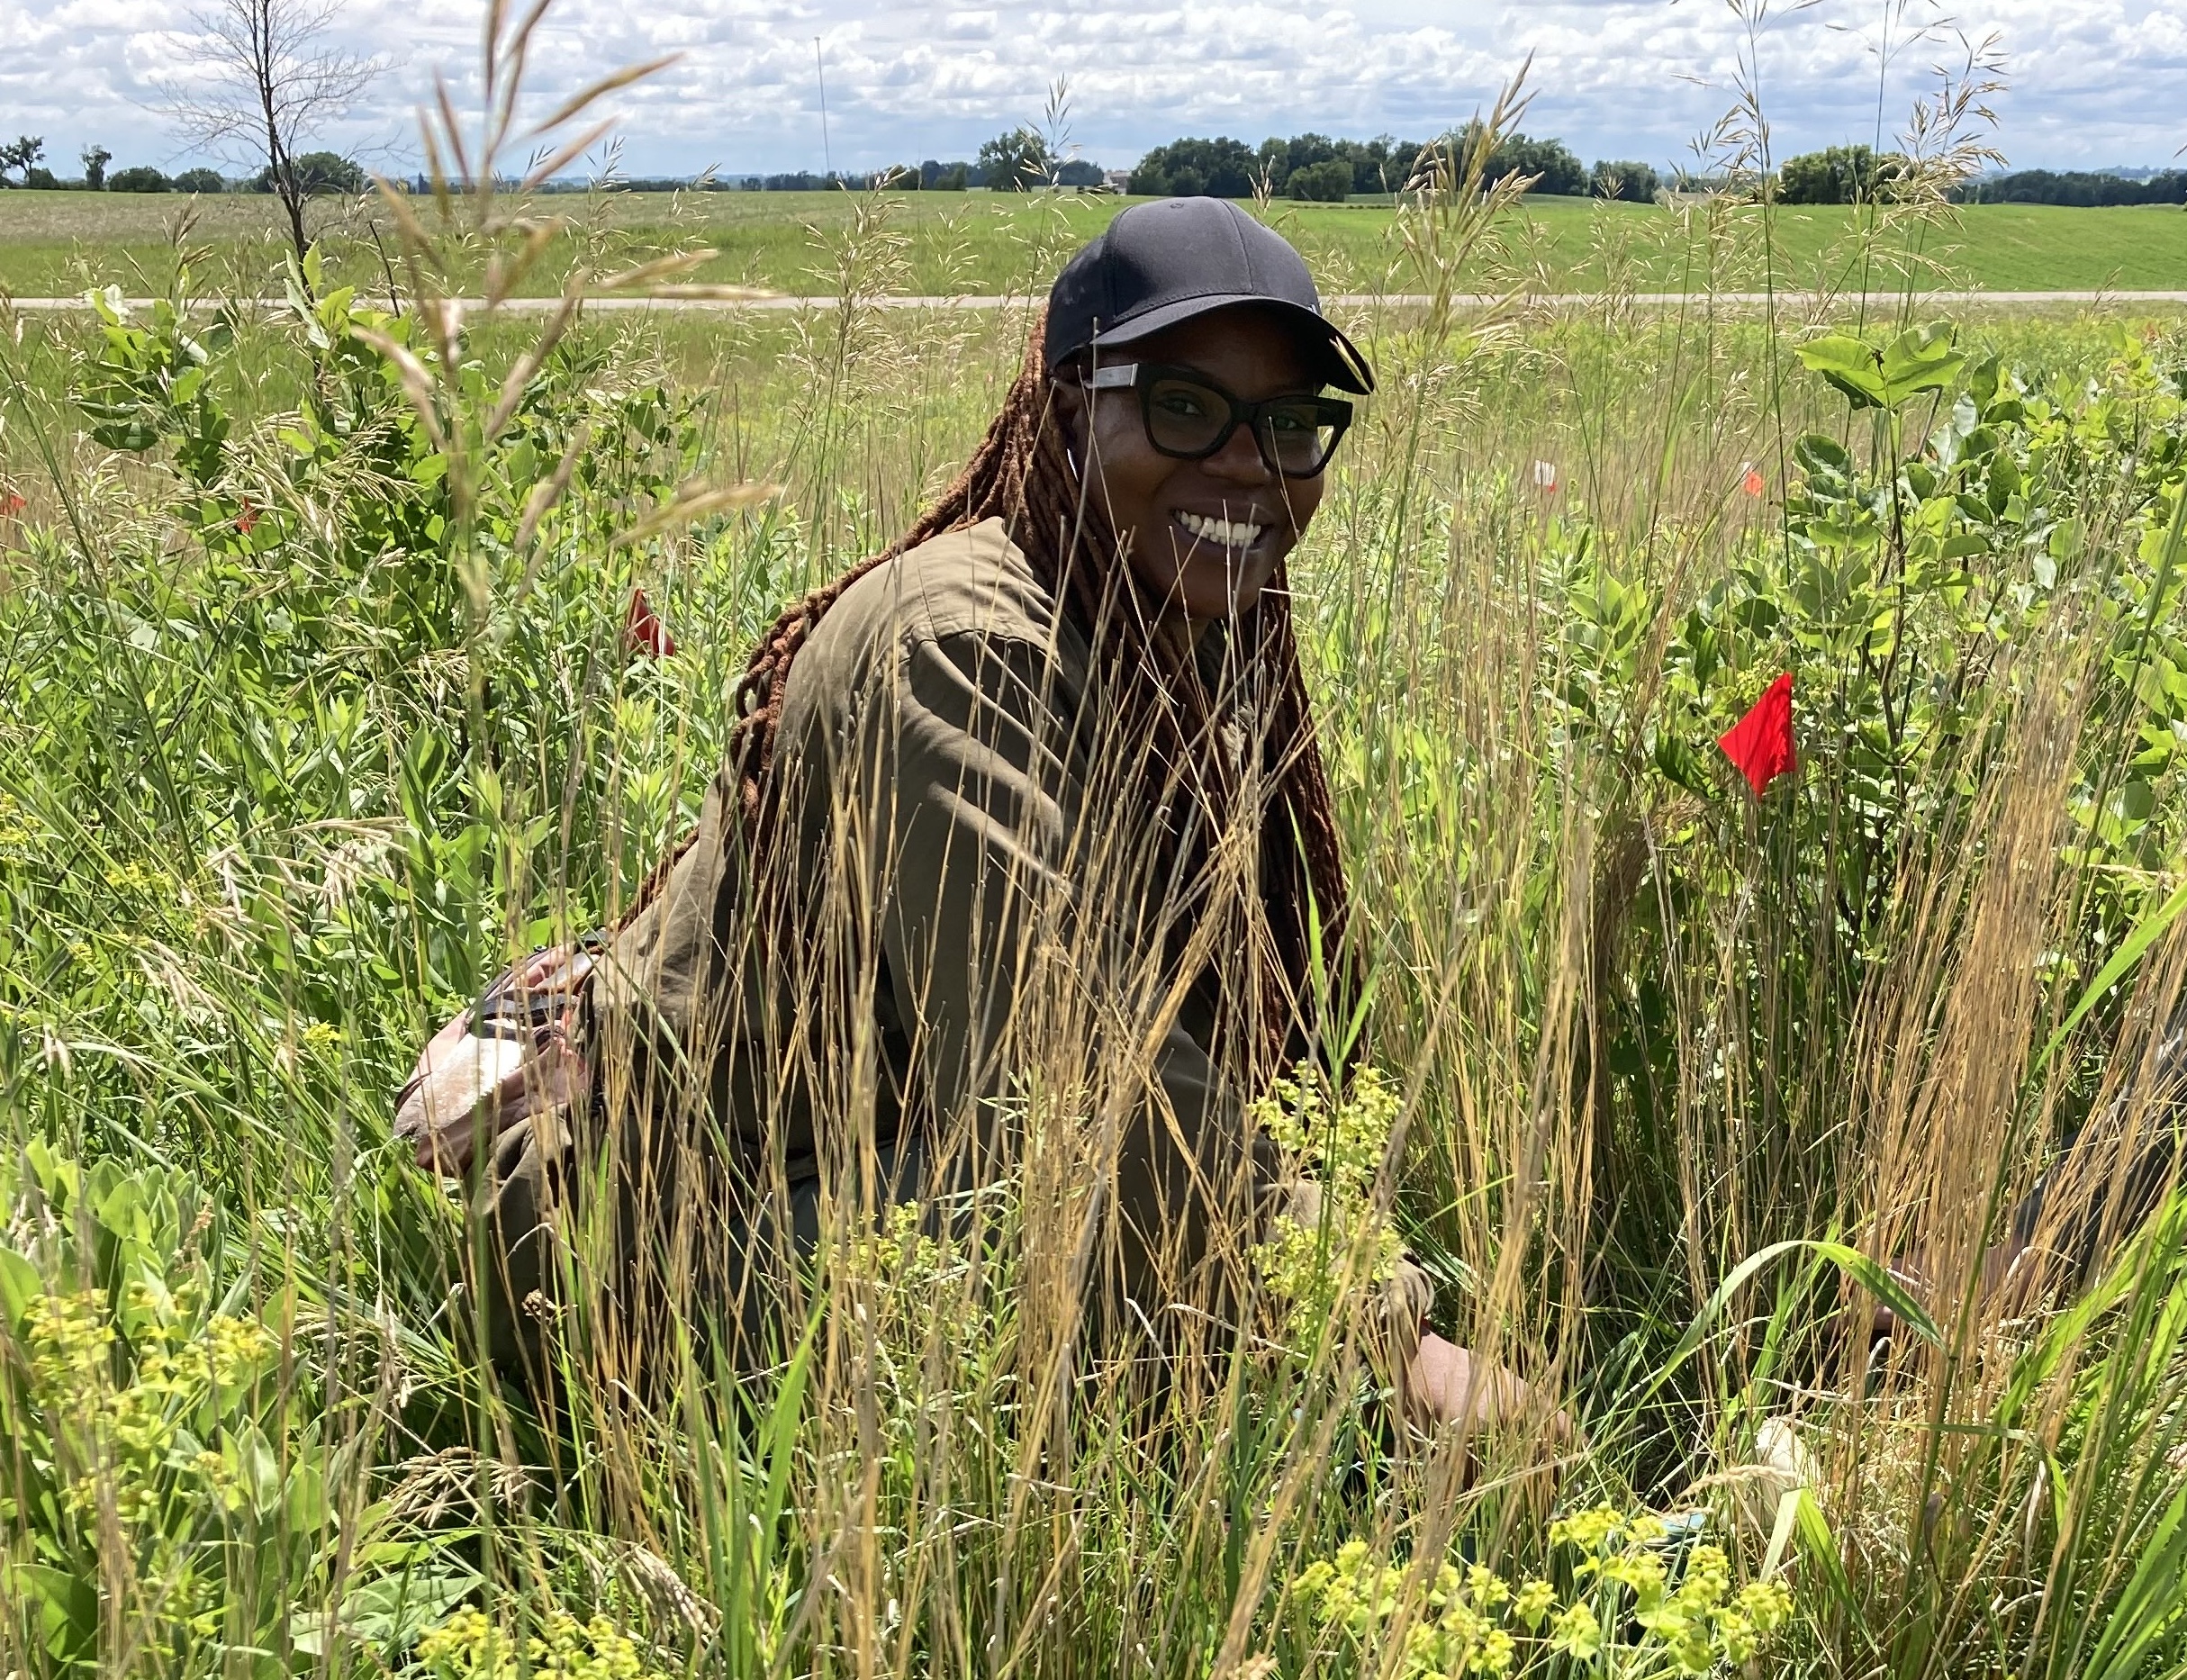 Today Team Echinacea continued to wrap up the pollen and nectar collection. Only a few focal plants are still in flower. Another group worked on flagging and recording demographic information for every flowering Echinacea plant in every remnant site. Some of these plants have tags dating back decades! In the experimental plots, Stuart trained team members to find and measure all Echinacea. This data will help us understand performance of E. angustifolia x pallida hybrids. Round 5 of emergence trapping started recently. The team members are now pros at deploying and retrieving the traps. 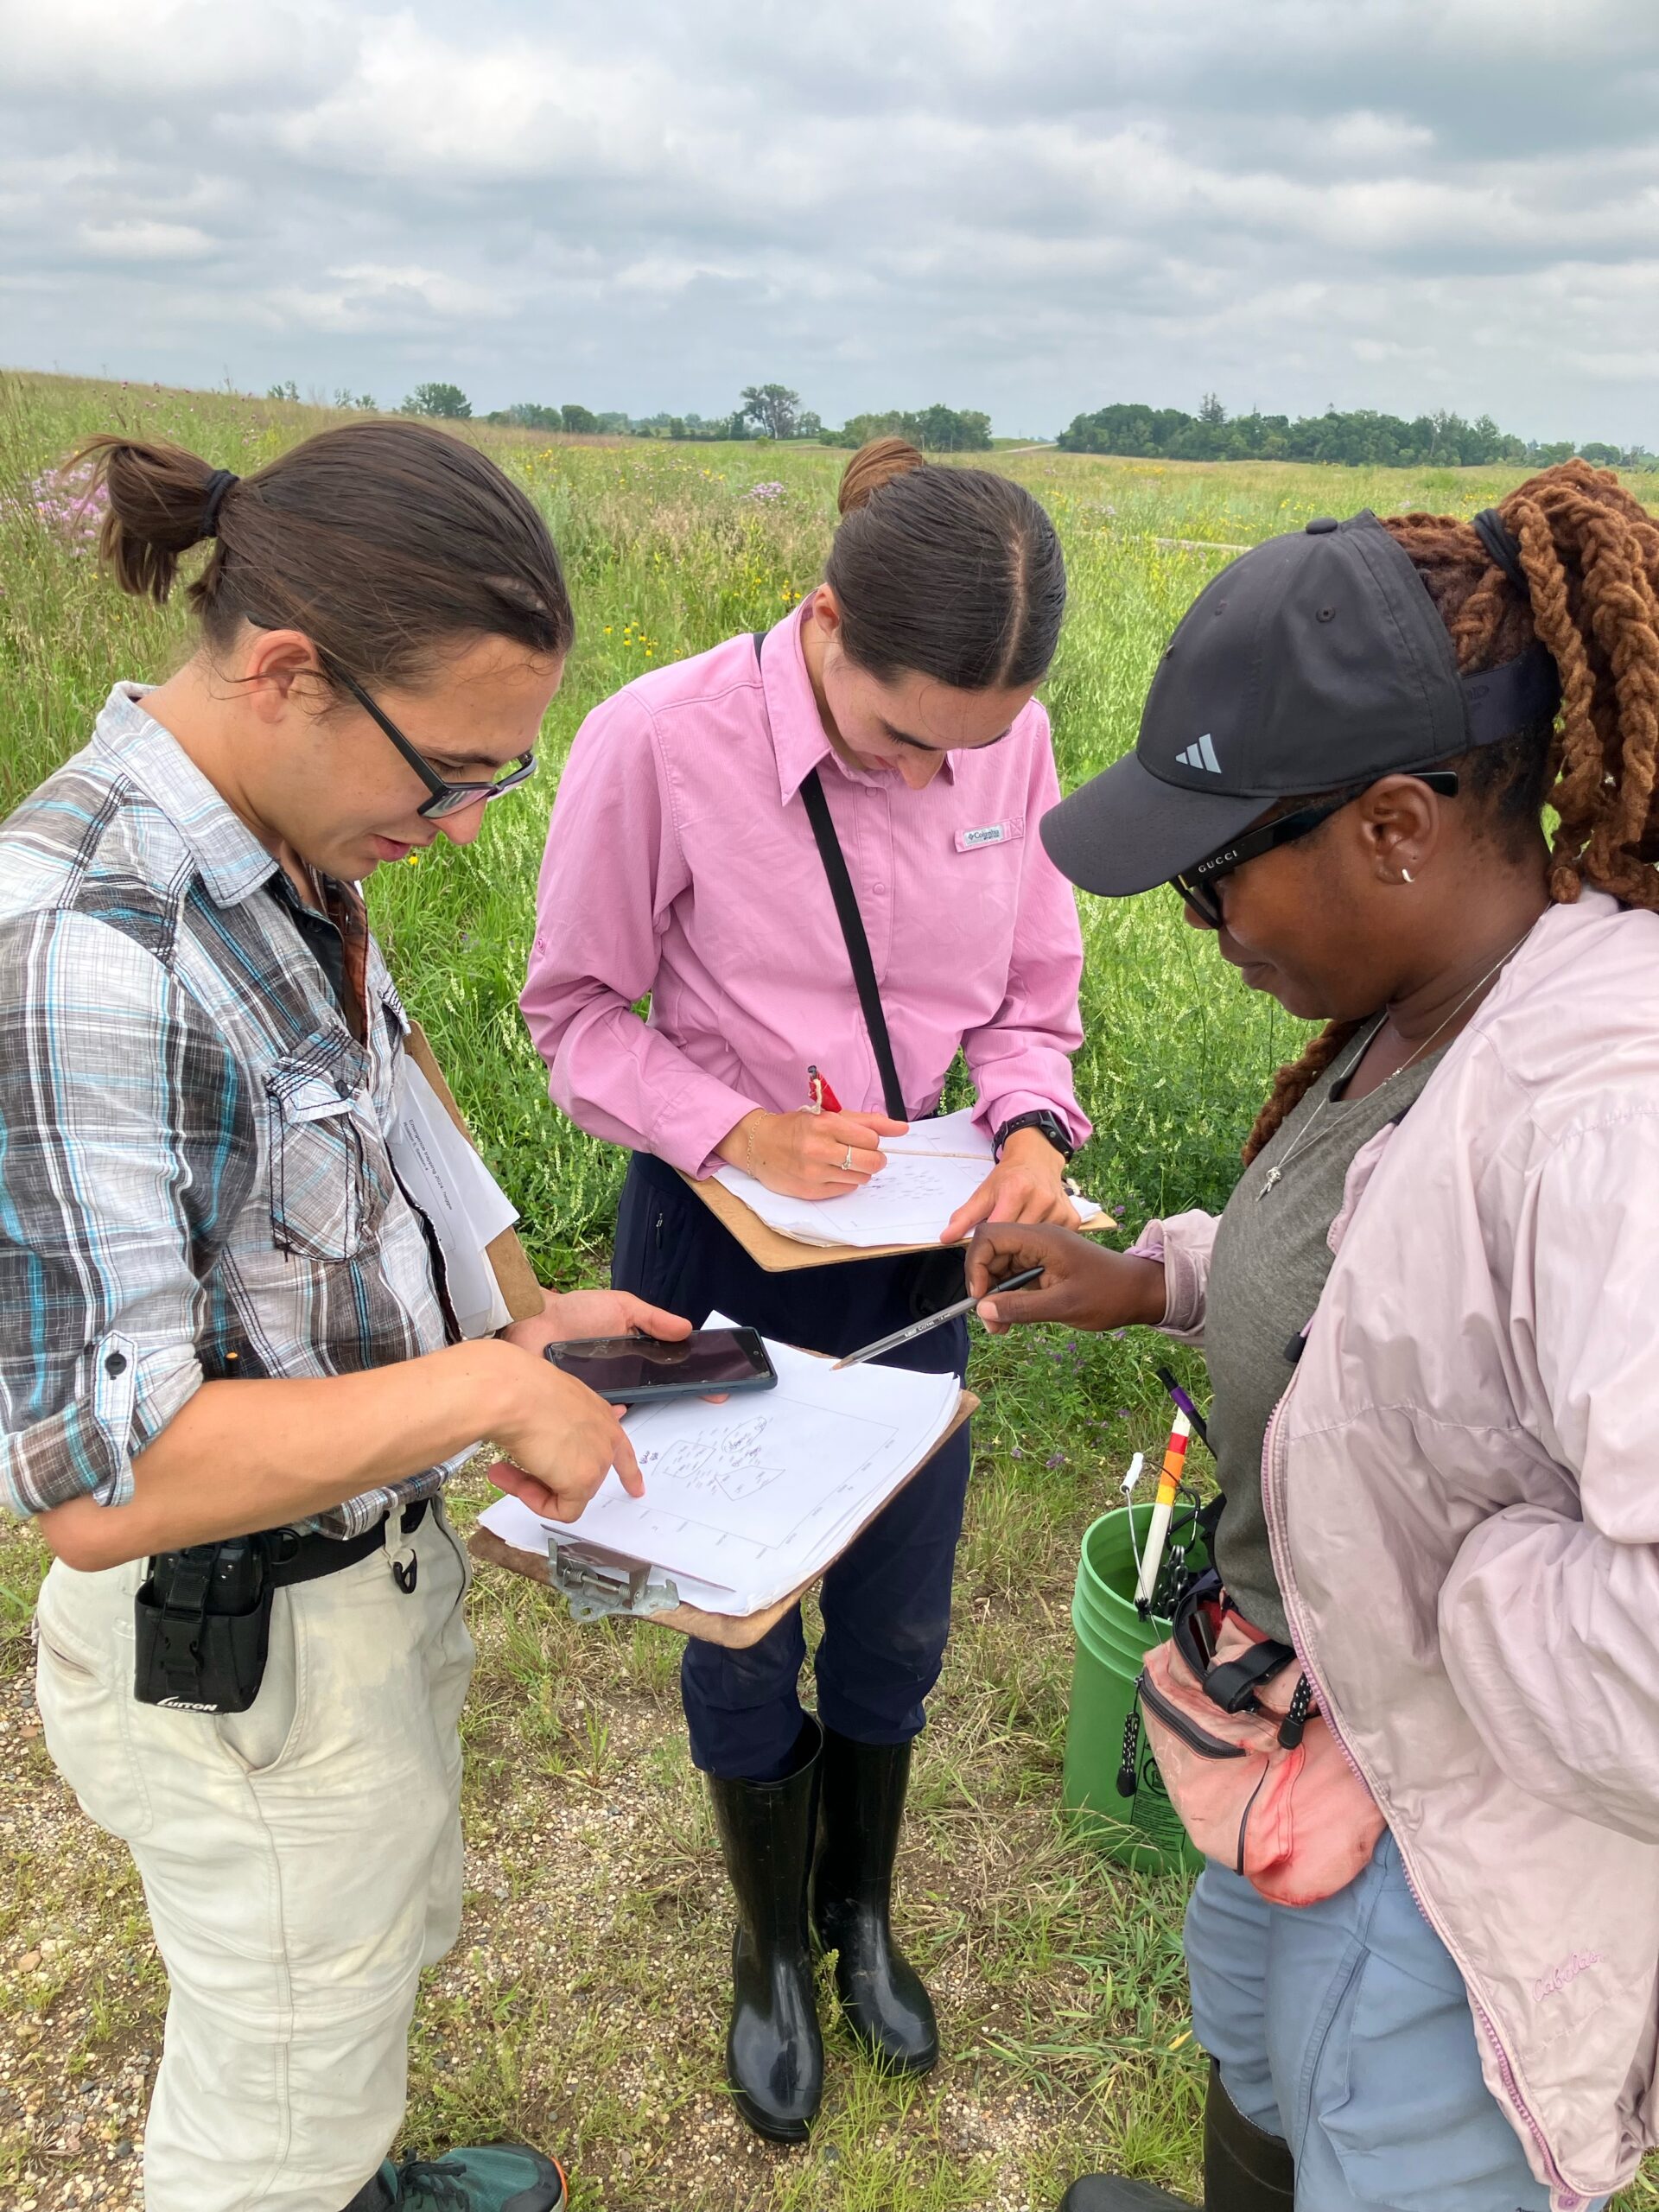 The aphid addition and exclusion experiment was started in 2011 by Katherine Muller. The original experiment included 100 plants selected from exPt01 which were each assigned to have aphids either added or excluded through multiple years. The intention is to assess the impact of the specialist herbivore Aphis echinaceae on Echinacea fitness. Last summer (2022), team members Emma Reineke and Kennedy Porter were in charge of the experiment and did not find any aphids in exPt01, so they introduced a new population of Aphid echinaeceae into ExPt1. Learn more in the 2022 summer aphid update. During summer 2023, we did not do any fieldwork for this experiment and we didn’t see any aphids while measuring exPt01. 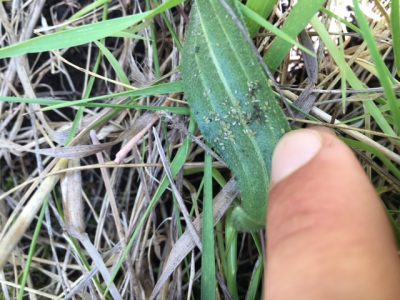
You can read more about the aphid addition and exclusion experiment, as well as links to prior flog entries mentioning the experiment, on the background page for this experiment. 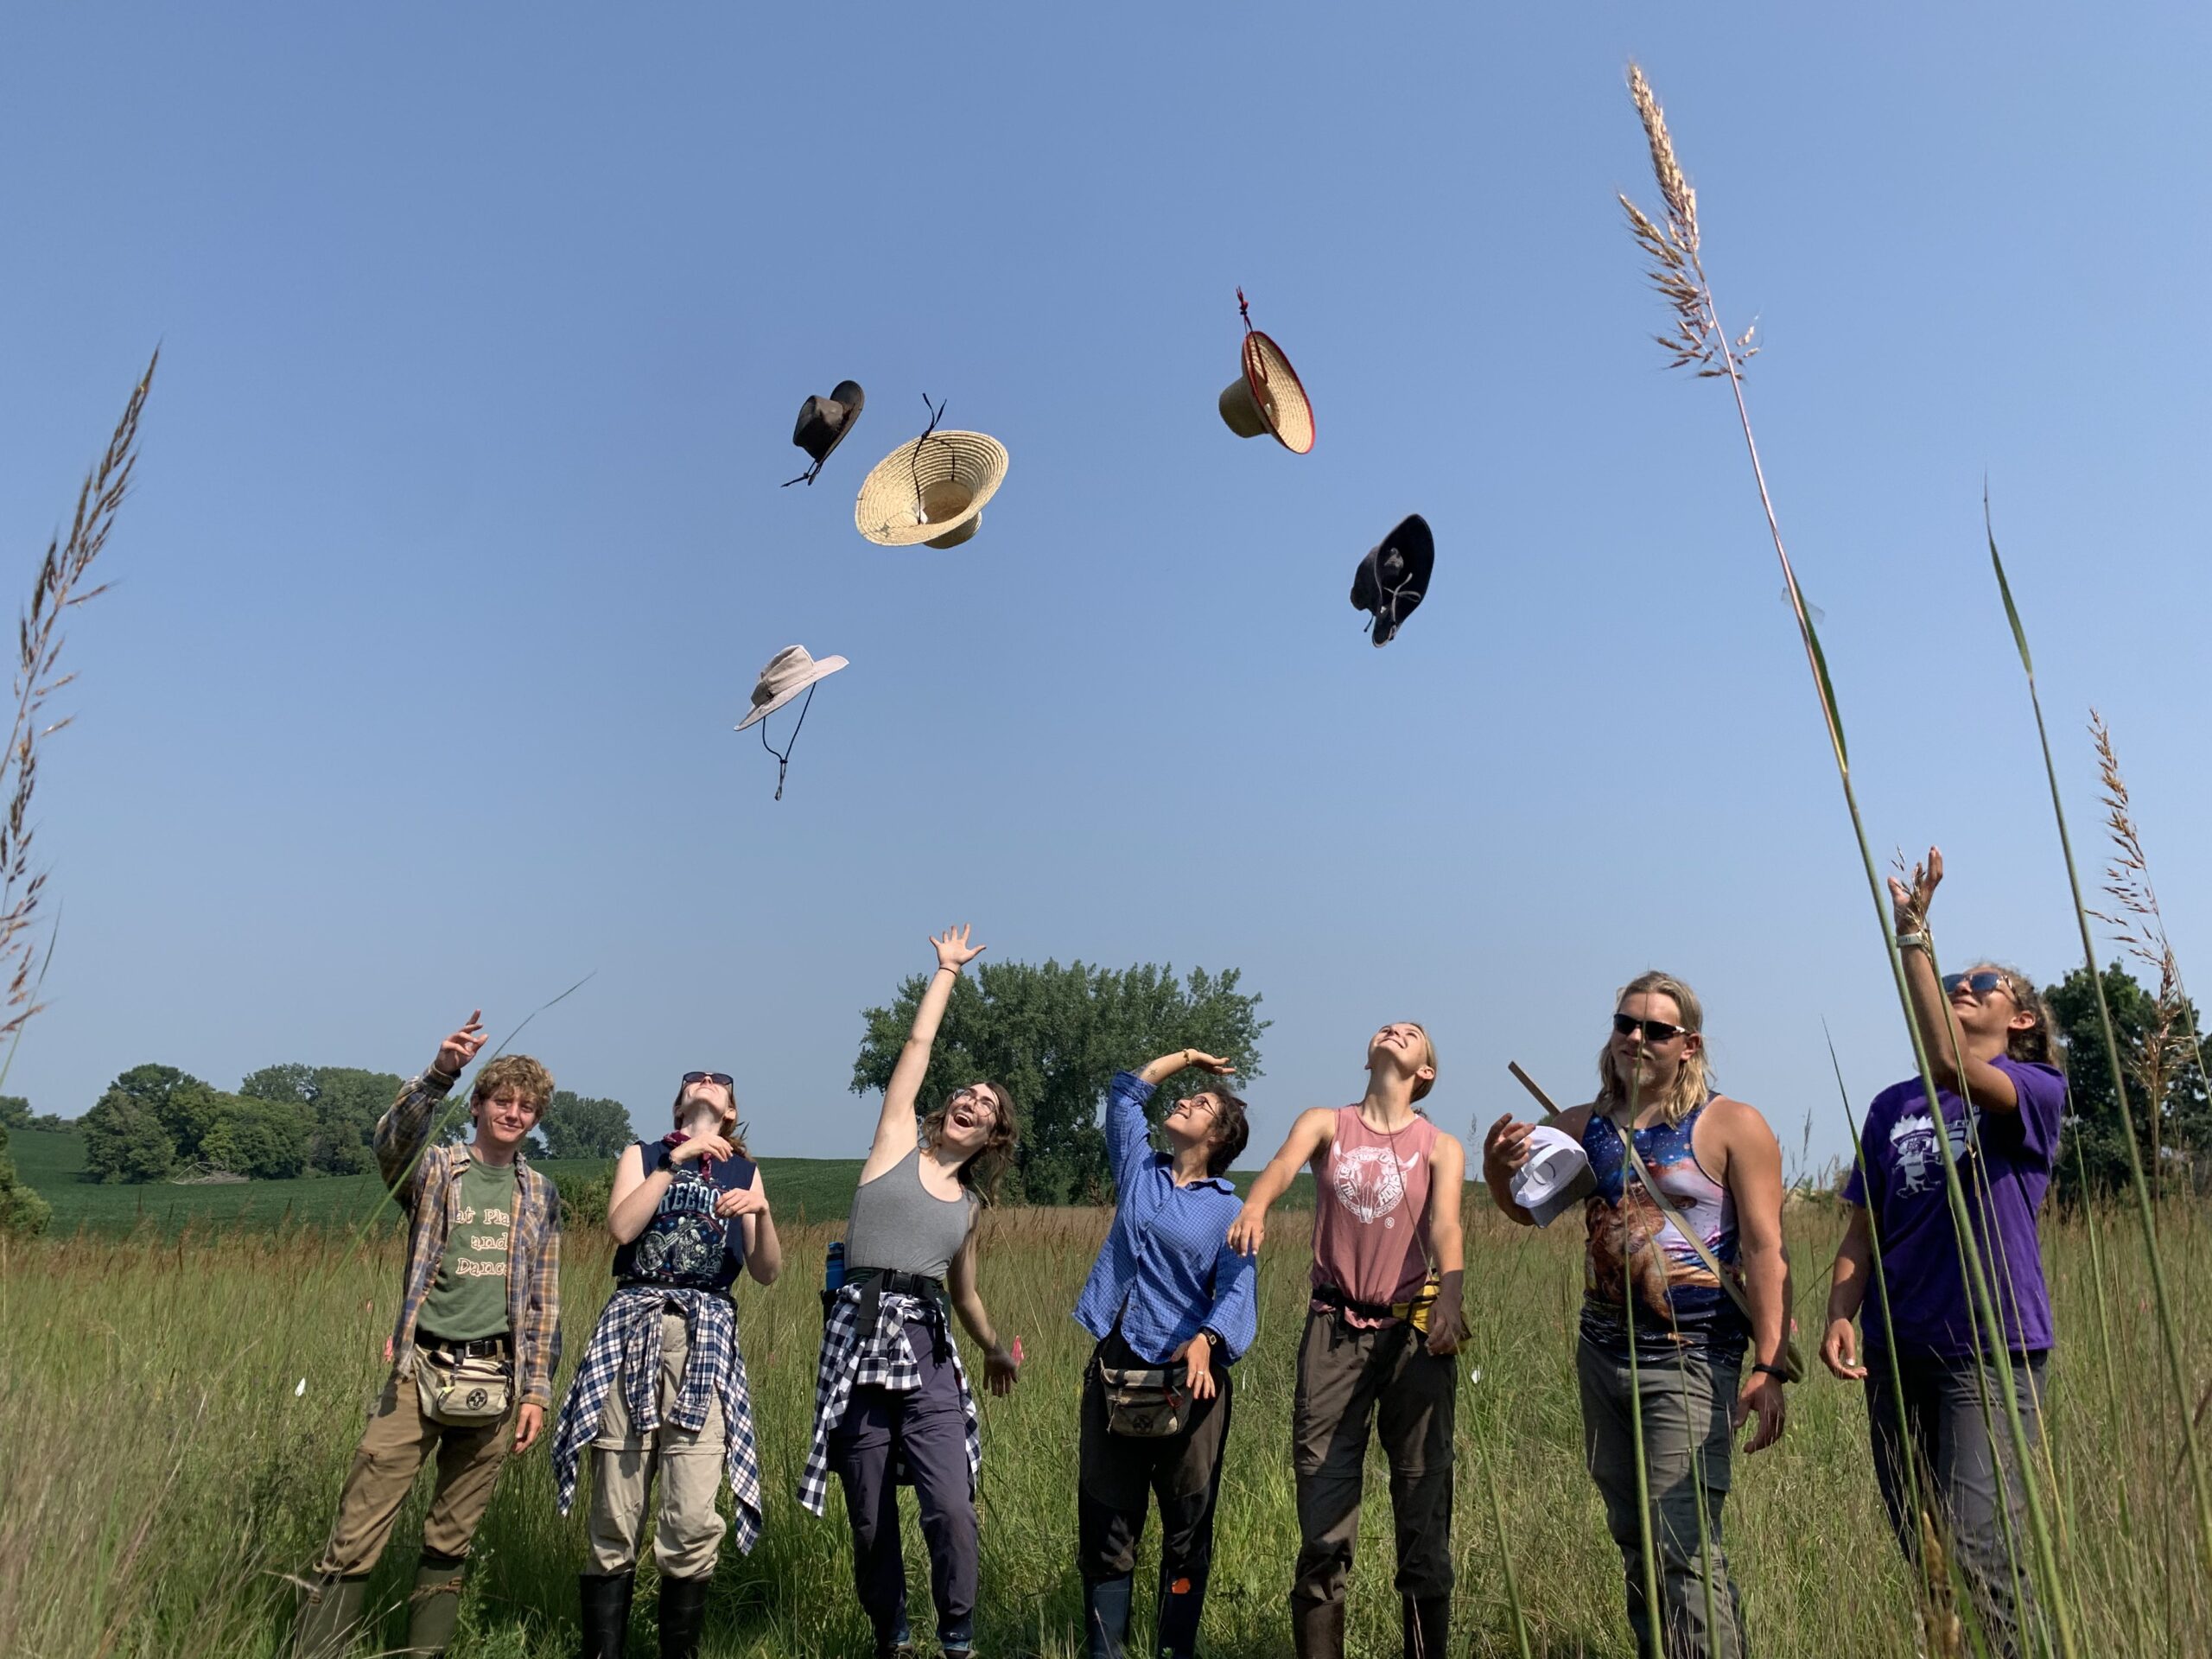 Every year since 1996, Team Echinacea members record flowering phenology, taking measuring data and harvest heads of thousands of Echinacea angustifolia plants in common garden experiments. These experimental plots are prairie restorations and abandoned agriculture fields that are managed as grassland habitat. Some plots have multiple ongoing experiments within. Currently, the Echinacea Project currently has 10 established experimental plots. This project status report will contain updates on experimental plots 1, 2, 4, 5 and 8, as well as management updates for all plots. Specific reports for the remaining experimental plots can be found on separate posts including Amy Dykstra’s plot (exPt03), the hybrid plots (exPt06, exPt07, exPt09), and the West Central Area common garden (exPt10). exPt01: Experimental plot 1 was first planted in 1996 (cleverly termed the 1996 cohort), and has been planted with nine other experiments in subsequent years, with the most recent planting being Amy Waananen’s inter-remnant crosses. It is the largest of the experimental plots, with over 10,000 planted positions; experiments in the plot include testing fitness differences between remnants (1996, 1997, 1999), quantifying effects of inbreeding (inb1, inb2), and assessing quantitative genetic variation (qgen1). There are also a number of smaller experiments in it, including fitness of Hesperostipa spartea, aphid addition and exclusion, and pollen addition and exclusion (the last experiment was continued the summer of 2023 and will have separate update posts). In 2023, we visited 3,699 of the 10,992 positions planted and found 3,118 alive. 560 plants were classified as “flowering” in exPt01 this year. This is a little less than half of the plants that flowered in summer 2022 (1,111) – an interesting note considering exPt01 was burned the spring of both 2022 and 2023. In summer 2023, we harvested 796 total Echinacea heads in exPt01. We also added 270 additional staples to the experimental plot this year, signifying positions were a living plant has not been found for over three years. Some numbers for experiments within exPt01 Inb1: The INB1 experiment investigates the relationship between inbreeding level and fitness in Echinacea angustifolia. Each plant in experiment INB1 originates from one of three cross types, depending on the relatedness of the parents: between maternal half siblings; between plants from the same remnant, but not sharing a maternal or paternal parent; and between individuals from different remnants. All individuals were planted in 2001. We continued to measure fitness and flowering phenology in these plants. In 2023, of the original 557 plants in INB1, 85 were still alive. Of the plants that were alive this year, 24 of them were flowering; this count is down from summer of 2022 where 40 of the plants were flowering. qgen: The qGen1 (quantitative genetics) experiment in p1 was designed to quantify the heritability of traits in Echinacea angustifolia. We are especially interested in Darwinian fitness. Could fitness be heritable? During the summer of 2002 we crossed plants from the 1996 & 1997 cohorts of exPt01. We harvested heads, dissected achenes, and germinated seeds over the winter. In the spring of 2003 we planted the resulting 4468 seedlings (this great number gave rise to this experiment’s nickname “big batch”). 1,417 plants in qGen1 were alive in 2023. Of those plants, 298 flowered this summer. Other plots: exPt02: To examine the role flowering phenology plays in the reproduction of Echinacea angustifolia, Jennifer Ison planted this plot in 2006 with 3,961 individuals selected for extreme (early or late) flowering timing, or phenology. Using this phenological data, we explore how flowering phenology influences reproductive fitness and estimate the heritability of flowering time in E. angustifolia. In the summer of 2023, we visited 1,855 positions of the 3,961 positions originally planted. We measured 1,283 living plants, of which 118 were flowering, with a total of 148 flowering heads. In the fall, we harvested 67 heads from exPt02. The large difference between the number of heads and the number harvested has to do with high levels of seed predation, mainly by ground squirrels. Last year, Will, Jennifer, and other members of Team Echinacea published a paper in the American Journal of Botany using data from exPt02 – check it out here! Location: Hegg Lake WMA exPt04: Experimental plot 4 was planted to gauge whether Echinacea from small remnant populations could be genetically rescued via an outcross to larger, more genetically diverse populations. Caroline Ridley and other members planted this plot in 2008. We did not visit exPt04 this year. Location: Hegg Lake WMA exPt05: The only experimental plot planted at Staffanson Prairie Preserve (SPP), exPt05, was planted to compare progeny of maternal plants from burned and unburned sections of SPP. There were 2800 plants planted originally, but high mortality made it impractical to visit the plot row-by-row. Now, we and treat the plot like demography. We use our survey-grade GPS to find plants in exPt05 that have previously flowered and add more plants to the stake file if new plants in the plot flower. In 2023 we found 11 living plants, none of which were flowering! We did locate one new flowering plant within the plot boundaries. Location: Staffanson Prairie Preserve exPt08: Team Echinacea established quantitative genetics experiments to quantify additive genetic variance of fitness in Echinacea, with the idea that we can estimate evolutionary potential of study populations. The maternal parents of qGen2 and qGen3 are plants in the 1996, 1997, and 1999 cohorts. These plants were crossed with pollen from plants in remnants to produce seed for qGen2 and qGen3, which now inhabit exPt08. Originally, 12,813 seeds were sown in the common garden. Seeds from the same cross (shared maternal and paternal plants) were sown in meter-long segments between nails. A total of 3,253 seedlings were originally found, but only 385 plants were found alive in 2023. There were 15 flowering plants in 2023, and 15 heads. On a side note, one additional flowering plant was found in t-plot, and we harvested three heads from that. Location: Wagenius property Experimental plot management:
Details
Things are movin’ and groovin’ in the lab at the Chicago Botanic Garden! Now that we’ve wrapped up remnant Echinacea, it’s time to reenter common garden territory. Ah, sweet sweet common garden, where all plants exist neatly* on a grid unlike the unruly remnants. One of the main things we’ve been tackling is cleaning the 2022 common garden heads. There are 2,116 heads to be cleaned and we’ve already cleaned 561 (or ~27%) of them! Wow, amazing progress! The only remaining and 3 additional bags from 2020. Once those are done, we’re caught up from the backlog that COVID augmented. As for other steps in the ACE process… 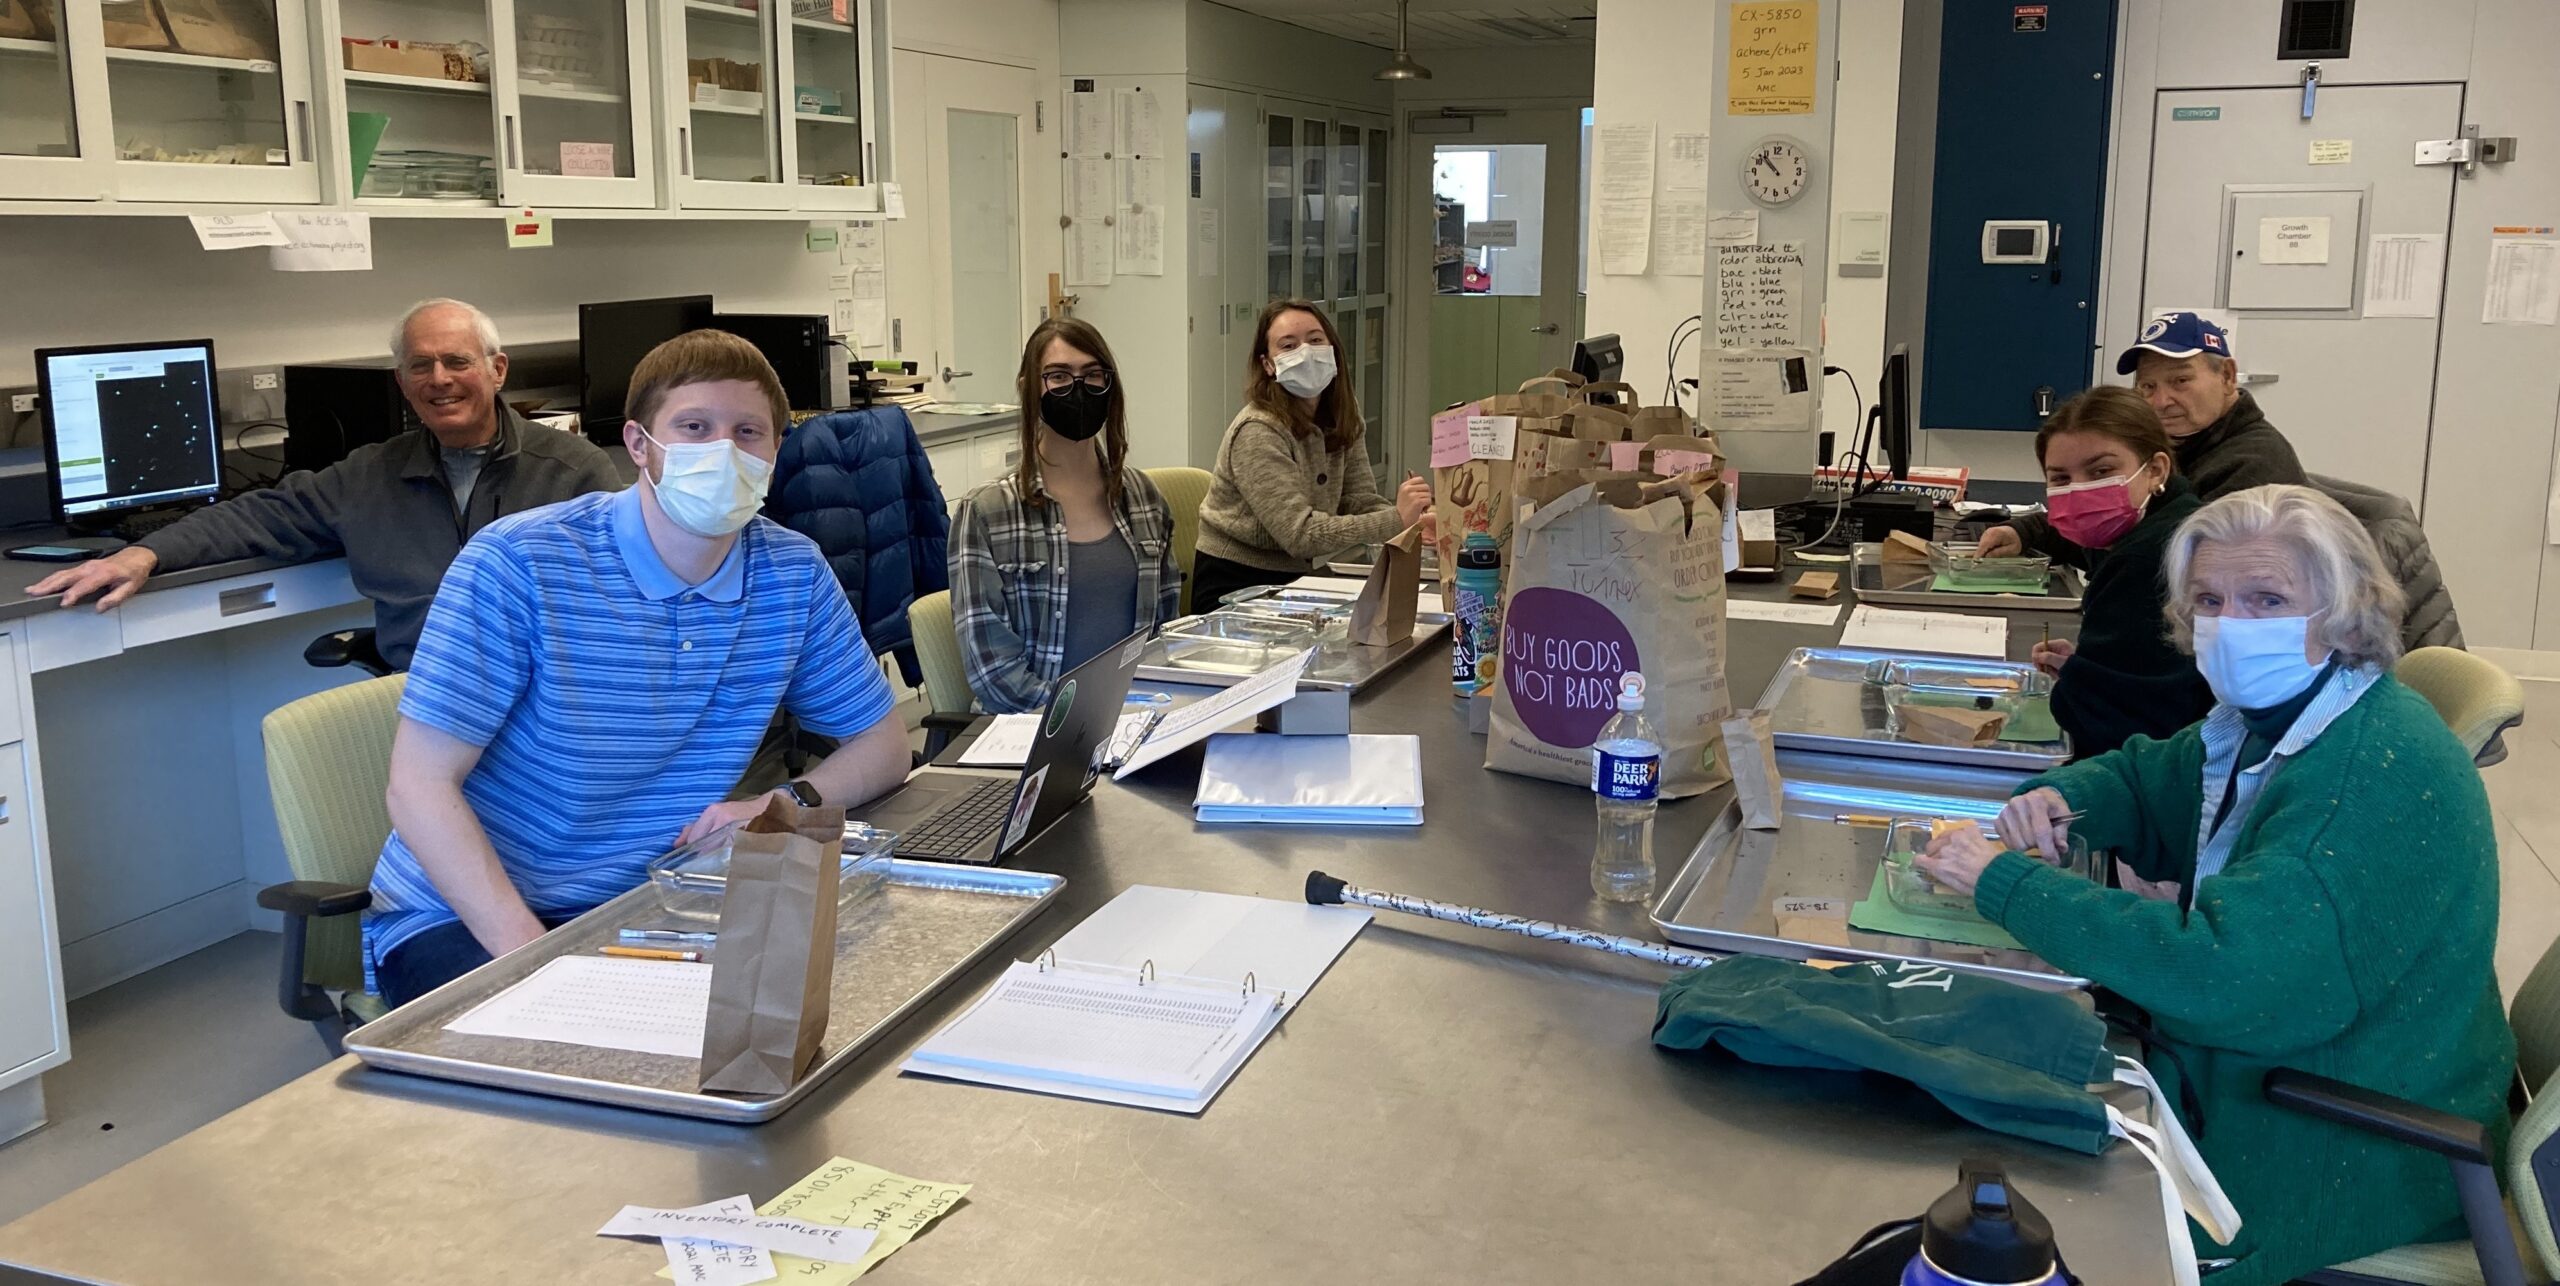 After cleaning comes rechecking, and we’ve had students working on rechecking Echinacea heads from experimental plot 1 in 2019 and 2020. Once these have been rechecked, we’ve got scan-master volunteer Marty prepare our achenes for uploading to the ACE website! Our volunteers have also been catching us up on counting from 2017 through 2019 to get data ready for Wyatt’s masters thesis! I won’t spoil what she’s investigating, but just know it’s a burning question that I’m stoked about! Alex and I have also been attempting to clean up the Cheerios boxes that line our lab window. These boxes contain achenes from the past 20 years and many different experiments, all at different stages of the ACE process. Volunteers have started assembling some of the achenes into x-ray sheets for the years 2017 and 2018. We also had Priti help us inventory boxes from 2016. We took seeds out of these boxes for our seed addition experiment, but were unsure what achenes actually remained. These seeds did not germinate, so we will put them in storage. However, we have other seeds that are still viable, so we are hoping to freeze them and put them in the seed bank here at CBG! 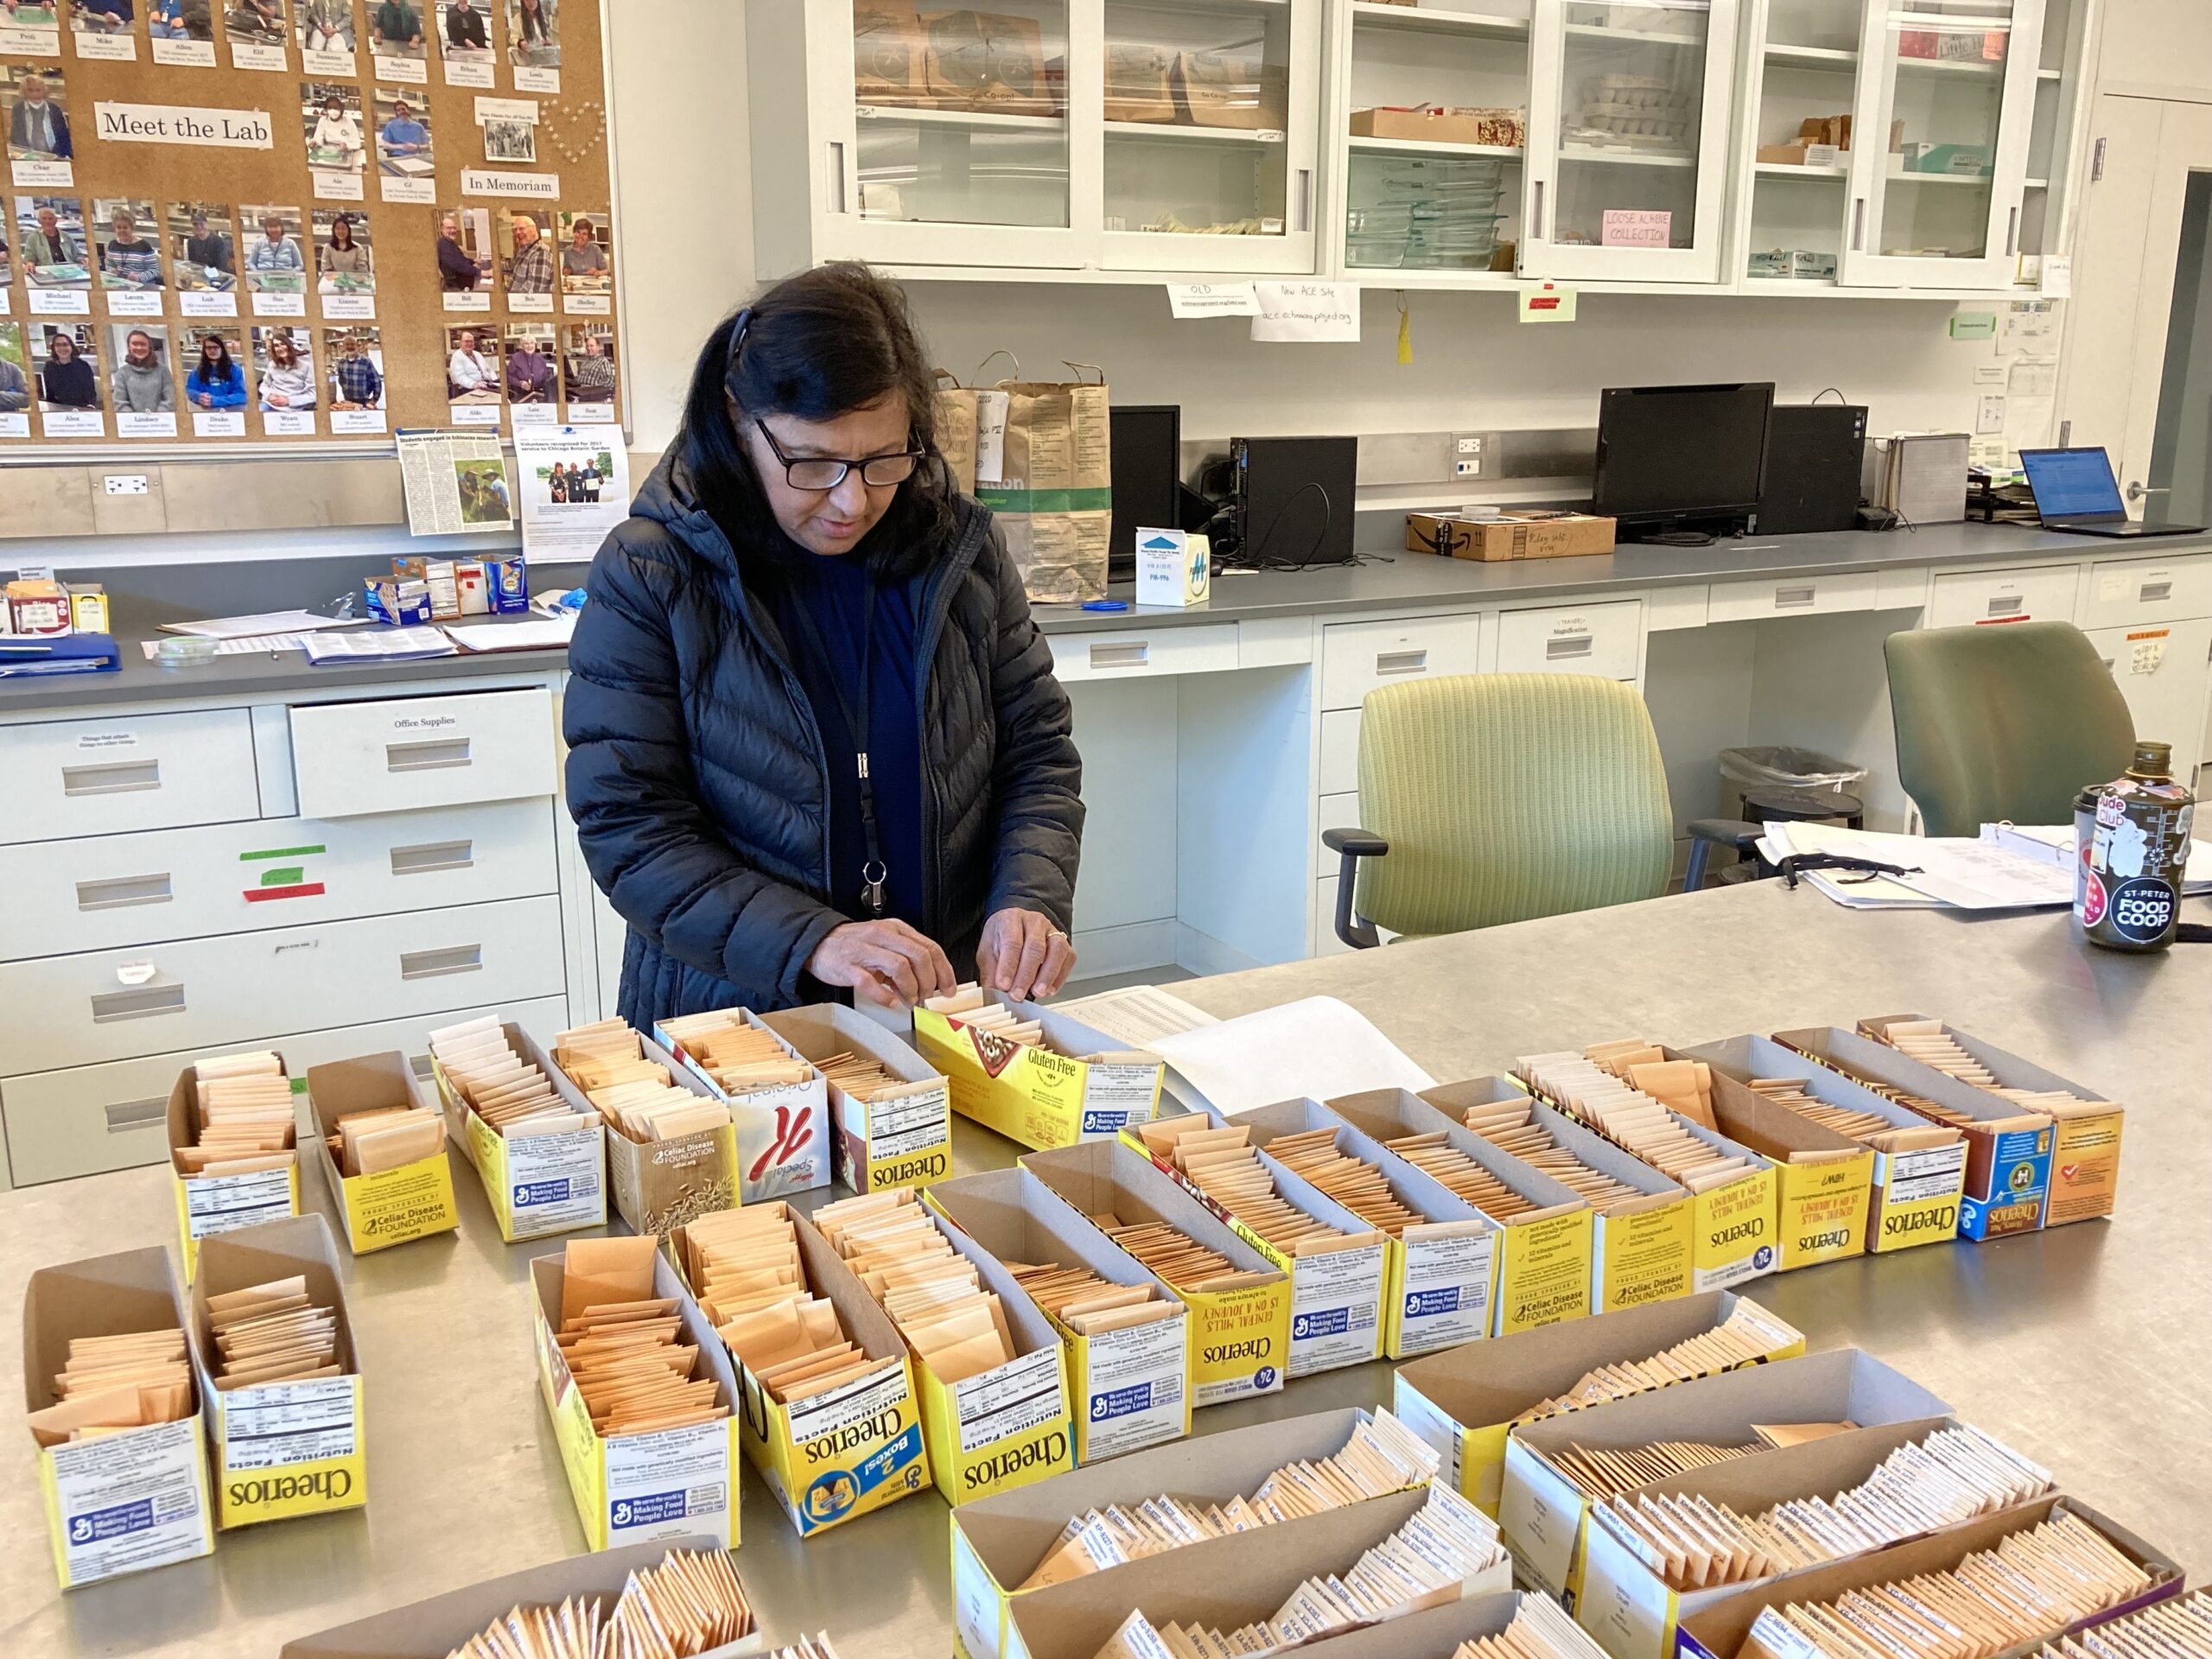 We’re hoping to keep moving forward this spring with all steps of the ACE process, and create an efficient system for taking data off the ACE counting and classifying website! *it would be neatly if it weren’t for those meddling rogue plants! |
||||
|
© 2026 The Echinacea Project - All Rights Reserved - Log in Powered by WordPress & Atahualpa |
||||