|
|
 In 2017 only 2% of the surviving members of the 1996 cohort flowered! In 2017 only 7 plants flowered of the surviving 284 plants in the 1996 cohort. That means that 44% of the original plants are surviving and only 2% of the living individuals flowered! Five percent of living individuals flowered in 2016. In contrast, 45% of living plants flowered in 2015, followed by 37%, 34%, and 40% from 2014 back to 2012. We found that of the original 646 individuals, 284 were alive in 2017, only 7 fewer than last year. We are not sure why so few plants flowered this year. It’s possible that lack of fire in the plot influenced flowering rates. This plot was due for a prescribed burn in spring 2017, but weather and scheduling conflicts kept us from burning.
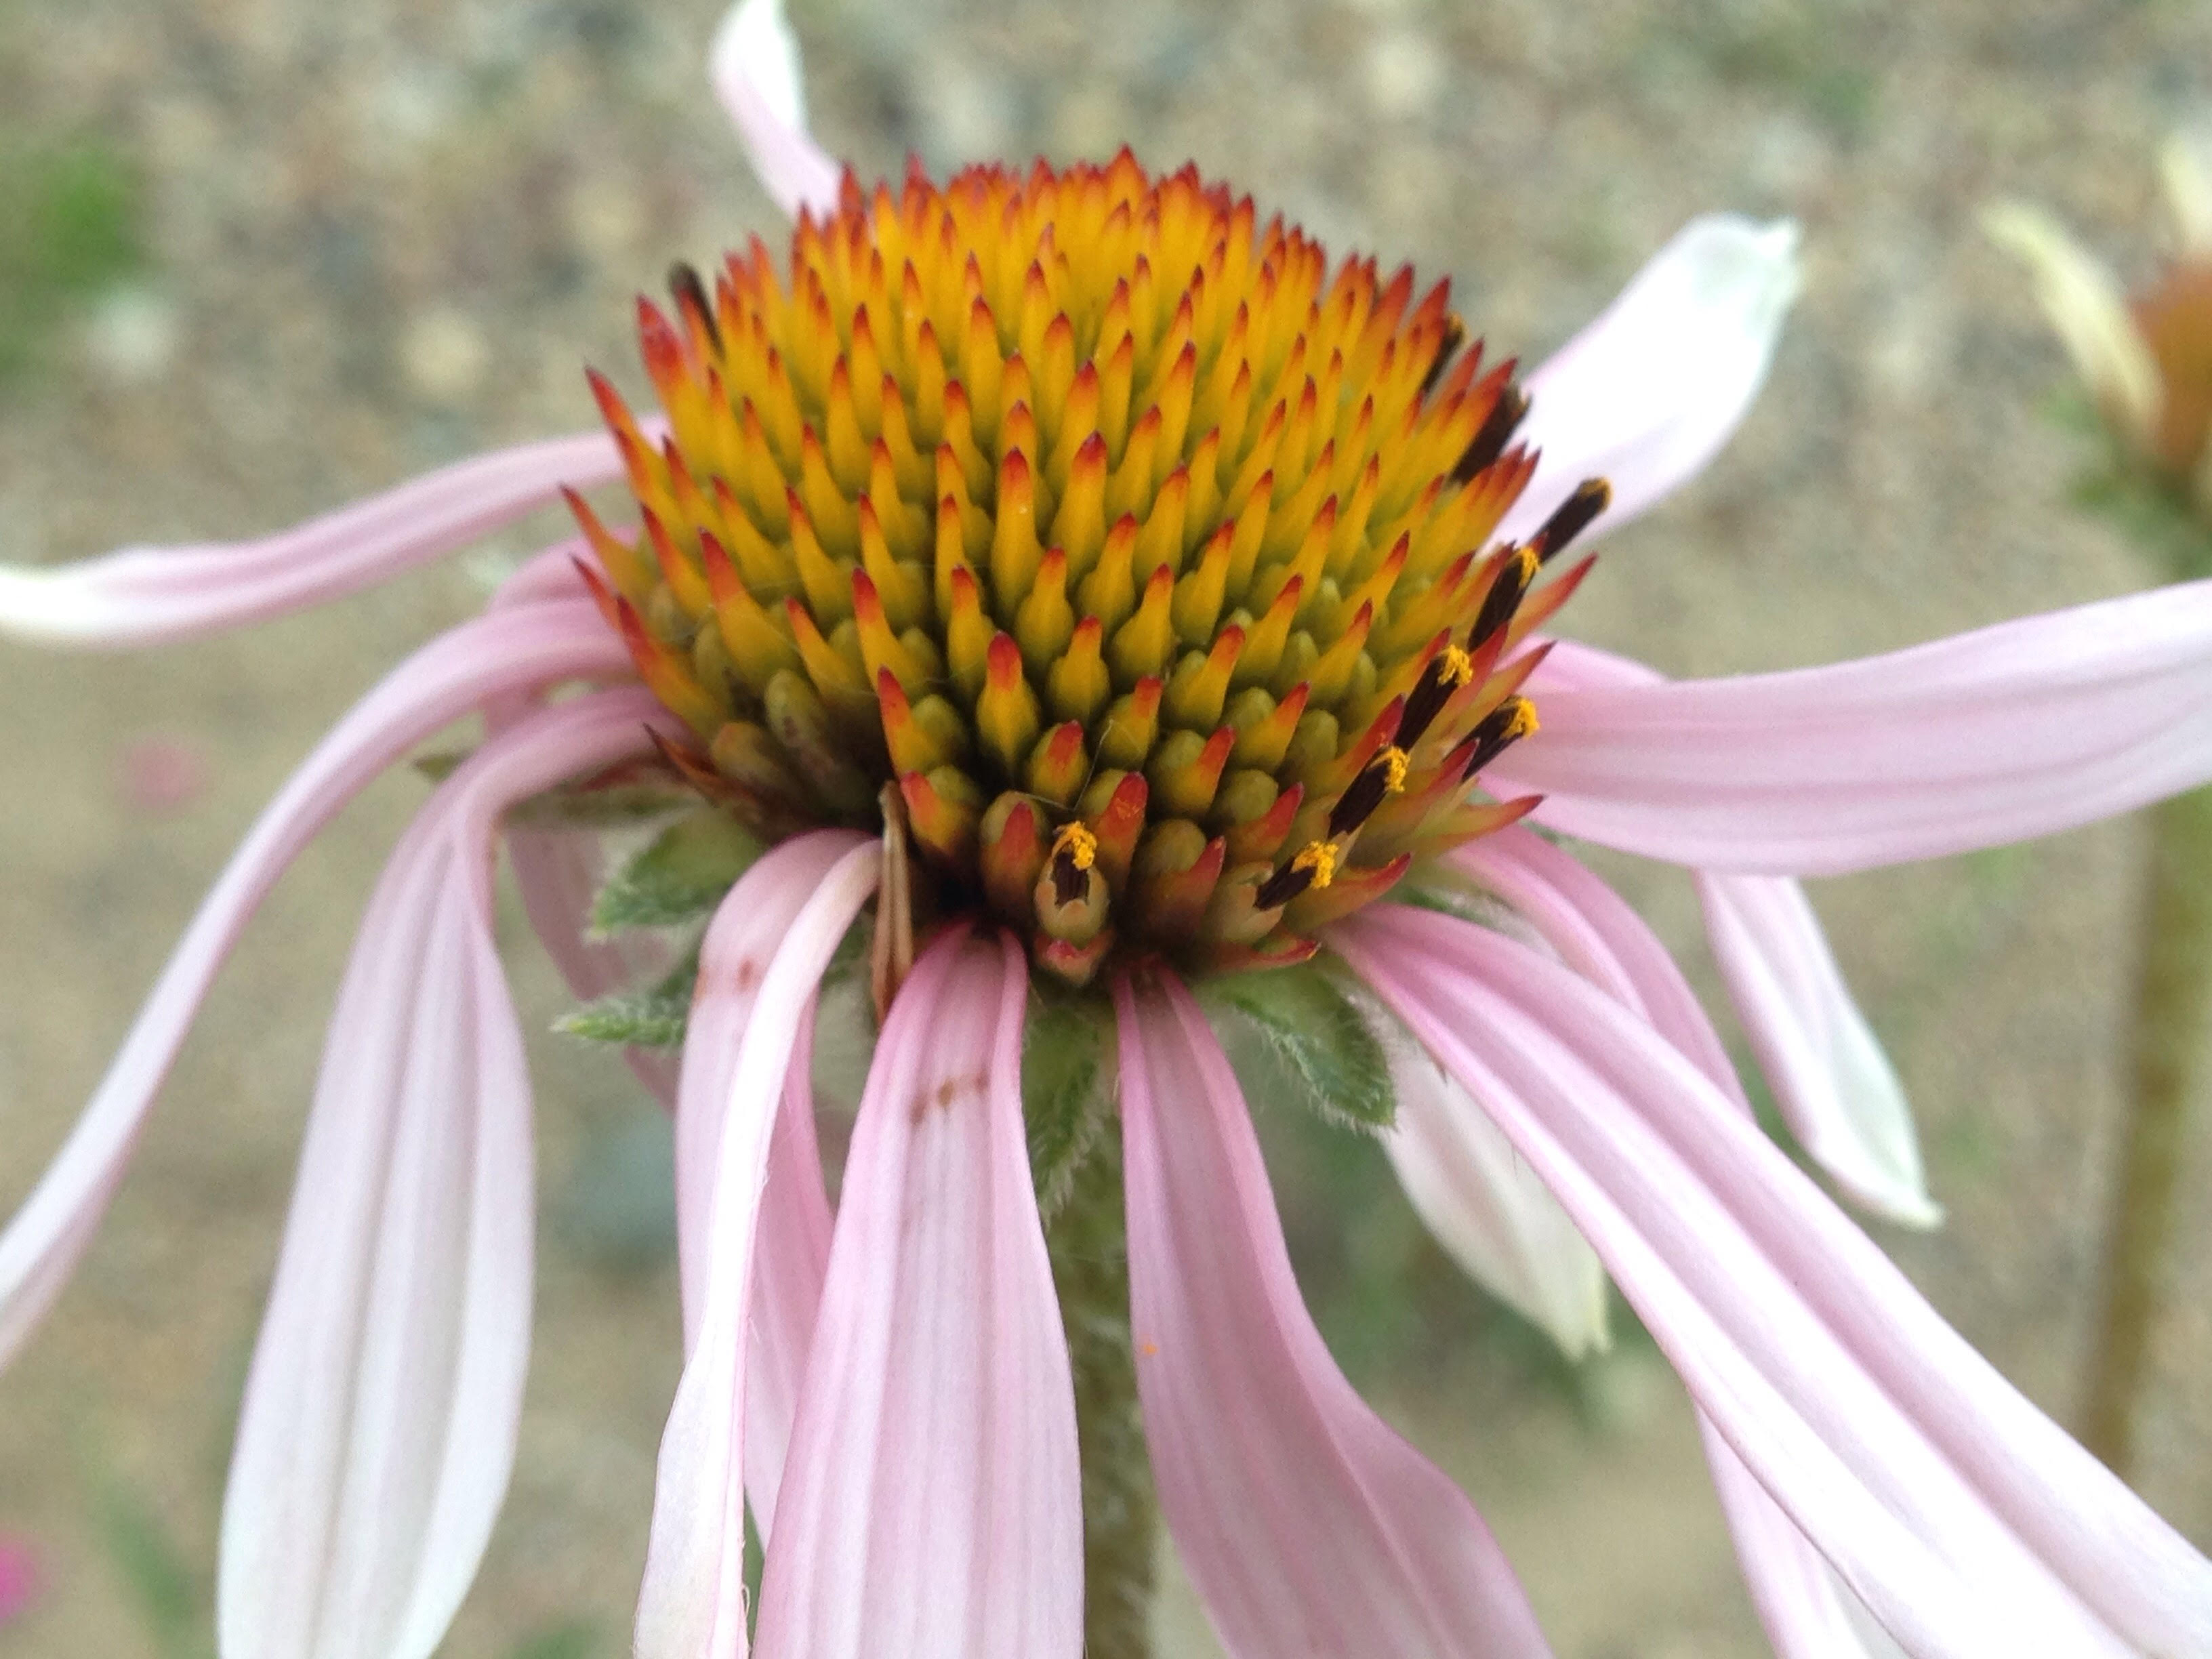
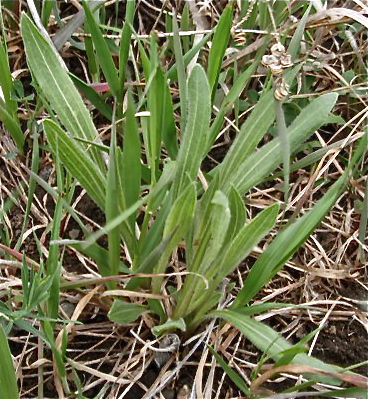
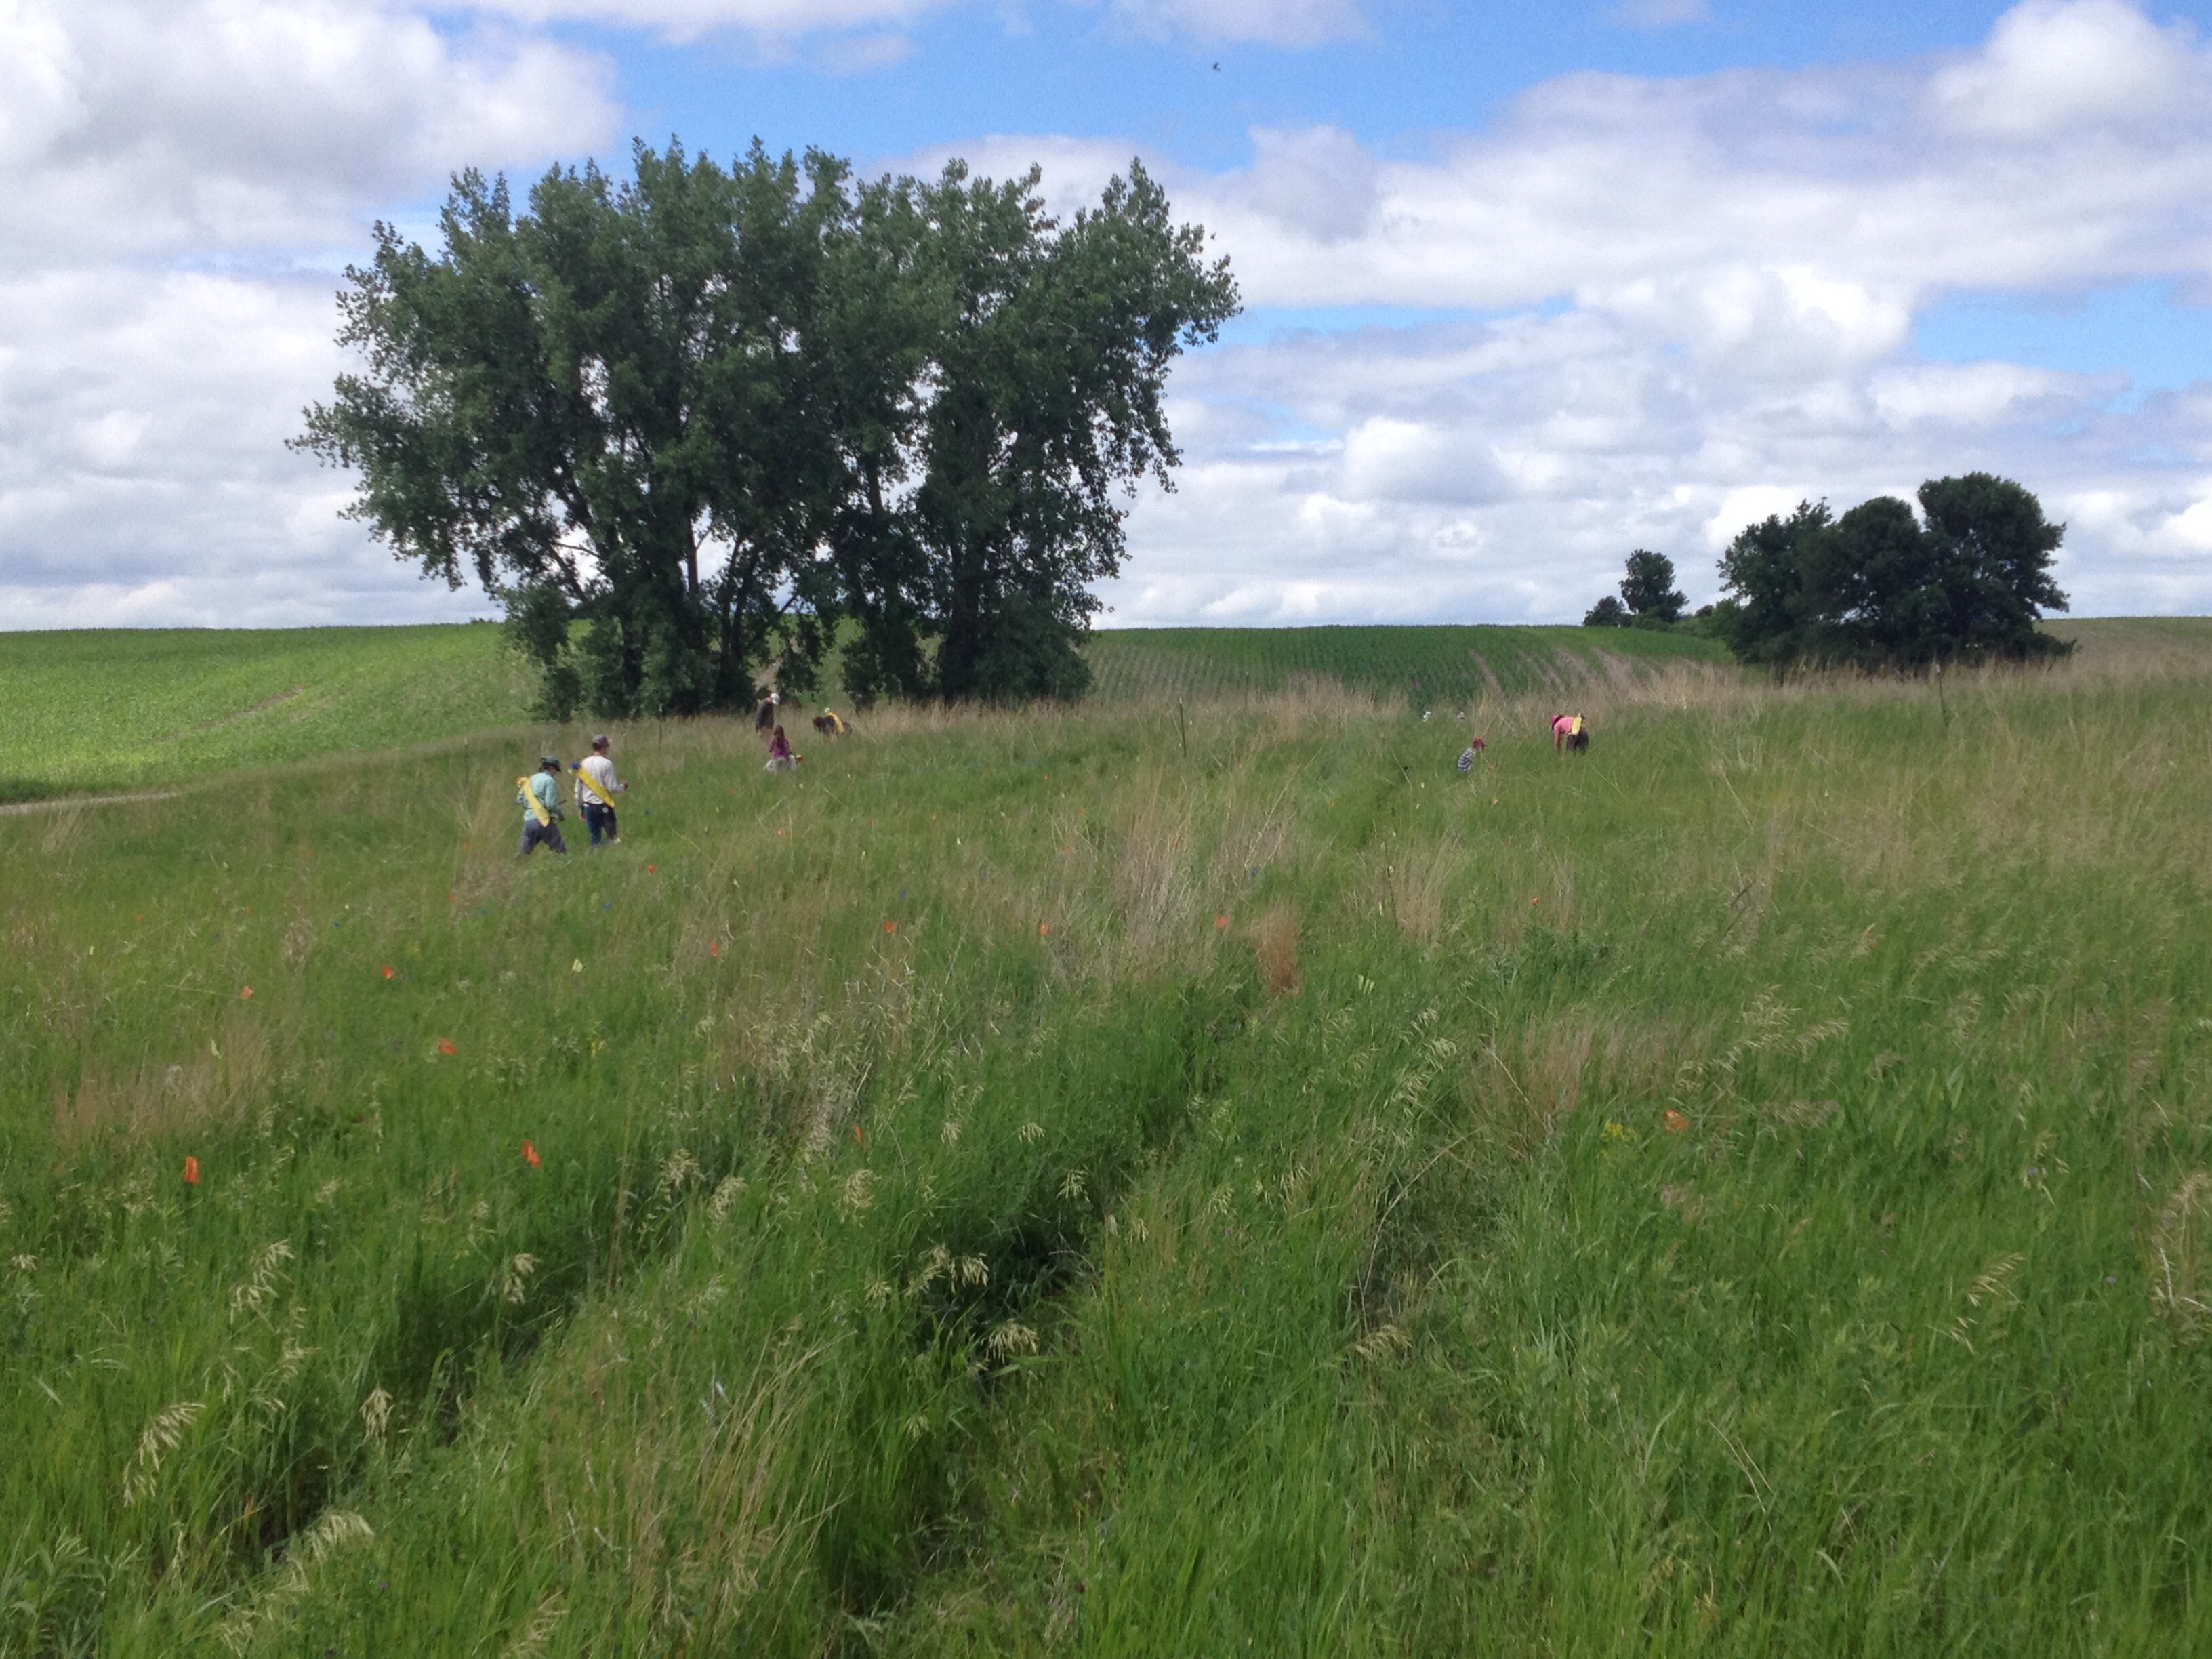
The 1996 cohort has the oldest Echinacea plants in experimental plot 1; they are 21 years old. They are part of a common garden experiment designed to study differences in fitness and life history characteristics among remnant populations. Every year, members of Team Echinacea assess survival and measure plant growth and fitness traits including plant status (i.e. if it is flowering or basal), plant height, leaf count, and number of flowering heads. We harvest all flowering heads in the fall, count all achenes, and estimate seed set for each head in the lab.
Start year: 1996
Location: Experimental plot 1
Overlaps with: phenology in experimental plots, qGen3, pollen addition/exclusion
Physical specimens:
- We harvested 8 heads. At present, they await processing in the lab to find their achene count and seed set.
Data collected:
- We used Visors to collect plant growth and fitness traits—plant status, height, leaf count, number of flowering heads, presence of insects—these data have been added to the database
- We used Visors to collect flowering phenology data—start and end date of flowering for all individual heads—which is ready to be added to the exPt1 phenology dataset
- Eventually, we will have achene count and seed set data for all flowering plants (stay tuned)
Products:
You can find more information about the 1996 cohort and links to previous flog posts regarding this experiment at the background page for the experiment.
 We observed that 95% surviving members of the 1996 cohort were basal in 2016 The oldest Echinacea plants in experimental plot 1 are 20 years old. They are part of a cohort planted in 1996 in a common garden experiment designed to study differences in fitness and life history characteristics of remnant populations. Stuart sampled about 650 seeds (achenes) from eight remnant populations in and near Solem Township, representing the range of modern prairie habitat from small patches along roadsides to a large nature preserve. In 1996, he transplanted seedlings on a 1m x 1m grid, randomly assigning the location of each individual.
Every year, members of Team Echinacea assess survival and measure plant growth and fitness traits including plant status (i.e. if it is flowering or basal), plant height, leaf count, and number of flowering heads. We harvest all flowering heads in the fall and obtain their achene count and seed set in the lab.
Only 15 plants from the 1996 cohort were flowering this year. We were very curious to know if this small number was a result of a low rate of flowering or due to high mortality in the cohort. We found that of the original 650 individuals, 291 were alive in 2016, only 13 fewer than last year. That means only 5% of living individuals flowered. In contrast, 45% of living plants flowered last year (and 37% in 2014, 34% in 2013, 40% in 2012). We’re not sure why so few plants flowered this year; it’s possible that individuals flower less as they age, but we also observed low rates of flowering in younger cohorts in experimental plot 1, suggesting that environmental factors may also be responsible.
Start year: 1996
Location: Experimental plot 1
Overlaps with: phenology in experimental plots, qGen3, pollen addition/exclusion
Physical specimens:
- We harvested all 17 heads and at present they await processing at the lab to find their achene count and seed set.
Data collected:
- We used Visors to collect plant growth and fitness traits—plant status, height, leaf count, number of flowering heads, presence of insects—and it has been added to the database (?)
- We used Visors to collect flowering phenology data—start and end date of flowering for all individual heads—which is ready to be added to the exPt1 phenology dataset
- Eventually, we will have achene count and seed set data for all flowering plants (stay tuned)
Products:
You can find more information about the 1996 cohort and links to previous flog posts regarding this experiment at the background page for the experiment.
The oldest Echinacea plants in experimental plot 1 will turn 20 this year. They are part of the 1996 cohort, which was planted in a common garden experiment designed to study differences between remnant populations and assess life history traits as they grew. Stuart sampled about 650 seeds (achenes) from eight remnant populations in and near Solem Township, representing the range of modern prairie habitat from small patches along roadsides to a large nature preserve. In 1996, he transplanted seedlings on a 1m x 1m grid, randomly assigning the location of each individual.
Every year, members of Team Echinacea assess survival and measure plant growth and fitness traits including plant status (whether it is flowering or basal), plant height, leaf count, and number of flowering heads. We harvest all flowering heads in the fall and obtain their achene count and seed set in the lab.
Of the original 650 individuals, 304 were alive in 2015. This year, 136 individuals from the 1996 cohort were flowering with a total of 303 heads. At present, these heads are in the lab where they await processing to find their achene count and seed set. We used 31 plants (45 flowering heads) from the 1996 cohort as maternal plants in crosses for the most recent heritability of fitness experiment (qGen3). We also used five plants from the 1996 cohort (8 heads total) as part of the pollen exclusion and addition experiment. We covered their heads with pollinator exclusion bags for the duration of the season.
Read more posts about this experiment.
 Stuart passes out pollen to Gina and Ben for crosses between 1996 cohort plants in the qGen3 experiment Start year: 1996
Location: Experimental plot 1
Overlaps with: phenology in experimental plots, qGen3, pollen addition/exclusion
Products:
Experimental plot 1 (P1) encompasses 11 different experiments originally planted with a total of 10673 Echinacea individuals. These experiments include long-term studies designed to compare the fitness of Echinacea from different remnant populations (“EA from remnants in P1”), examine the effects of inbreeding on plant fitness (“INB” and “INB2”), and explore other genetic properties of Echinacea such as trait heritability (“qGen”). In 2014, Team Echinacea measured plant traits for the 5409 Echinacea plants that remain alive and followed the daily phenology of 567 flowering heads. Echinacea began producing florets on July 1 and continued flowering in P1 until August 24. The data collected in 2014 will allow us to estimate the heritability of various traits and assess the lifetime fitness of plants from the numerous experiments.
|
Experiment |
Year planted |
# alive |
# flowering |
# planted |
| 1 |
1996 |
1996 |
314 |
115 |
650 |
| 2 |
1997 |
1997 |
270 |
57 |
600 |
| 3 |
1998 |
1998 |
32 |
3 |
375 |
| 4 |
1999 |
1999 |
542 |
106 |
888 |
| 5 |
1999S |
1999 |
297 |
37 |
418 |
| 6 |
SPP |
2001 |
318 |
14 |
797 |
| 7 |
Inbreeding |
2001 |
221 |
15 |
557 |
| 8 |
2001 |
2001 |
170 |
11 |
350 |
| 9 |
Monica 2003 |
2003 |
28 |
3 |
100 |
| 10 |
qGen |
2003 |
2501 |
122 |
4468 |
| 11 |
INB2 |
2006 |
716 |
41 |
1470 |
Start year: 1996
Location: experimental plot 1
Products:
Overlaps with: aphid addition exclusion, Pamela’s functional traits, pollen longevity, pollen addition exclusion
Here is the protocol that we plan to use for measuring in 2012:
2012.measureFieldProtocolPlan.htm
Here’s a link to the protocol that we used for measuring CG1 in 2011:
2011.measureFieldProtocolReal.htm
In 2012 we plan to measure in “review mode” (as we did for CG2 in 2011) — all location records will be on the Visors with Status=”Staple” or “Skip” populated. We should not spend as much time searching for plants that have not been present for 3 or more years.This should speed up measuring. I’ll post the planned 2012 protocol next.
Now that we’ve inventoried all the CG1 heads, I checked to see just how many we have. There were about 3009 twist-ties put out, and 119 heads were duds or missing, so our (estimated) total number of good heads is about 2890.
CG2 had something like 140 heads, but we haven’t inventoried those yet.
Only about 13 heads left to harvest in the common garden experiment! I attached a pdf of listing all heads with no gbag info…
HarvestList2010FinalHarvest.pdf
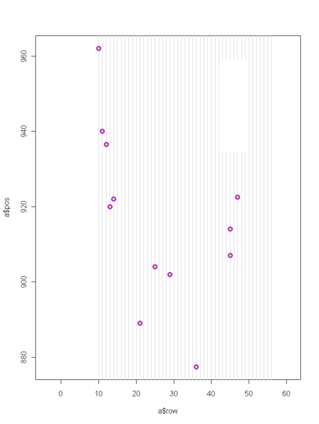
Here’s a map of unharvested head locations in the main experiment (there’s one more head in the 99S garden).

Click to enlarge.
Today we will start measuring Echinacea in the Common Garden. Here is the link to the protocol: CGmeasureprotocol2010.htm
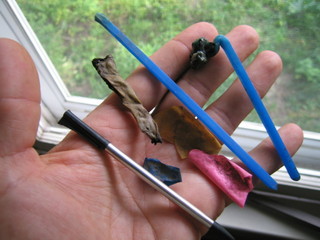
I found a few things besides Echinacea plants, while searching for plants that may have died in the common garden. I found a fossil shell. I gave it to Per and he held on to it for a while but dropped it. Someone else will find it! I found a stylus (for a handspring visor). It’s probably Gretel’s; she lost hers earlier this year. I found a snake skin with an intact top of head–the eyes were transparent-cool! Per gave to Hattie, I think. I found a mouse in a mouse nest (right on top of dead Echinacea leaves from last year). The mouse bounded away. Also, Ruth called while I was searching to say that she had just found the serial cord for the survey station data collector that we couldn’t find–we had been looking for that for a few days. Wahoo! Finally, I emptied my pockets of litter that I had picked up: three pieces of flagging, one melted plastic plug label, and 2 blue plastic cocktail stirrers.

Stuff from Stuart’s pocket: stylus (1), flagging bits (3),
melted plastic plug label (1), blue plastic cocktail stirrers (2)
We are making great progress on annual measurements of plant in the common garden. On Monday we finished measuring all plants (~10000). On Tuesday we finished placing staples at all locations where plants died overwinter in 2007-2008 (>700). Today we made a huge dent in “rechecks.”
Rechecking is when we revisit all the locations where we recorded a “can’t find” and left a flag while measuring. We placed about 1500 flags. About 700 of those “can’t finds” were stapled this year. So, we just verified that staples were in the correct locations and pulled flags. Some locations had staples from previous years that a measurer didn’t find. We pulled flags there too. Then there were the plants that were alive last year. We rechecked those and found quite a few plants. Each time someone found one, they yelled “wahoo” and the rest of us responded with a whoop and a holler.
Shucks, it was fun!! Actually I was burned out by the end. Next year we should plan two 2h sessions instead of one 4h session.
|
|