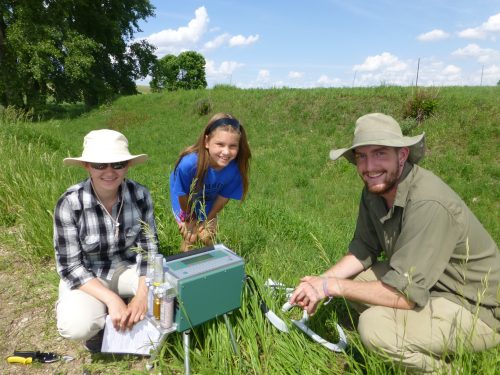
Reina, Hattie, and Mike with the instrument to measure photosynthesis.
In 2016, we continued the INB1 experiment to investigate the relationship between inbreeding level and fitness in Echinacea angustifolia. Each plant in experiment INB1 originates from one of three cross types, depending on the relatedness of the parents: between maternal half siblings; between plants from the same remnant, but not sharing a maternal or paternal parent; and between individuals from different remnants. We continued to measure fitness and flowering phenology in these plants.
This year, of the original 557 plants in INB1, 191 were still alive. Of the plants that were alive this year, 7% were flowering and 24% have never flowered.
Read previous posts about this experiment.
Start year: 2001
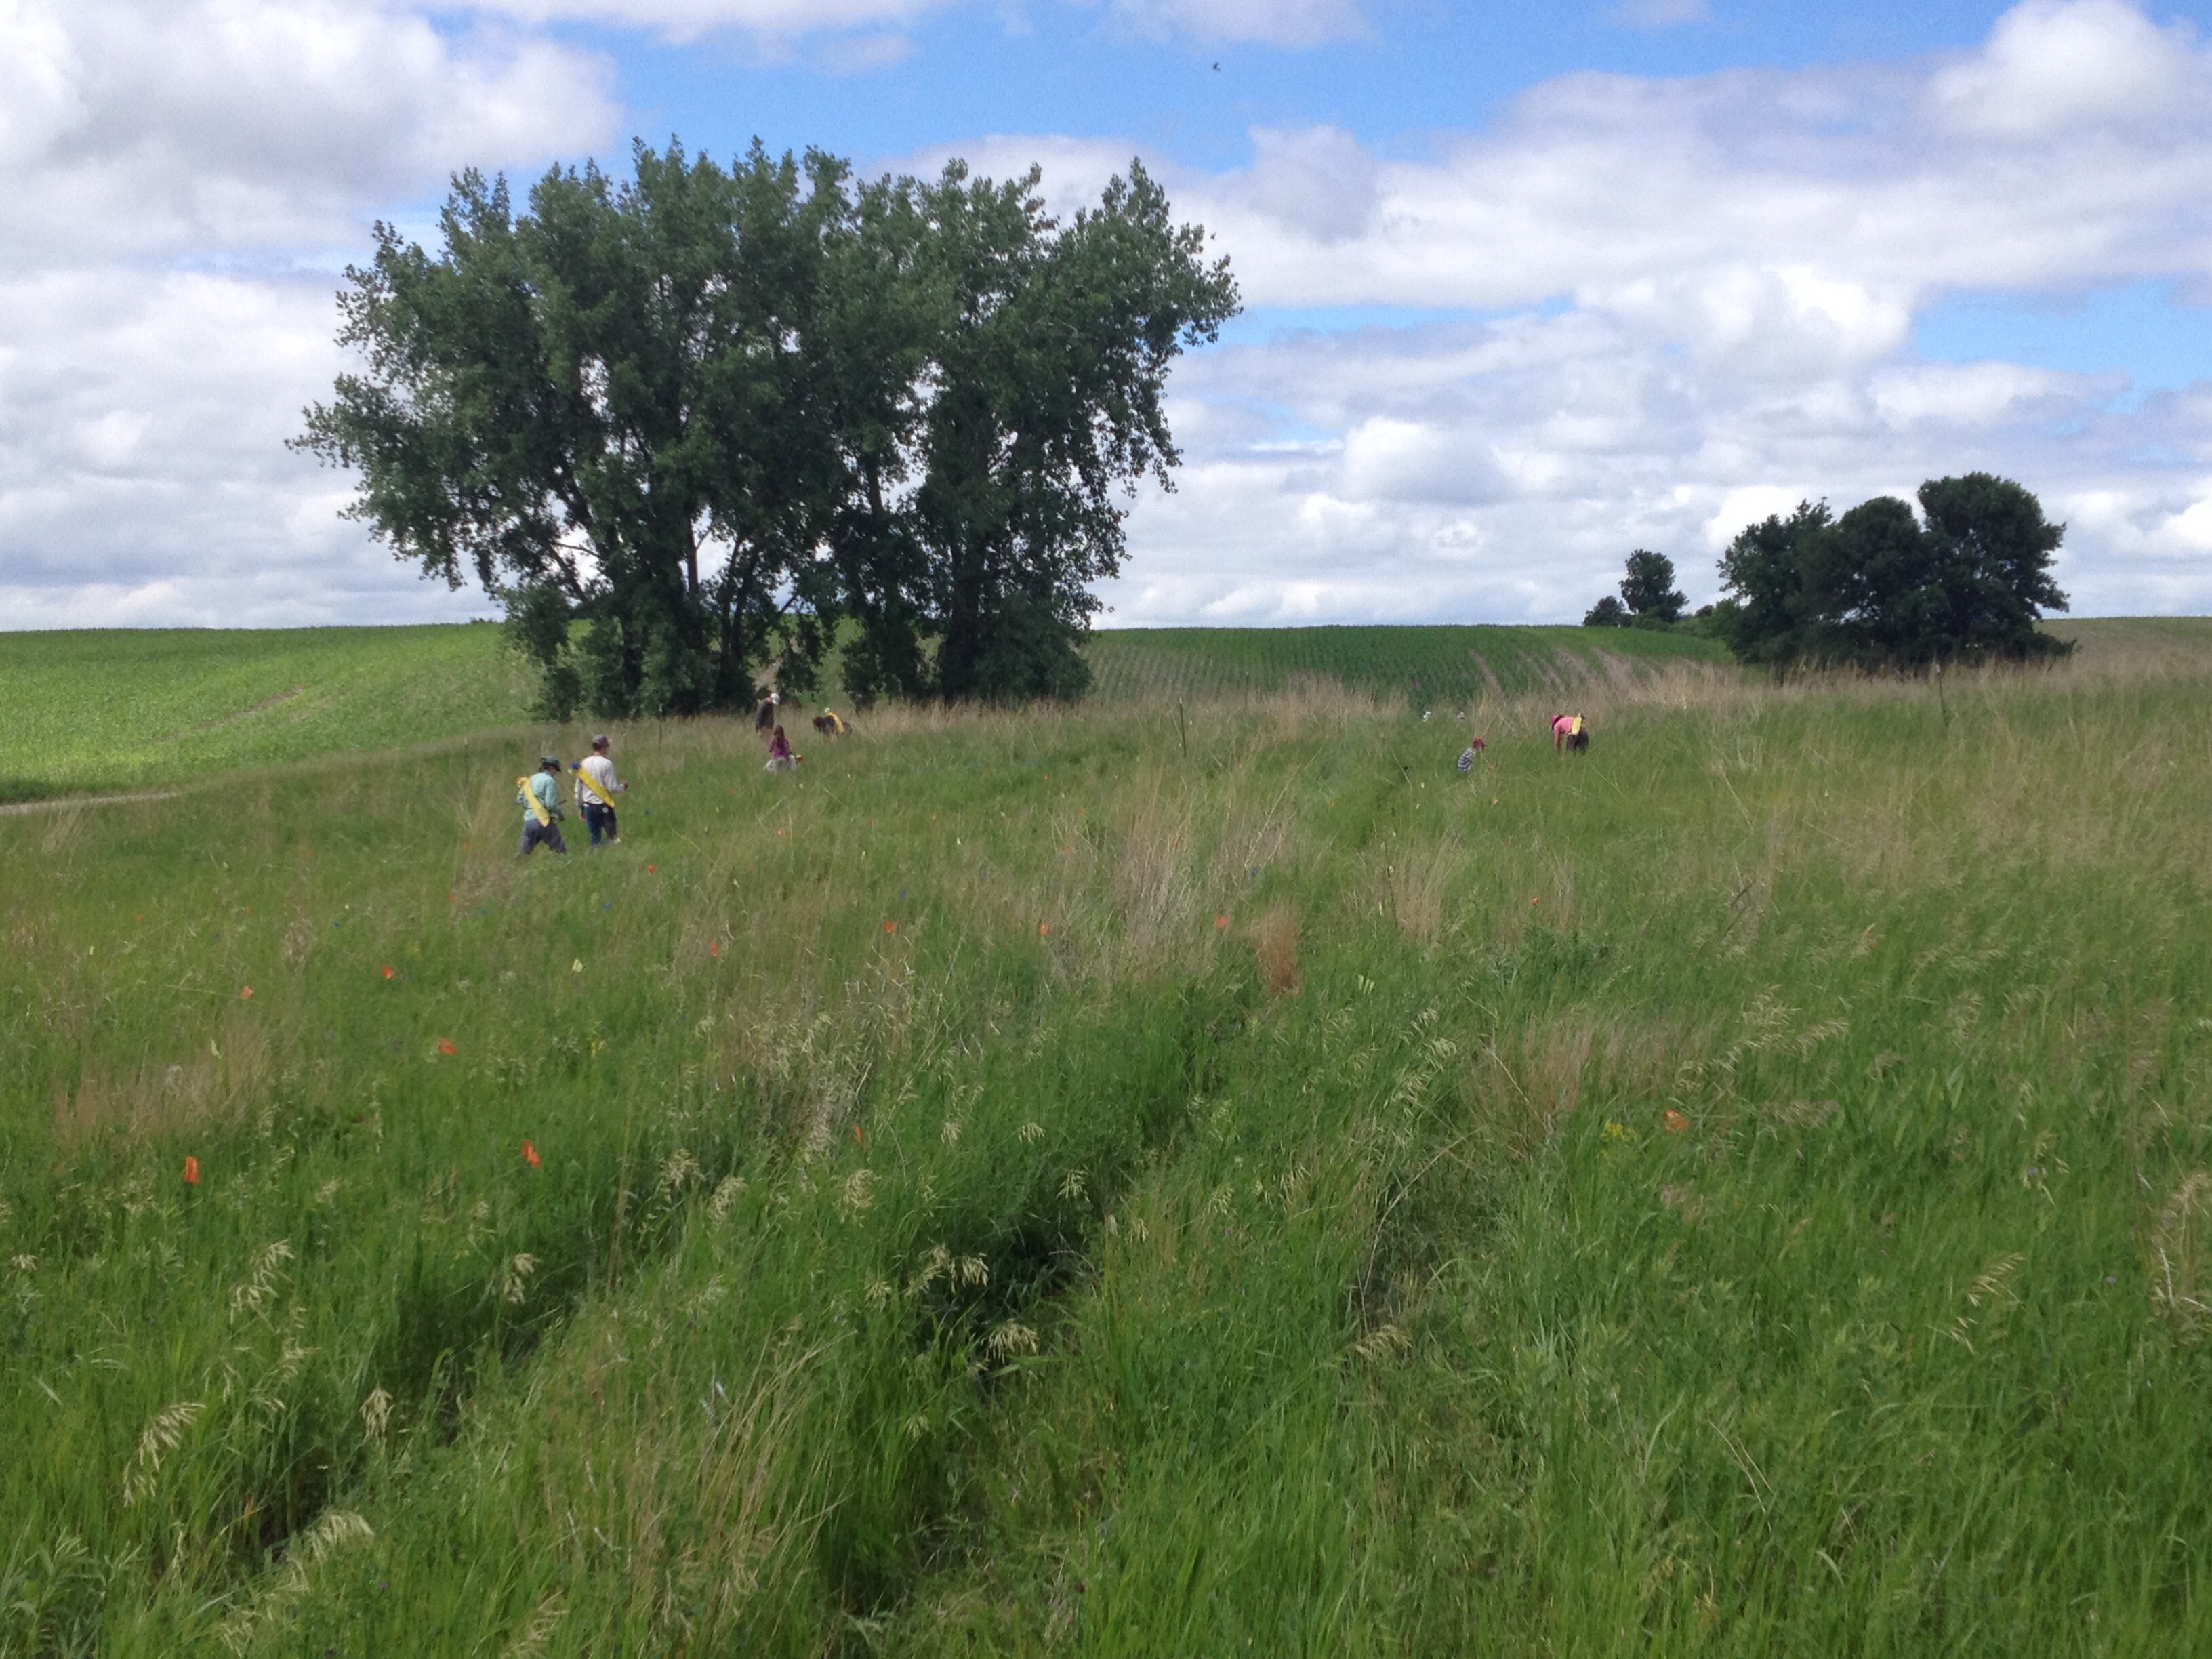
Location: Experimental plot 1
Overlaps with: Phenology and fitness in P1
Physical specimens: We harvested 13 heads from INB1 that will be processed in the lab with other heads harvested from P1.
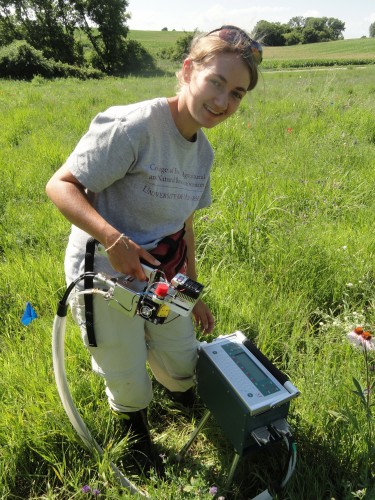
Data collected: We used handheld computers to collect fitness data on all plants in INB1.
Products: The below papers were published in summer 2015:
Kittelson, P., S. Wagenius, R. Nielsen, S. Qazi, M. Howe, G. Kiefer, and R. G. Shaw. 2015. Leaf functional traits, herbivory, and genetic diversity in Echinacea: Implications for fragmented populations. Ecology 96:1877–1886. PDF
Shaw, R. G., S. Wagenius and C. J. Geyer. 2015. The susceptibility of Echinacea angustifolia to a specialist aphid: eco-evolutionary perspective on genotypic variation and demographic consequences. Journal of Ecology 103:809-818. PDF
You can find more information about the Inbreeding experiment–INB1 and links to previous flog posts regarding this experiment at the background page for the experiment.