let me know of you can open this one..
|
||||
|
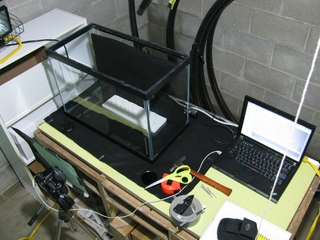
So I think I have my basic setup for the time-lapse photography for checking out those stipa awns. Using one of Greg’s aquariums, a camera, tripod, computer and such. I’ll be able to change the humidity soon enough and really start the experiment. Some of the stipa, just as a test And here’s my setup. Off to the left of the aquarium is the 500W halogen light. The seeds and black felt are inside the aquarium. In front of that is the camera with a blind on the front to help knock down some glare from the front glass. Attached is the computer, which is what I’m using to control the time-lapse. This graph summarizes the First and Last Day of Flowering for Echinacea plants in the common garden. It looks like peak flowering was July 8, 2010.
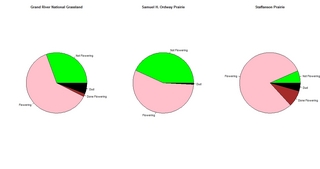
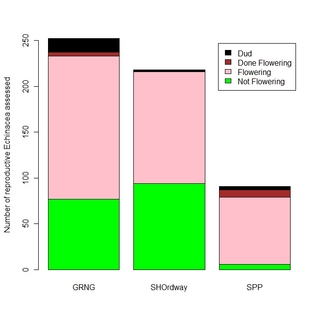
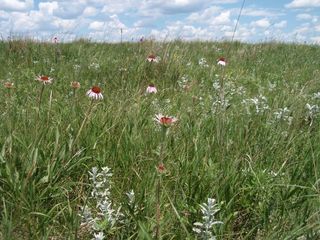
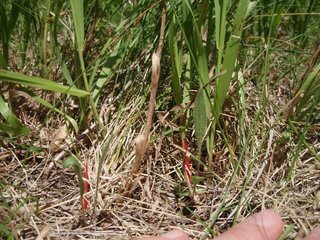
I analyzed my data and put together a couple of tables and figures. one thing that is interesting to me is that each species of bee was more sucessful in pollinating styles that had been 2 days old rather than 1 day old styles. hmmm? Maybe styles that are out for more than a day are more susceptable to shriveling..? Also, when Gretel compiles the data for CG phenology into a figure, I will use the figure to match up dates for when I did the insect visits and which species I saw most on those days. It should be interesting because it seems to be that in the beginning of flowering and towards the end of flowering, the smaller bees such as Augochlorella appear. Whereas during the peak of flowering, Melissodes dominated and I didn’t see any Augochlorella. -Katie I have some pictures of pollinators, but more to choose from would always be helpful for putting together my poster in a couple weeks. If so.. I would like any good pictures of Melissodes, Agopostemon, Augochlorella, Ceratina, and Lasioglossum. Preferably on Echinacea. If you could go through them and put them on a USB for me, that would be greatly appreciated. And I would acknowledge you for the picture if I use one of yours. Thanks, Katie Last week I assessed Echinacea flowering phenology at Grand River National Grassland south of Lemmon, SD, Samuel H. Ordway Prairie west of Leola, SD and Staffanson Prairie near Kensington, MN. Here are a couple of figures I generated to compare phenology at the 3 sites. Next, to show more quantitative information, I used a stacked bar graph. These figures illustrate that the flowering phenology is most advanced at Staffanson and least advanced at S. H. Ordway Prairie. Nevertheless, I am encouraged that there are lots of flowering plants at all 3 sites, suggesting that a long-distance cross involving plants from these 3 locations would be possible. I am considering tackling that project next summer, to assess whether there would be lower seedling recruitment from between-population crosses compared to within-population crosses at these 3 sites. Here’s a picture of some flowering Echinacea at Perch Lake, which is near the S. H. Ordway prairie. Here is a picture of 2 of the 3 surviving plants in my experimental plot at Perch Lake Waterfowl Production Area, southwest of Leola, SD. The Perch Lake site is 1 of 3 experimental plots I (and my assistants) sowed in November 2008, to ask whether Echinacea from western South Dakota, central South Dakota and Minnesota exhibit local adaptation in seedling recruitment. More background and results from the 1st 2009 census are displayed in a poster that you can find in the September 2009 archives of the FLOG. Unfortunately, the Perch Lake site was sprayed with a combination of herbicides (Tordon and Telar) in August 2009. The treatment was lethal to ALL the Echinacea seedlings that emerged in 2009. Thus, the 3 surviving seedlings from this year are the only living Echinacea in this plot! Fortunately, I was able to census the plot shortly after it was sprayed, and I am confident that I found the survivors up to that point. I plan to present a talk about my local adaptation experiment at the North American Prairie conference in August. Today we will start measuring Echinacea in the Common Garden. Here is the link to the protocol: CGmeasureprotocol2010.htm Four plants are flowering in Andrea’s garden this year. Andrea Southgate planted this experiment (aka inb2) in 2006 as part of her Master’s research project. Andrea and Jennifer made a photo essay about their plantings that year. These are the first plants to flower in this experiment–about 4/1500 in their fifth growing season! |
||||
|
© 2026 The Echinacea Project - All Rights Reserved - Log in Powered by WordPress & Atahualpa |
||||

-thumb-320x242-50642.jpg)