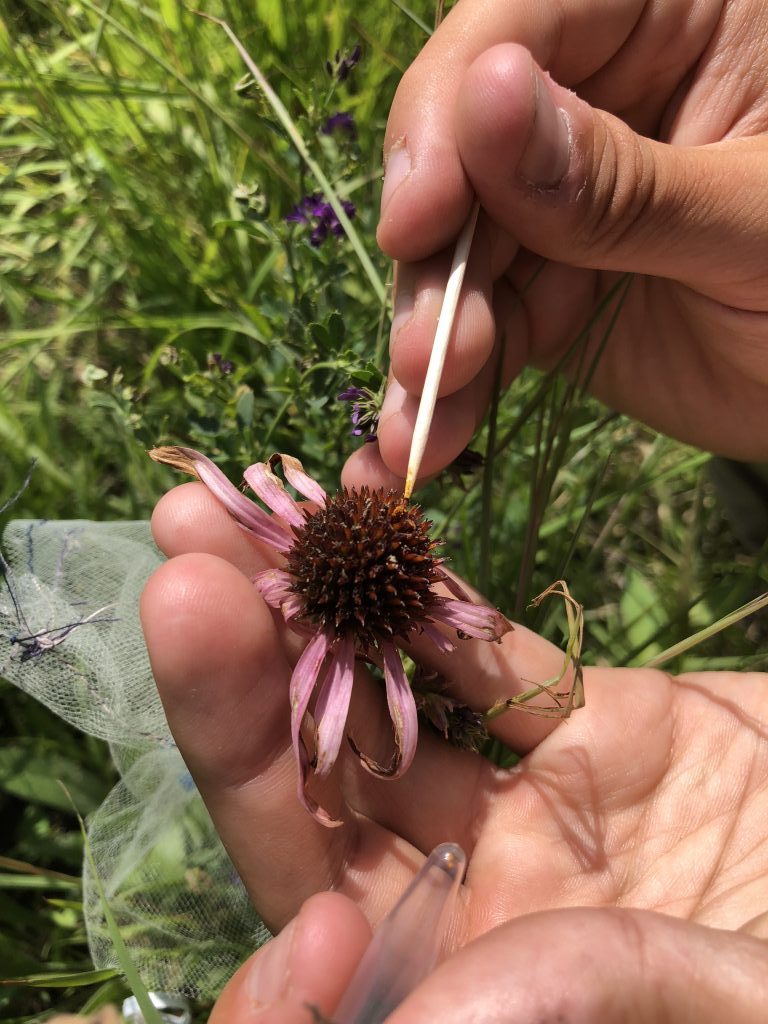
Michael adds pollen to one of the “addition” plants using a toothpick and a vial of collected pollen.
Does receiving the maximum amount of pollination vs. no pollen at all affect a plant’s longevity or likelihood of flowering in subsequent years? Since 2012, we have been either adding or excluding pollen from the same plants’ heads to test what role pollen plays in ongoing survival and flowering. Unlike the previous two years, many plants in this experiment flowered this year, and analyzing them will likely reveal interesting results.
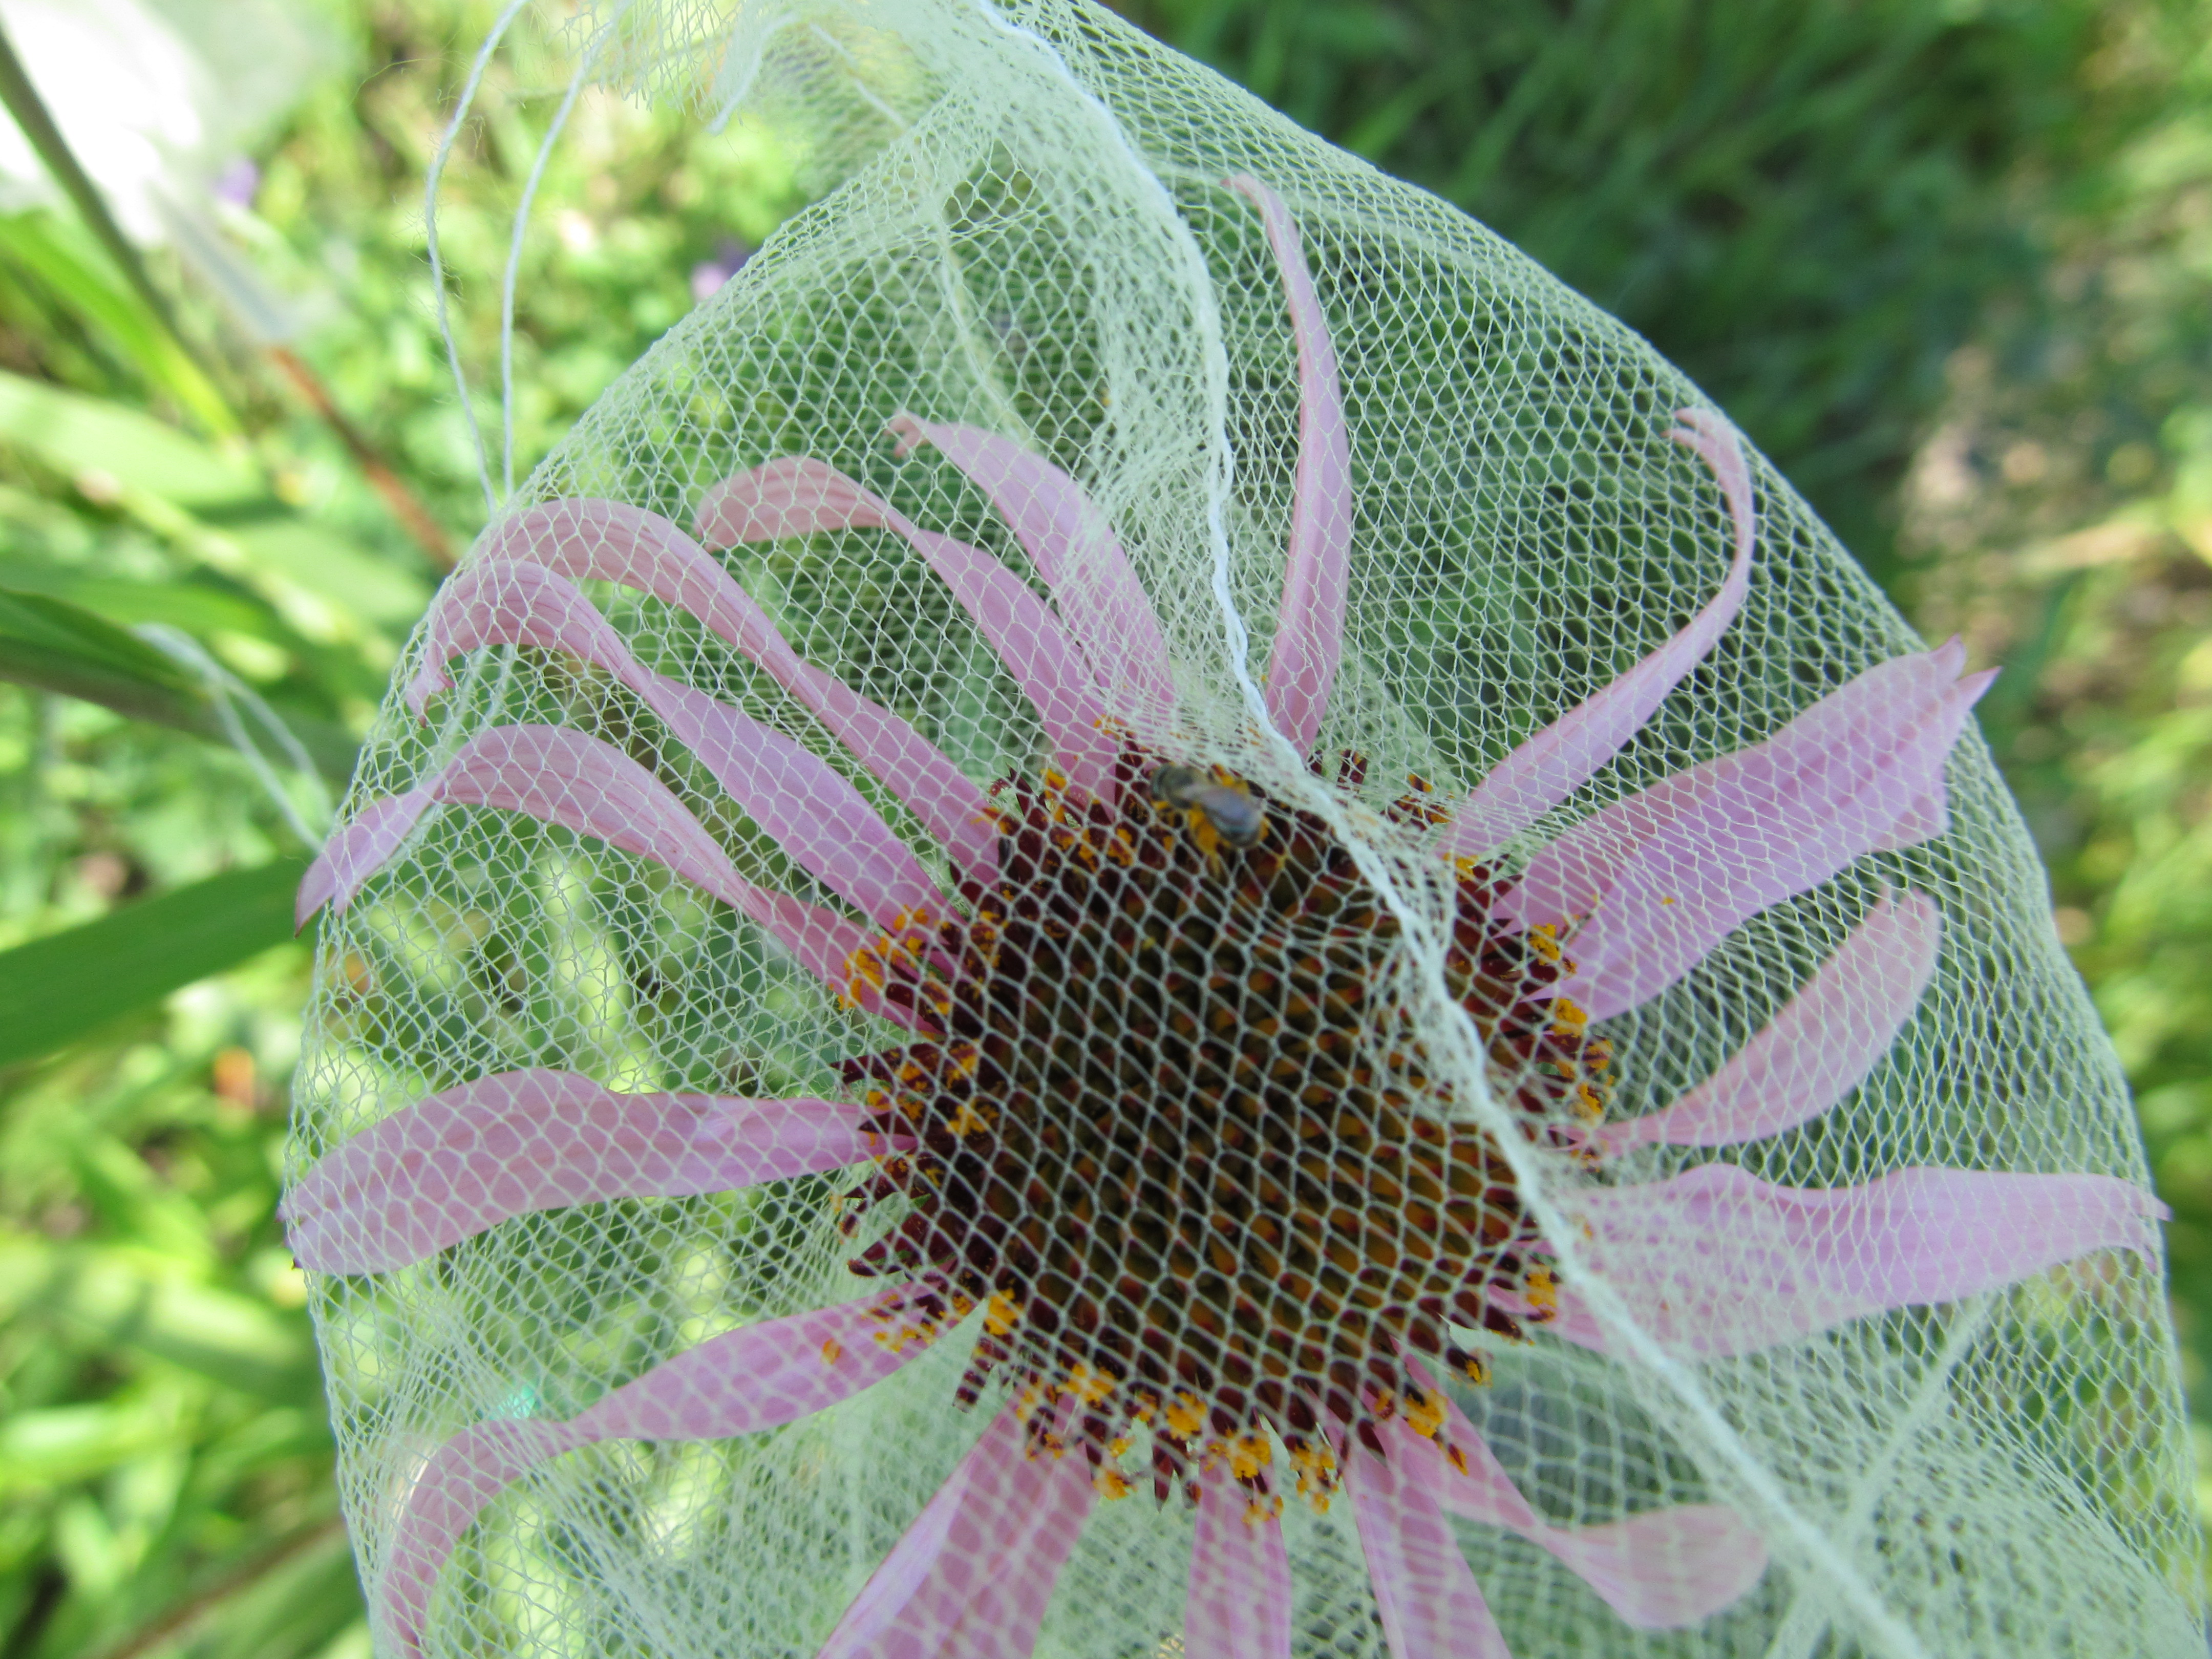
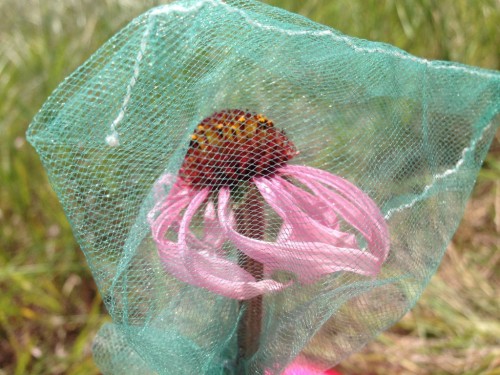
This summer, 14 of the 26 plants remaining in the pollen addition and exclusion experiment flowered, for a total of 25 heads. This is the most heads the pollen addition and exclusion project has had since 2013. We continued experimental treatments on these flowering plants and recorded the survival and flowering status of all plants in the experiment. Of the original 38 plants in this experiment, 12 of the exclusion plants and 14 of the pollen addition plants are still alive.
In this experiment, we assess the long-term effects of pollen addition and exclusion on plant fitness. In 2012 and 2013 we identified flowering E. angustifolia plants in experimental plot 1 and randomly assigned one of two treatments to each: pollen addition or pollen exclusion. When plants flower in subsequent years they receive the same treatment they were originally assigned. The increase in flowering rates this year will allow us to move forward with analyzing this data set, to potentially answer this 7-year question.
Start year: 2012
Location: Experimental plot 1
Physical specimens: We harvested 25 flowering heads from this experiment that will be pulled from the normal ACE processing and pushed through faster. This is so we can more quickly determine achene count and proportion of full achenes.
Data collected: Plants survival and flowering data was recorded as part of our annual surveys in P1 and can be found with the rest of the P1 data. Data on when heads had pollen added can be found in CGData/115_pollenLimitation, particularly dailyPollenAddition for the year 2018.
You can find more information about the pollen addition and exclusion experiment and links to previous flog posts regarding this experiment at the background page for the experiment.