
Now that I’ve finished collecting data from the Echinacea heads collected from Staffanson Prairie Preserve in 2015, I am able to start doing some data analysis. While the ultimate goal is to compare the data from 2015, a non-burn year, to previous burn years, I first want to come to a good understanding of what reproductive success looked like in 2015.
For all of the analyses I will be doing, I am using computer software called R. R is a very flexible program that allows you to employ a wide range of graphical and statistical techniques including modeling, running tests, and clustering. Although R does have a somewhat steep learning curve, I have been learning many useful techniques in Stuart’s class on R at Northwestern and am confident in my ability to properly analyze the data I have collected.
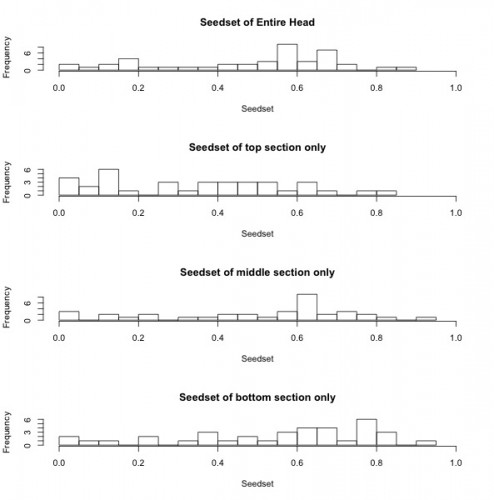
The histograms below show seedset, which is the proportion of achenes that contain a seed and can range from zero to one, for the entire head, as well as for the top, middle, and bottom sections of each head. For the entire head, the sample has a range from 0 to 0.86, with a mean of 0.48 and a median of 0.57. While the middle and bottom portions of the head had similar seedsets, the top portions of each head appear to have lower seed set on average when compared to the rest of the head. This is consistent with the findings of previous years and suggests that florets that are receptive to pollen later in the season may have diminished reproductive success.
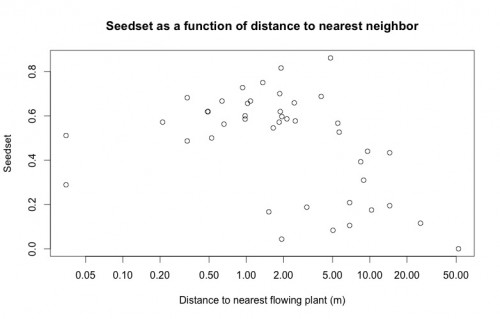
An important variable in Echinacea reproduction, spatial isolation, is modeled in the below plot as a predictor of seedset. This plot highlights the importance of doing a careful visual exploratory data analysis before diving into more complicated statistical analyses. While there does appear to be the expected inverse relationship between seedset and spatial isolation, upon looking at this plot Stuart was immediately able to tell me that the two points on the left of the plot are the result of erroneous data. None of the plants have a nearest neighbor less than 5 cm away, so there must have been an error either in data entry or during the recording of GPS coordinates. Because we have records for the correct GPS coordinates of every plant, this will be a very easy error to fix, but had Stuart not looked closely at this plot, I may have done the entire analysis with incorrect data.
Leave a Reply