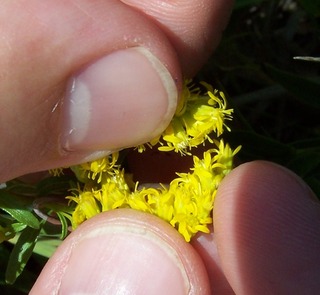
I was curious what the stigma/style looked like on psoralea and if I was actually pollinating or not. The picture displays it with pollen.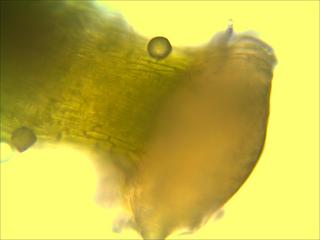
|
||||
|
Ian wants to quantify the overlap of flowering time between all pairs of plants in his experiment. This following R script reads his file with the flowering schedule of all 31 plants in his experiment and writes a file called ianPhenPairs.csv that has the flowering schedule of every possible pair combination (one per line). Note that there is a separate record for each plant as a sire and dam.
Having stickered and scanned all of the collected Stipa seed (great job Ian, Hillary, and Lauren!) we’ve gone through and stuck them all into their foamy rows. 1700ish seeds later, we’re ready to plant out in the common garden! Here’s a few pictures:
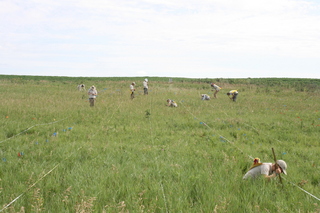
Hi everyone, Hey everyone- Thanks to all of you who gave me such great input for my poster and/or the powerpoint! I attached a PDF of the finished poster as well as my slides for the powerpoint presentation because I know I was freaking out about fitting everything in 5 slides! So you can see how it turned out, and I have 4 extra slides if I get questions. haha. KochkREU10.pdf Now I need to practice, practice, practice the presentation! I’ll post one more flog update for how it goes on Friday. Eeek! -Katie We finished measuring plants in Jennifer’s Phenology plot at Hegg Lake WMA this Friday.
We measured many plants.
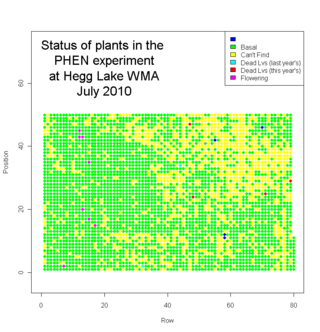
We measured about 2700 plants. Eight plants flowered this year. We visited another 1300 locations where we couldn’t find a plant (mostly because they had died). Here’s a map of the plot with the status of each location (click to see a bigger version)… In addition to Echinacea angustifolia, we saw some good prairie plants in the plot, including lead plant (Amorpha canescens), yellow lady-slipper (Cypripedium calceolus), prairie rose (Rosa arkansana), Missouri goldenrod (Solidago missouriensis), silver leaf scurf pea (Psoralea argophylla), and many others. It was a big job, but we were quite efficient. We laid out 50m tapes on every other row to help guide us. Four of us went out on Wednesday to flag positions 1 and 50 for all rows. That took ~2h. We started flagging positions 10, 20, but that was unnecessary. On Thursday we all went out and measured from 2-4 pm. On Friday we did two shifts: 10 -12 and 2:30 -5.
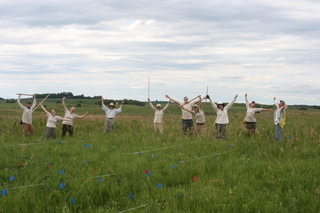
We were happy to be done.
On the way out we removed a weed that we had noticed the day before–spotted knapweed. We were careful not to touch it because it can be a skin irritant. I’d never seen this plant in the study area before.
Heading home.
What a great way to end the week. It was Katie and Laura’s last day. They are heading back to the Chicago Botanic Garden to prepare their posters and talks. Check it out on youtube. It’s even available in full HD! I’m actually just linking this because this blog isn’t wide enough to fit the whole movie. All the field work has been completed! Phenology data is in with the last plant having two immature florets left today which means that tomorrow will probably be its last day of flowering. I am hoping to start running stats on the phenology today or tomorrow. Below is a completed excel file with data from crosses and phenology, and a csv file of just the final phenology data that will be used for stats. I will keep posting the results from the analysis. This afternoon we are going to measure plants in Jennifer’s Phenology plot at Hegg Lake WMA. Here is a script that makes a datasheet that assigns us rows to measure. The order is approximately 1 – 80, but they are slightly mixed up (just to keep us on our toes): measurePHENatHeggLakeRows.r If someone is able- some in the CG and some at Nice Island to be pollinated still exist. Psoralea argophylla Solidago missouriensis
For Solidago missouriensis at Nice Island: Flag ID Self ID Sprig Outcross ID Sprig Date Site |
||||
|
© 2026 The Echinacea Project - All Rights Reserved - Log in Powered by WordPress & Atahualpa |
||||