
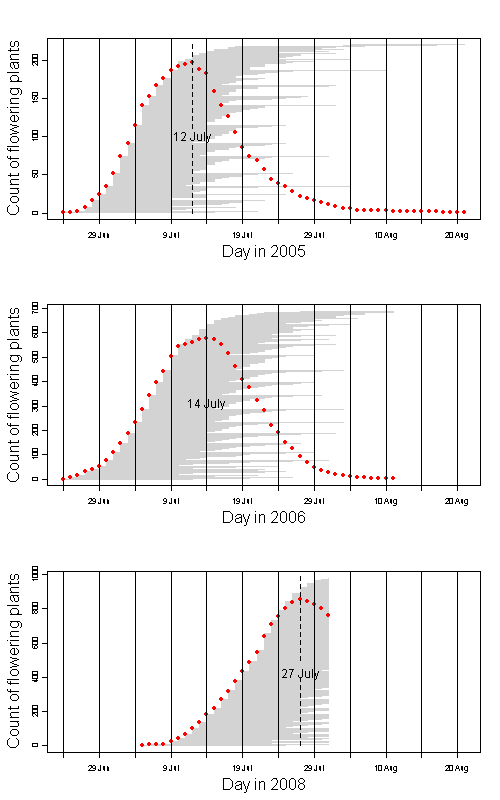
Echinacea angustifolia is flowering late this year.
Peak flowering this year was 27 July. Peak was 12 July and 14 July in 2005 and 2006 respectively. Here’s a rough graph that shows flowering phenology in these years. Red dots are the count of fl plants on each day. Horizontal gray lines indicate days that each plant shed pollen.
See the updated animation of flowering in the common garden experimental plot.
This animated GIF file is a map of all plants that flowered in the CG on each day from July 5 to July 30th. Each dot represents a plants that’s flowering on the day (see upper right corner).
 Click on the thumbnail to see a full-sized image.
![]() This legend shows plants with 3, 1, and 2 heads flowering (left to right).
This legend shows plants with 3, 1, and 2 heads flowering (left to right).
Leave a Reply