|
|
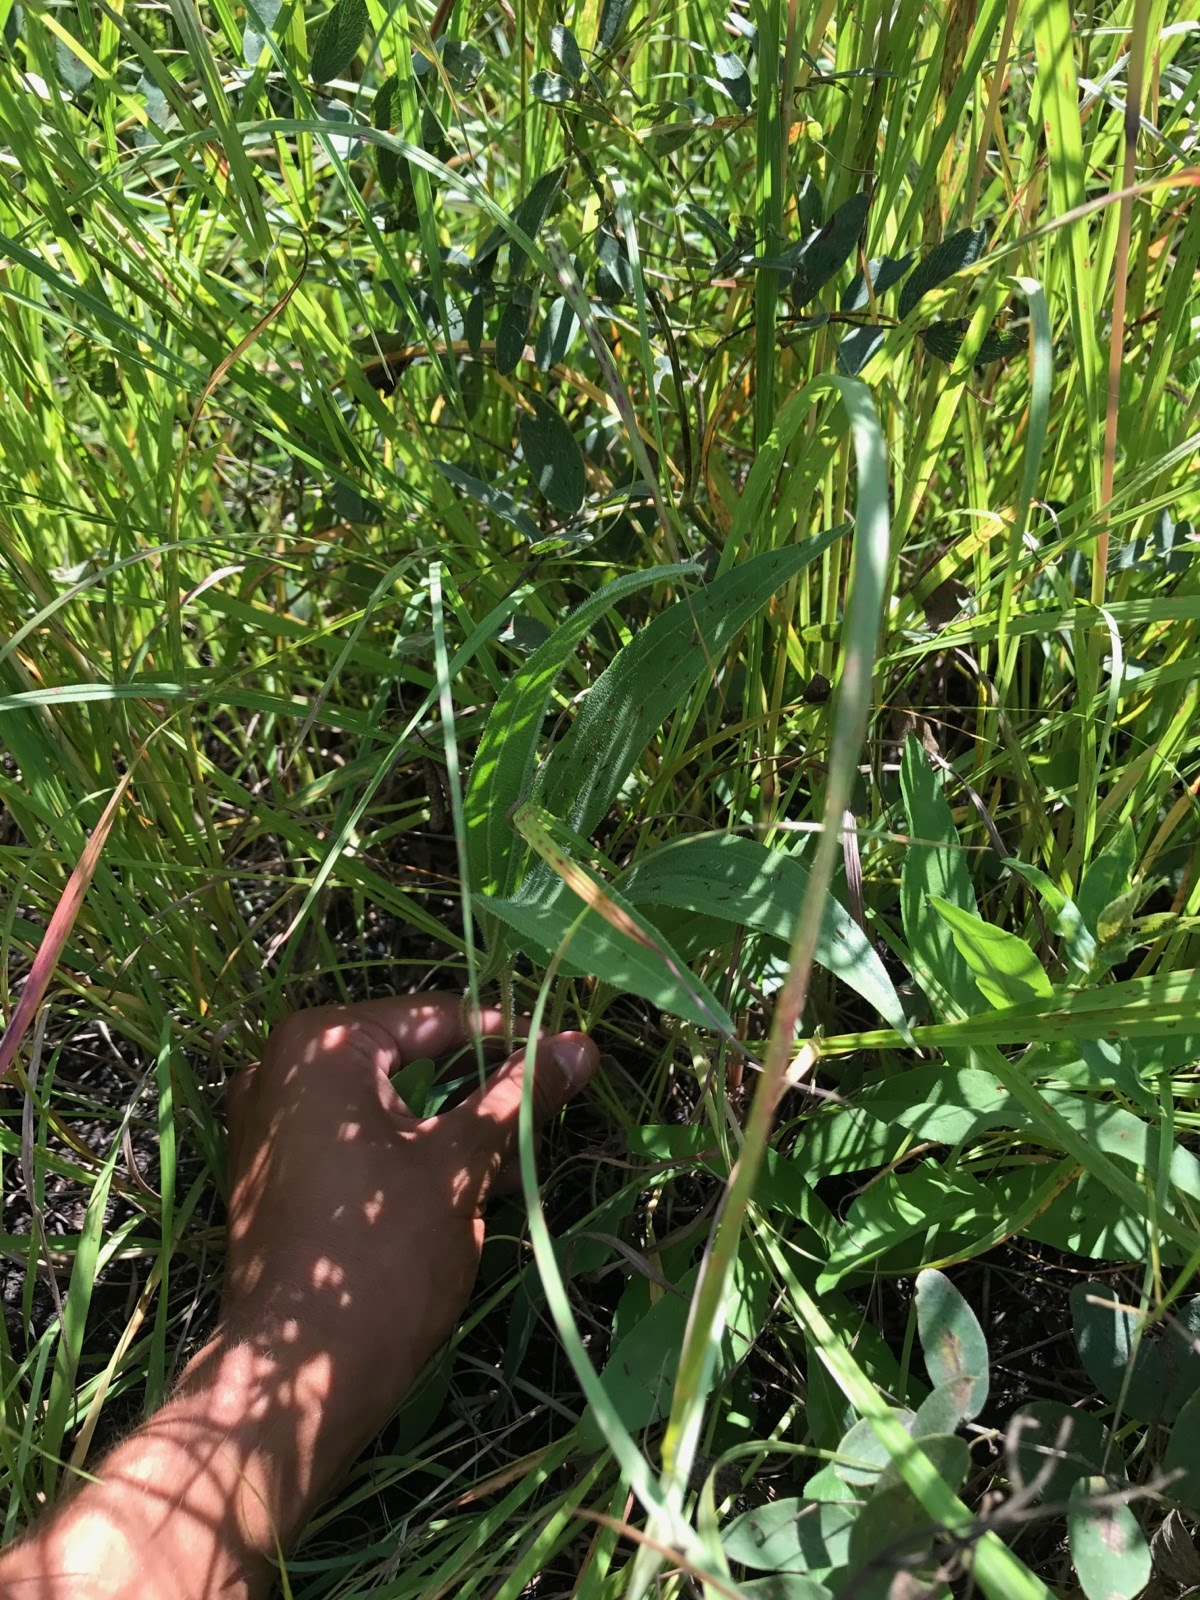
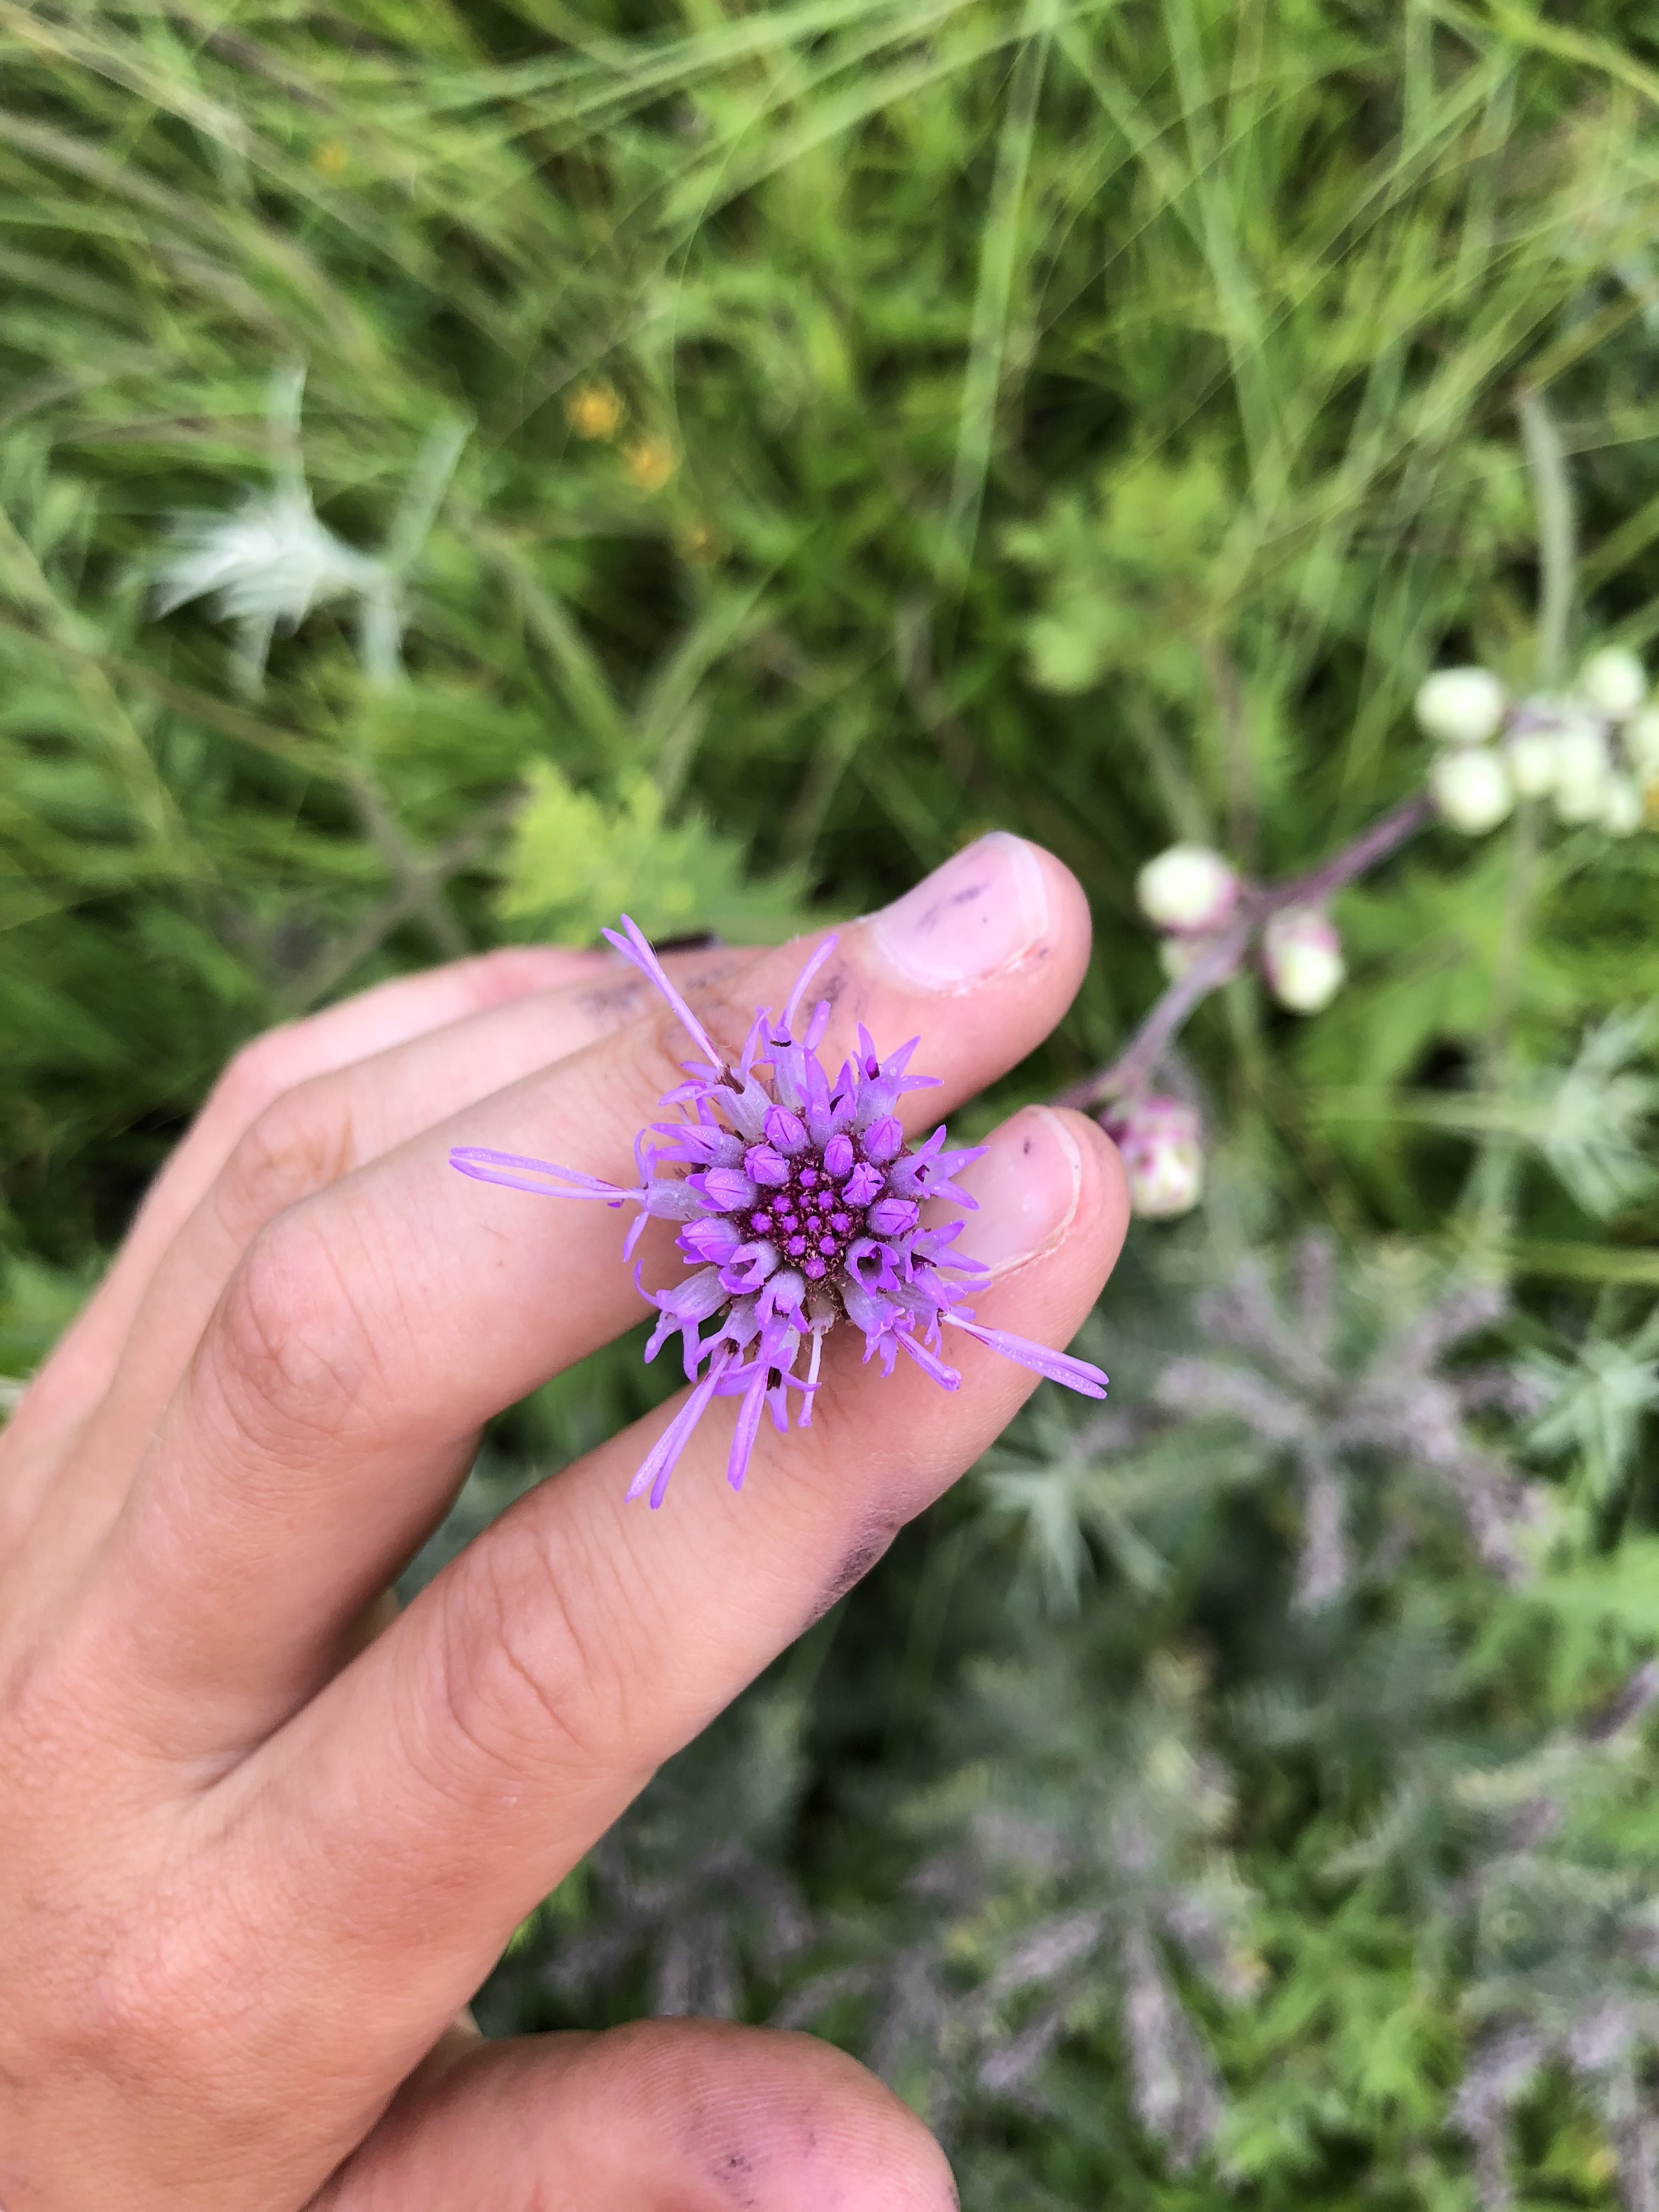
In 2018, we searched for 30 of the original 66 Echinacea hybrid plants. We found 29 Echinacea hybrids… which shows incredibly low mortality! This means that 40% of the original cohort is still alive, with the survival rate this winter of more than 96%! Of the surviving plants, the average leaf count was 2.2 leaves, the longest basal leaf was 14.75cm. These plants are considerably smaller than their exPt9 counterparts, despite being several years older.
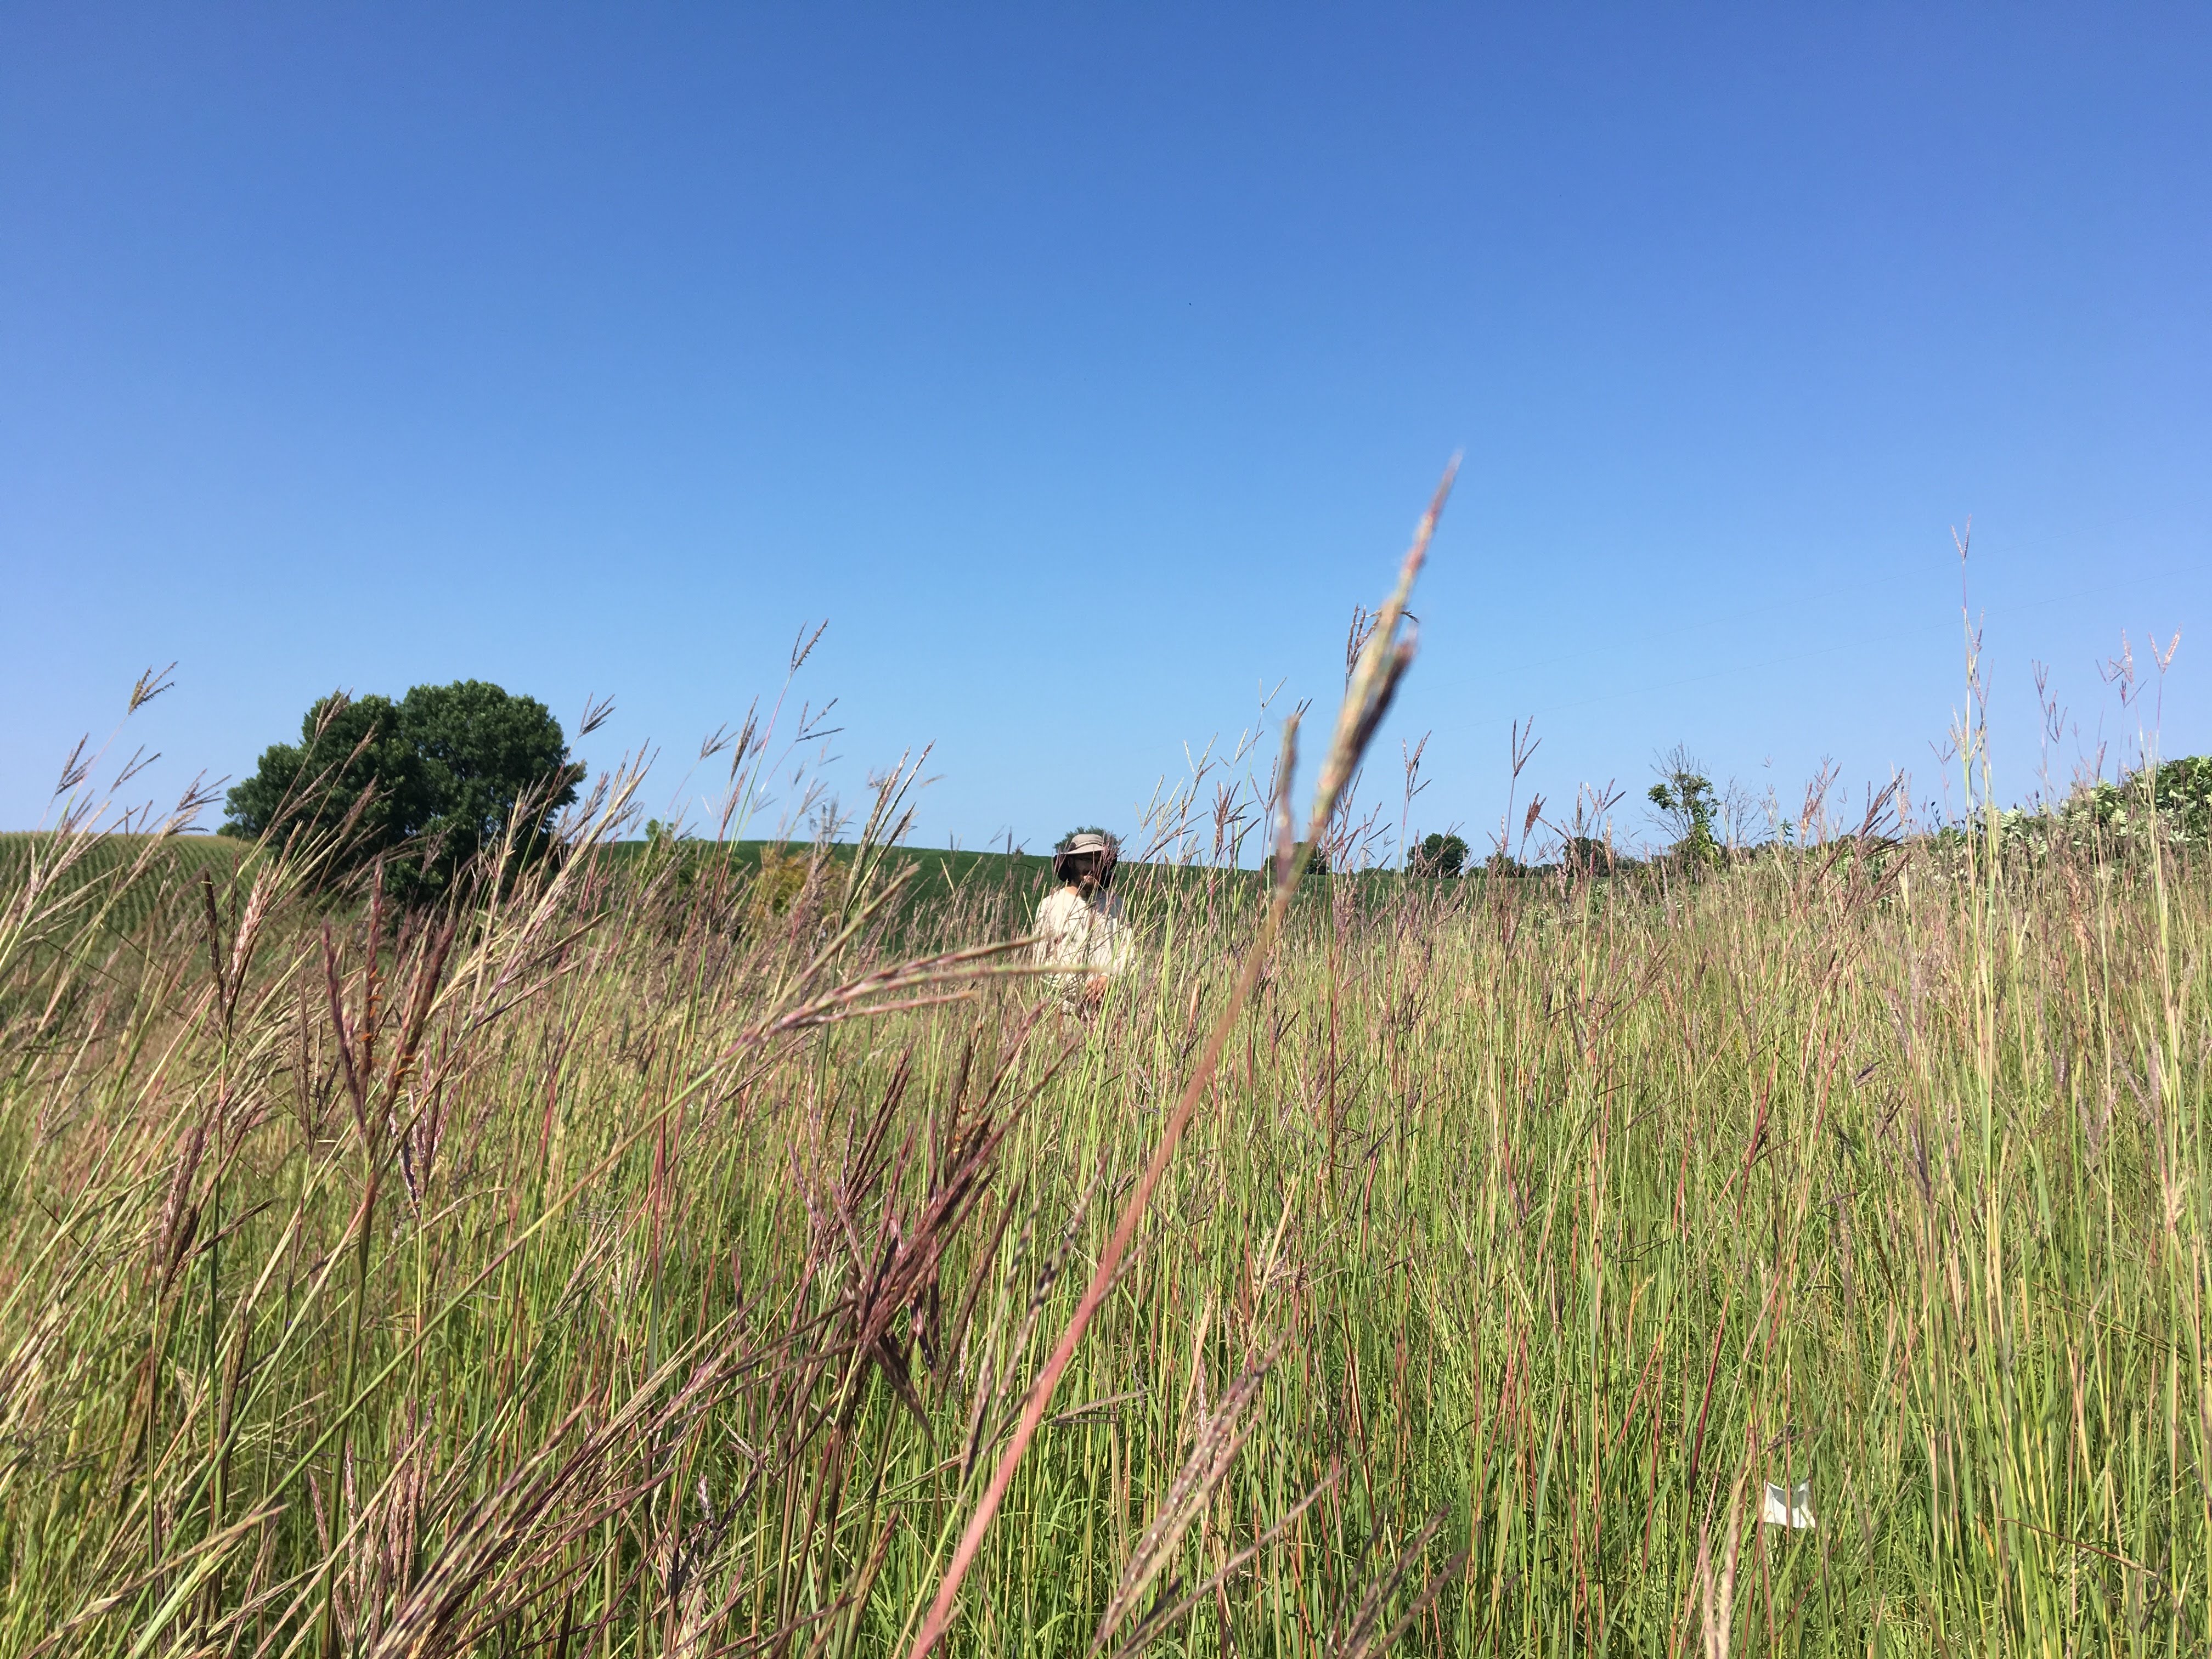
 This big bluestem made finding these tiny plants pretty hard! This plot was originally developed for Josh Drizin’s experiment with exotic grasses, but 66 hybrids of Echinacea angustifolia and Echinacea pallida were also planted in 2012. In 2011, Gretel and Nicholas Goldsmith performed reciprocal crosses between 5 non-native pallida plants found at Hegg Lake and 31 angustifolia plants in P1. These plants have been revisited each summer since then.
Year started: Crossing in 2011, planting in 2012
Location: Experimental Plot 6, on Tower Road
Overlaps with: Echinacea hybrids — ex Pt 7, Echinacea hybrids — ex Pt 9
Data collected: Status, rosette count, longest leaf measurement, and number of leaves for each plant. Exported to CGData.
Products: Nicholas Goldsmith wrote a summary of the crosses he conducted in 2011. A chapter of his dissertation, which he defended in December, reports on the fitness of hybrids compared to plants of either species.
You can find more information about experimental plot 6 and previous flog posts about it on the background page for the experiment.
In summer 2018, we again measured Echinacea plants in experimental plot 9 at Hegg Lake. These plants are from open-pollinated E. angustifolia plants near the restoration plot with flowering E. pallida plants. ExPt9 includes some hybrid plants, as determined by DNA fingerprinting techniques. The table below shows the number of plants found alive during each search since the experiment started in 2014. Much like last year, the average surviving plant had about 3 leaves. The average longest leaf was 21 cm, 4 cm shorter than in 2017. We suspect that leaves are shorter this year than last year (25cm in 2017 on average) because of a burn in the Hegg Lake WMA. This year we searched for plants once then rechecked every position where we didn’t find a plant during our first search. No plants flowered this year (no flowering plants yet!).
| Year / Event |
Number Alive |
% Original remaining |
% Of previous year |
| Planting (2014) |
746 |
100 |
N/A |
| 2014 |
638 |
85.5 |
85.5 |
| 2015 |
521 |
69.8 |
81.7 |
| 2016 |
493 |
66.1 |
94.6 |
| 2017 |
401 |
53.8 |
81.3 |
| 2018 |
329 |
44.1 |
82.0 |
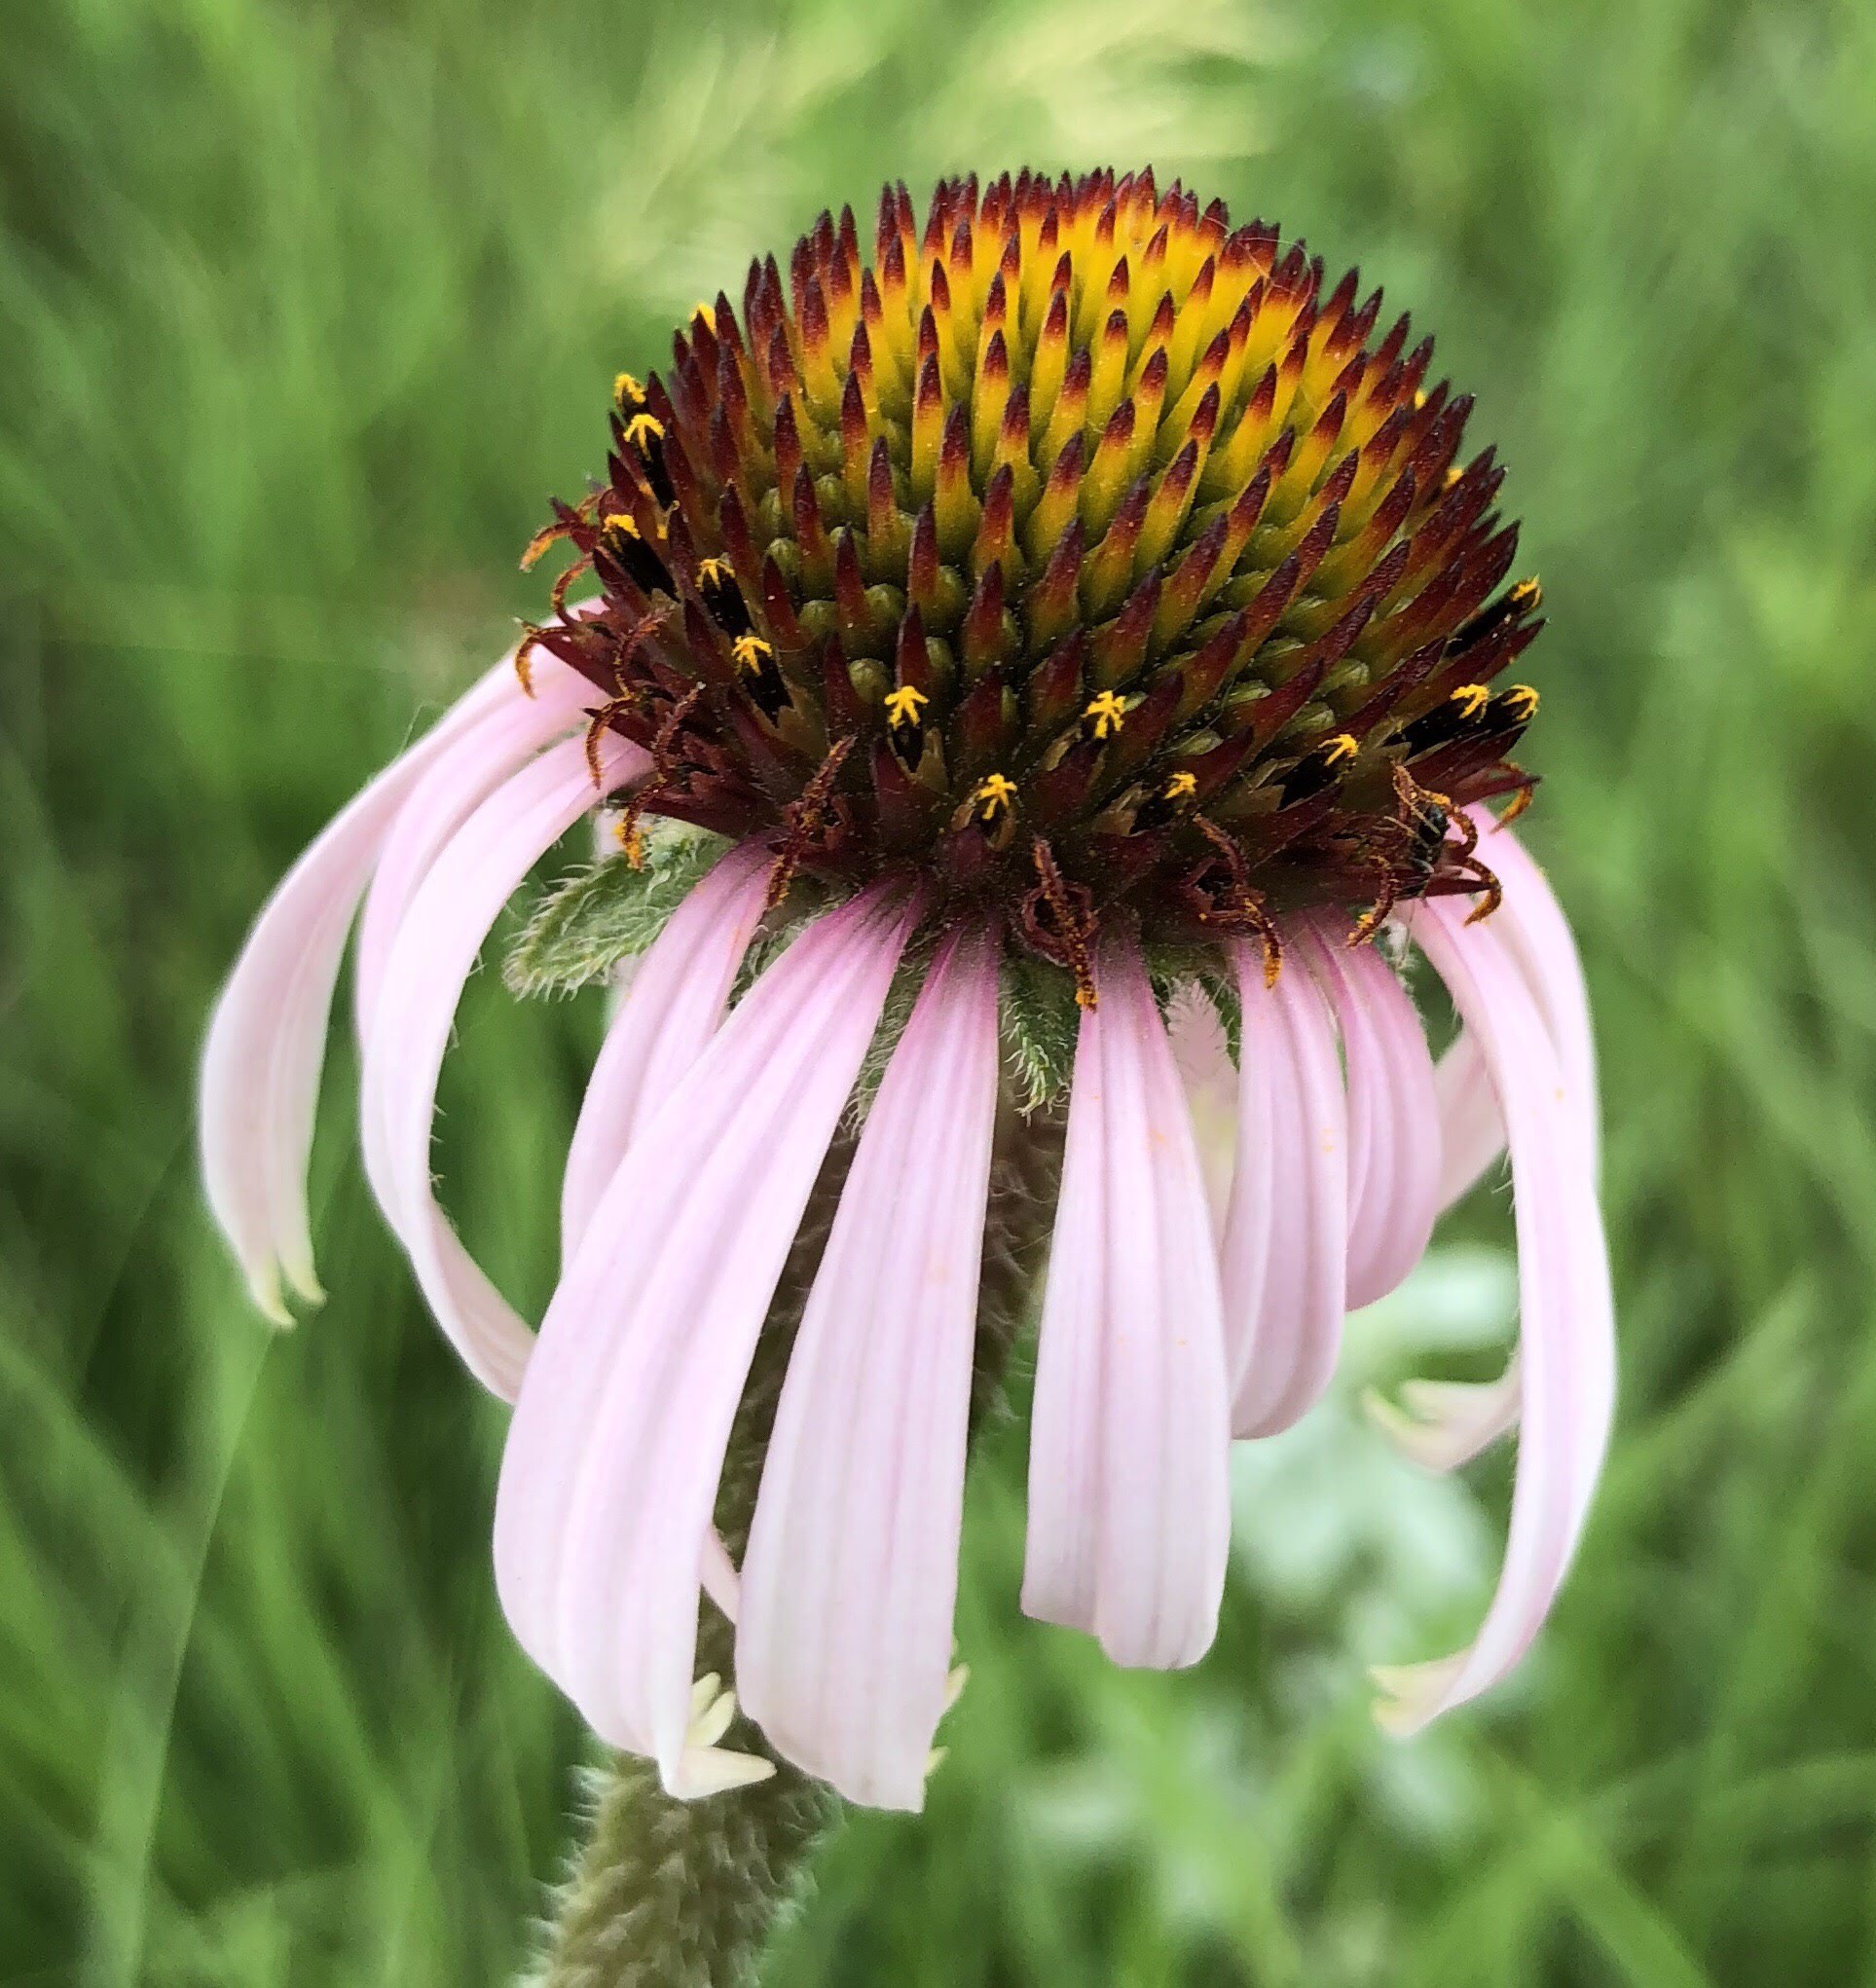
This experiment comparing the fitness of Echinacea hybrids with pure-bred E. angustifolia and E. pallida will give insight into the possible consequences of non-native E. pallida being planted in restorations in Minnesota, where E. angustifolia is the only native Echinacea to this area of MN.
 Most exPt9 plants look like this! Start year: 2014
Location: Hegg Lake Wildlife Management Area — experimental plot 9
Overlapping experiments: Echinacea hybrids — experimental plot 6, Echinacea hybrids — experimental plot 7
Data collected: Rosette number, length of all leaves, herbivory for each plant collected electronically and exported to CGData. Recheck information for plants not found was also collected electronically and stored in CGData.
You can find out more information about experimental plot 9 and flog posts mentioning the experiment on the background page for the experiment.
As always, demo was a huge job this year. This season we added 3868 demo records and about 1539 survey records to our database. After over 20 years of this method, we are starting to get a very good idea of the demography of Echinacea in Solem Township.
So how do we do demo? When we find a new flowering Echinacea plant, we give it a tag and get its location with a survey-grade GPS (better than 6 cm precision). Then, we can revisit this plant for years to come and monitor its survival and reproduction. We’re monitoring over 10,000 plants as of 2018. With this many records, organizing demap in the future is going to be a big task!
We made some small adjustments to how we do total demo and flowering demo (we do flowering demo in every remnant now). Now, in our big plots, we only do a sample of the plants instead of total demo. Check out the updated table below (remember we did flowering demo everywhere). We still managed to shoot thousands of points, take even more demography records, and, as always, follow the colored flags!
| Total Demo |
BTG, Common Garden, DOG, East of Town Hall, KJs, Krusemark, Landfill West, Loeffler Corner East, Near Town Hall, Nessman, NNWLF, NRRX, recruit he, recruit hp, recruit hs, recruit el, recruit hw, recruit ke, recruit kw, RRX, RRXDC, South of Golf Course, Steven’s Approach, transplant plot, Tower, Town Hall, West of Aanenson, Woody’s |
| Sample Demo |
Aanenson, Around LF, East Riley, Hegg Lake, Elk Lake Road East, Golf Course, Landfill, Loeffler Corner, North of Golf Course, NWLF, On 27, Riley, Staffanson, Yellow Orchid Hill |
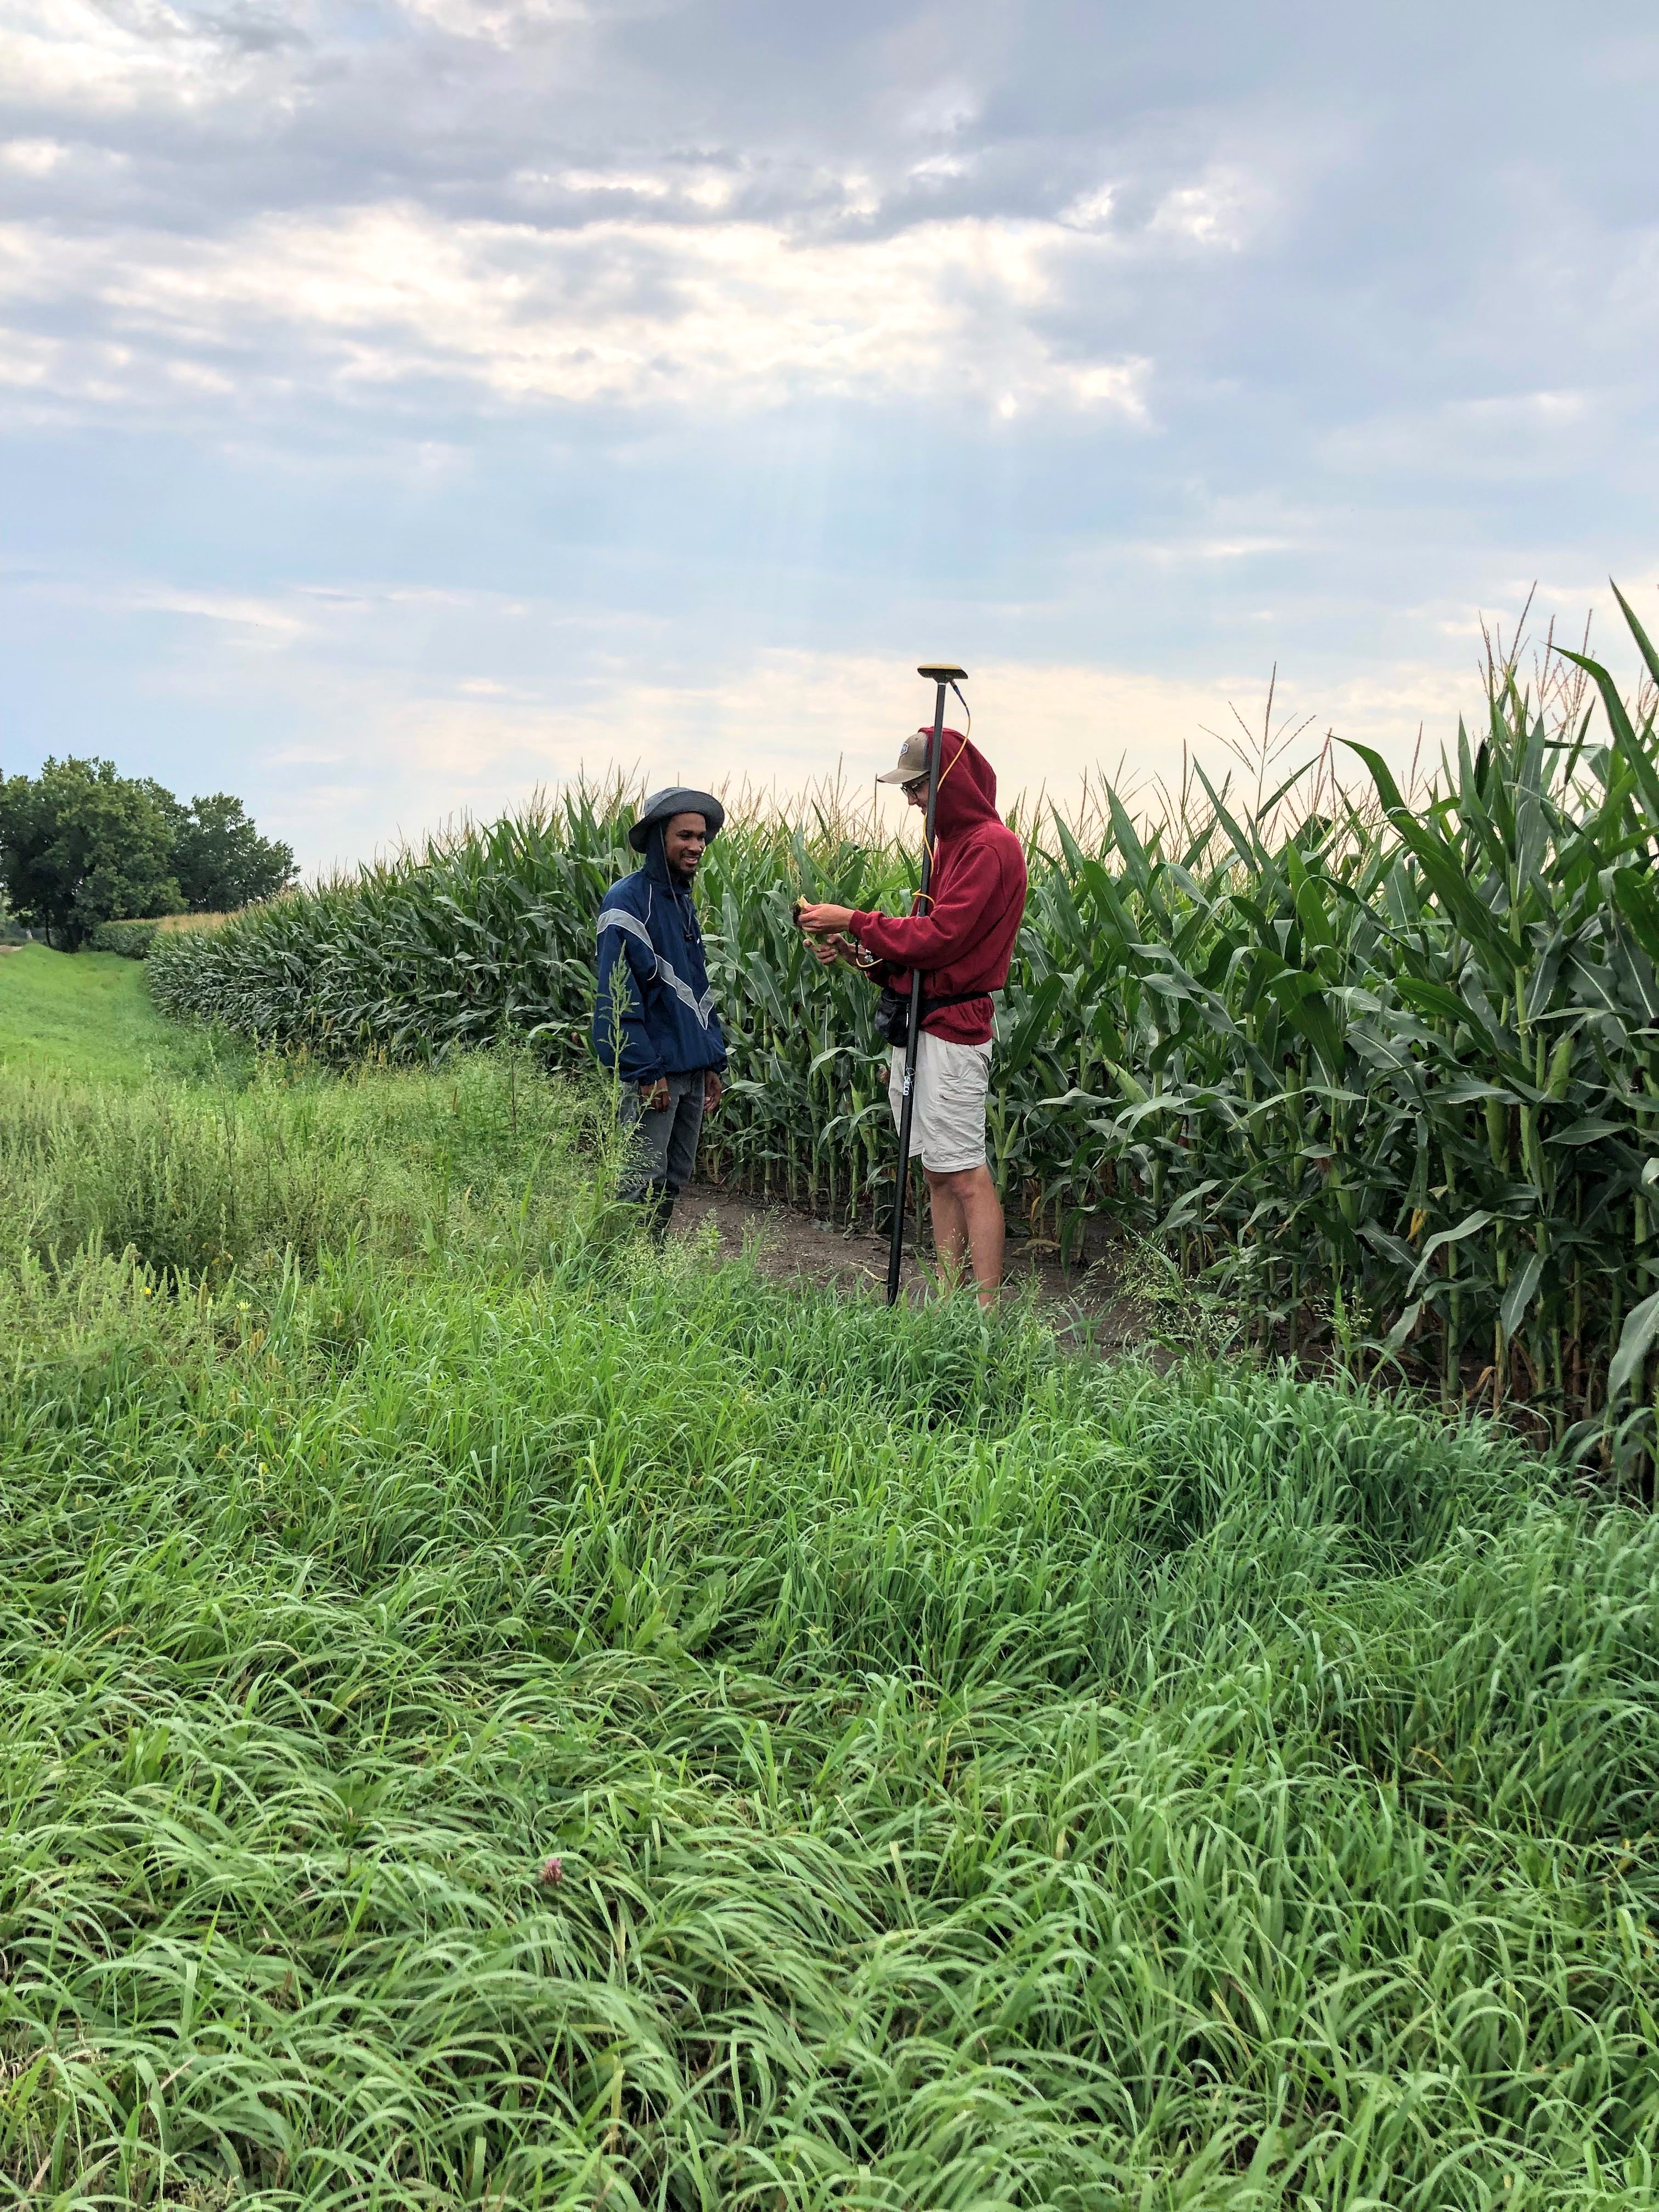
Evan and Will doing demo by the corn. While you might not be able to see the echinacea, we promise, it’s under there! Year started: 1996
Location: Roadsides, railroad rights of way, and nature preserves in and near Solem Township, Minnesota.
Overlaps with: Flowering phenology in remnants, fire and flowering at SPP
Data collected: demo records include Flowering status, number of rosettes, number of heads, neighbors within a 12 cm radius of plants found. These are all taken with PDAs that sync with an MS Access database. They are all transferred to the demap R repository in bitbucket with git version control.
GPS points shot: Points for each flowering plant this year shot mostly in SURV records, stored in surv.csv. Each location should be either associated with a loc from prior years or a point shot this year.
Products:
- Amy Dykstra’s dissertation included matrix projection modeling using demographic data
- Project “demap” merges phenological, spatial and demographic data for remnant plants
You can find out more about the demographic census in the remnants and links to previous posts regarding it on the background page for this experiment.
For her REU project, Brigid gathered data to study the relationship between flowering density and seed set. She worked at Staffanson Prairie Preserve, which appears to have higher flowering density in burn years than non-burn years. This year, 2018, was a burn year on the east side of the preserve. Brigid and Team Echinacea kept track of the style persistence of about ~150 individuals many of which we have phenology and style persistence information from prior years. These individuals were harvested and their achene count and seed set will be assessed by volunteers and interns at the CBG.
Brigid also observed nearest neighbors for many of the plants that she tracked. It might be the cases that echinacea flowers are more successful if they have other flowering plants nearby. Synchrony is a large part of why fire is so important, and, since SPP is our largest remnant prairie, it’s the best place to test the relationship between fire and synchrony. Number of heads, phenology, and head size may also \ interact with fire — we’ll know once we look at the data!

Site: Staffanson Prairie Preserve
Start year: 1996
Overlaps with: Phenology in Remnants, Reproductive Fitness in Remnants
Data and Samples: We shot 90 GPS points for nearest neighbors, many of which were plants that flowered for the first time this year. We also harvested 22 heads that are awaiting cleaning at CBG
Products: None so far
 In 2018 only 19% of the plants flowered, despite it being a burn year. Is the 1996 finally showing its age? In 2018, 51 plants flowered of the surviving 269 plants in the 1996 cohort. That means that 41% of the original plants are surviving and 19% of the living individuals flowered. That’s up huge since last year, where only 2% flowered, and the year before where five percent of living individuals flowered. In contrast, however, 45% of living plants flowered in 2015, and 37%, 34%, and 40% flowered in 2014, 2013, and 2012 respectively. We found that of the original 646 individuals, 269 were alive in 2018, only 15 fewer than last year. We are not sure why so many more plants flowered this year. It’s probable that the fire in the plot in fall 2017 influenced flowering rates.
The 1996 cohort has the oldest Echinacea plants in experimental plot 1; they are 22 years old. They are part of a common garden experiment designed to study differences in fitness and life history characteristics among remnant populations. Every year, members of Team Echinacea assess survival and measure plant growth and fitness traits including plant status (i.e. if it is flowering or basal), plant height, leaf count, and number of flowering heads. We harvest all flowering heads in the fall, count all achenes, and estimate seed set for each head in the lab. As yet, these heads are still waiting to be cleaned April 2019.
Start year: 1996
Location: Experimental plot 1
Overlaps with: phenology in experimental plots, qGen3, pollen addition/exclusion
Physical specimens:
- We harvested 59 heads. At present, they await processing in the lab to find their achene count and seed set.
Data collected:
- We used Visors to collect plant growth and fitness traits—plant status, height, leaf count, number of flowering heads, presence of insects—these data have been added to the database
- We used Visors to collect flowering phenology data—start and end date of flowering for all individual heads—which is ready to be added to the exPt1 phenology dataset
- Eventually, we will have achene count and seed set data for all flowering plants (stay tuned)
Products:
- See the exPt1 core dataset where yrPlanted == ‘1996’ for 1996 cohort fitness measurements
- Amy Waananen’s paper, Mating opportunity increases with synchrony of flowering among years more than synchrony within years in a nonmasting perennial, published last year in The American Naturalist, was based on plants in this cohort.
You can find more information about the 1996 cohort and links to previous flog posts regarding this experiment at the background page for the experiment.
In the summer or 2018, Lea collected data for the third year of her observational study quantifying
 Flowering Liatris flowering phenology and reproductive success (seed set) for Liatris aspera and Solidago speciosa plants located along a transect at Staffanson Prairie Preserve. Staffanson is divided into east and west units. The west unit of Staffanson was burned Spring 2016. In 2016, Lea looked for differences in phenology and reproduction of east vs. west Liatris and Solidago plants. In 2017, neither unit was burned. In 2018, the east unit burned. Data collected this year combined with data collected in 2016 and 2017 will enable us to to see if burns influence phenology or reproduction. To assess phenology, Lea visited plants three times a week and recorded if they were flowering. She took GPS data for each plant included in the study. She also mapped the seven nearest neighbors of all flowering plants within her transect in 2018. Additionally, Lea visited all plants in the 2016 and 2017 datasets to see if they were still present and if they were flowering. To assess reproduction (seed set), plants were harvested and brought back to the Chicago Botanic Garden so that seeds could be removed from the plant and x-rayed. This study helps us understand how fire, phenology, and reproduction are linked in species that are related to Echinacea angustifolia.
Start year: 2016
Location: Staffanson Prairie Preserve
Overlaps with: Fire and fitness of EA, Flowering phenology in remnants
Physical specimens:
- ~80 harvested Liatris aspera specimens from summer 2018, located at the CBG
- ~80 harvested Solidago speciosa specimens from summer 2018, located at the CBG
Data collected: Phenology data was taken on the visors every Monday, Wednesday, and Friday through the growing season. Paper harvest data sheets were used and brought back to CBG.
GPS points shot: ~543 GPS points were visited or shot, one point was visited for each plant monitored in summer 2016 and 2017, and points were shot for each plant in the 2018 dataset along with its seven nearest neighbors.
Spring is here! The birds have returned and some plants are finally starting to poke up after a (seemingly) very long winter. Of course, you know what that means! It’s time to get planting!
While many people will take this opportunity to begin growing their garden, here at the Echinacea Project we’re taking the opportunity to… well, grow more echinacea!
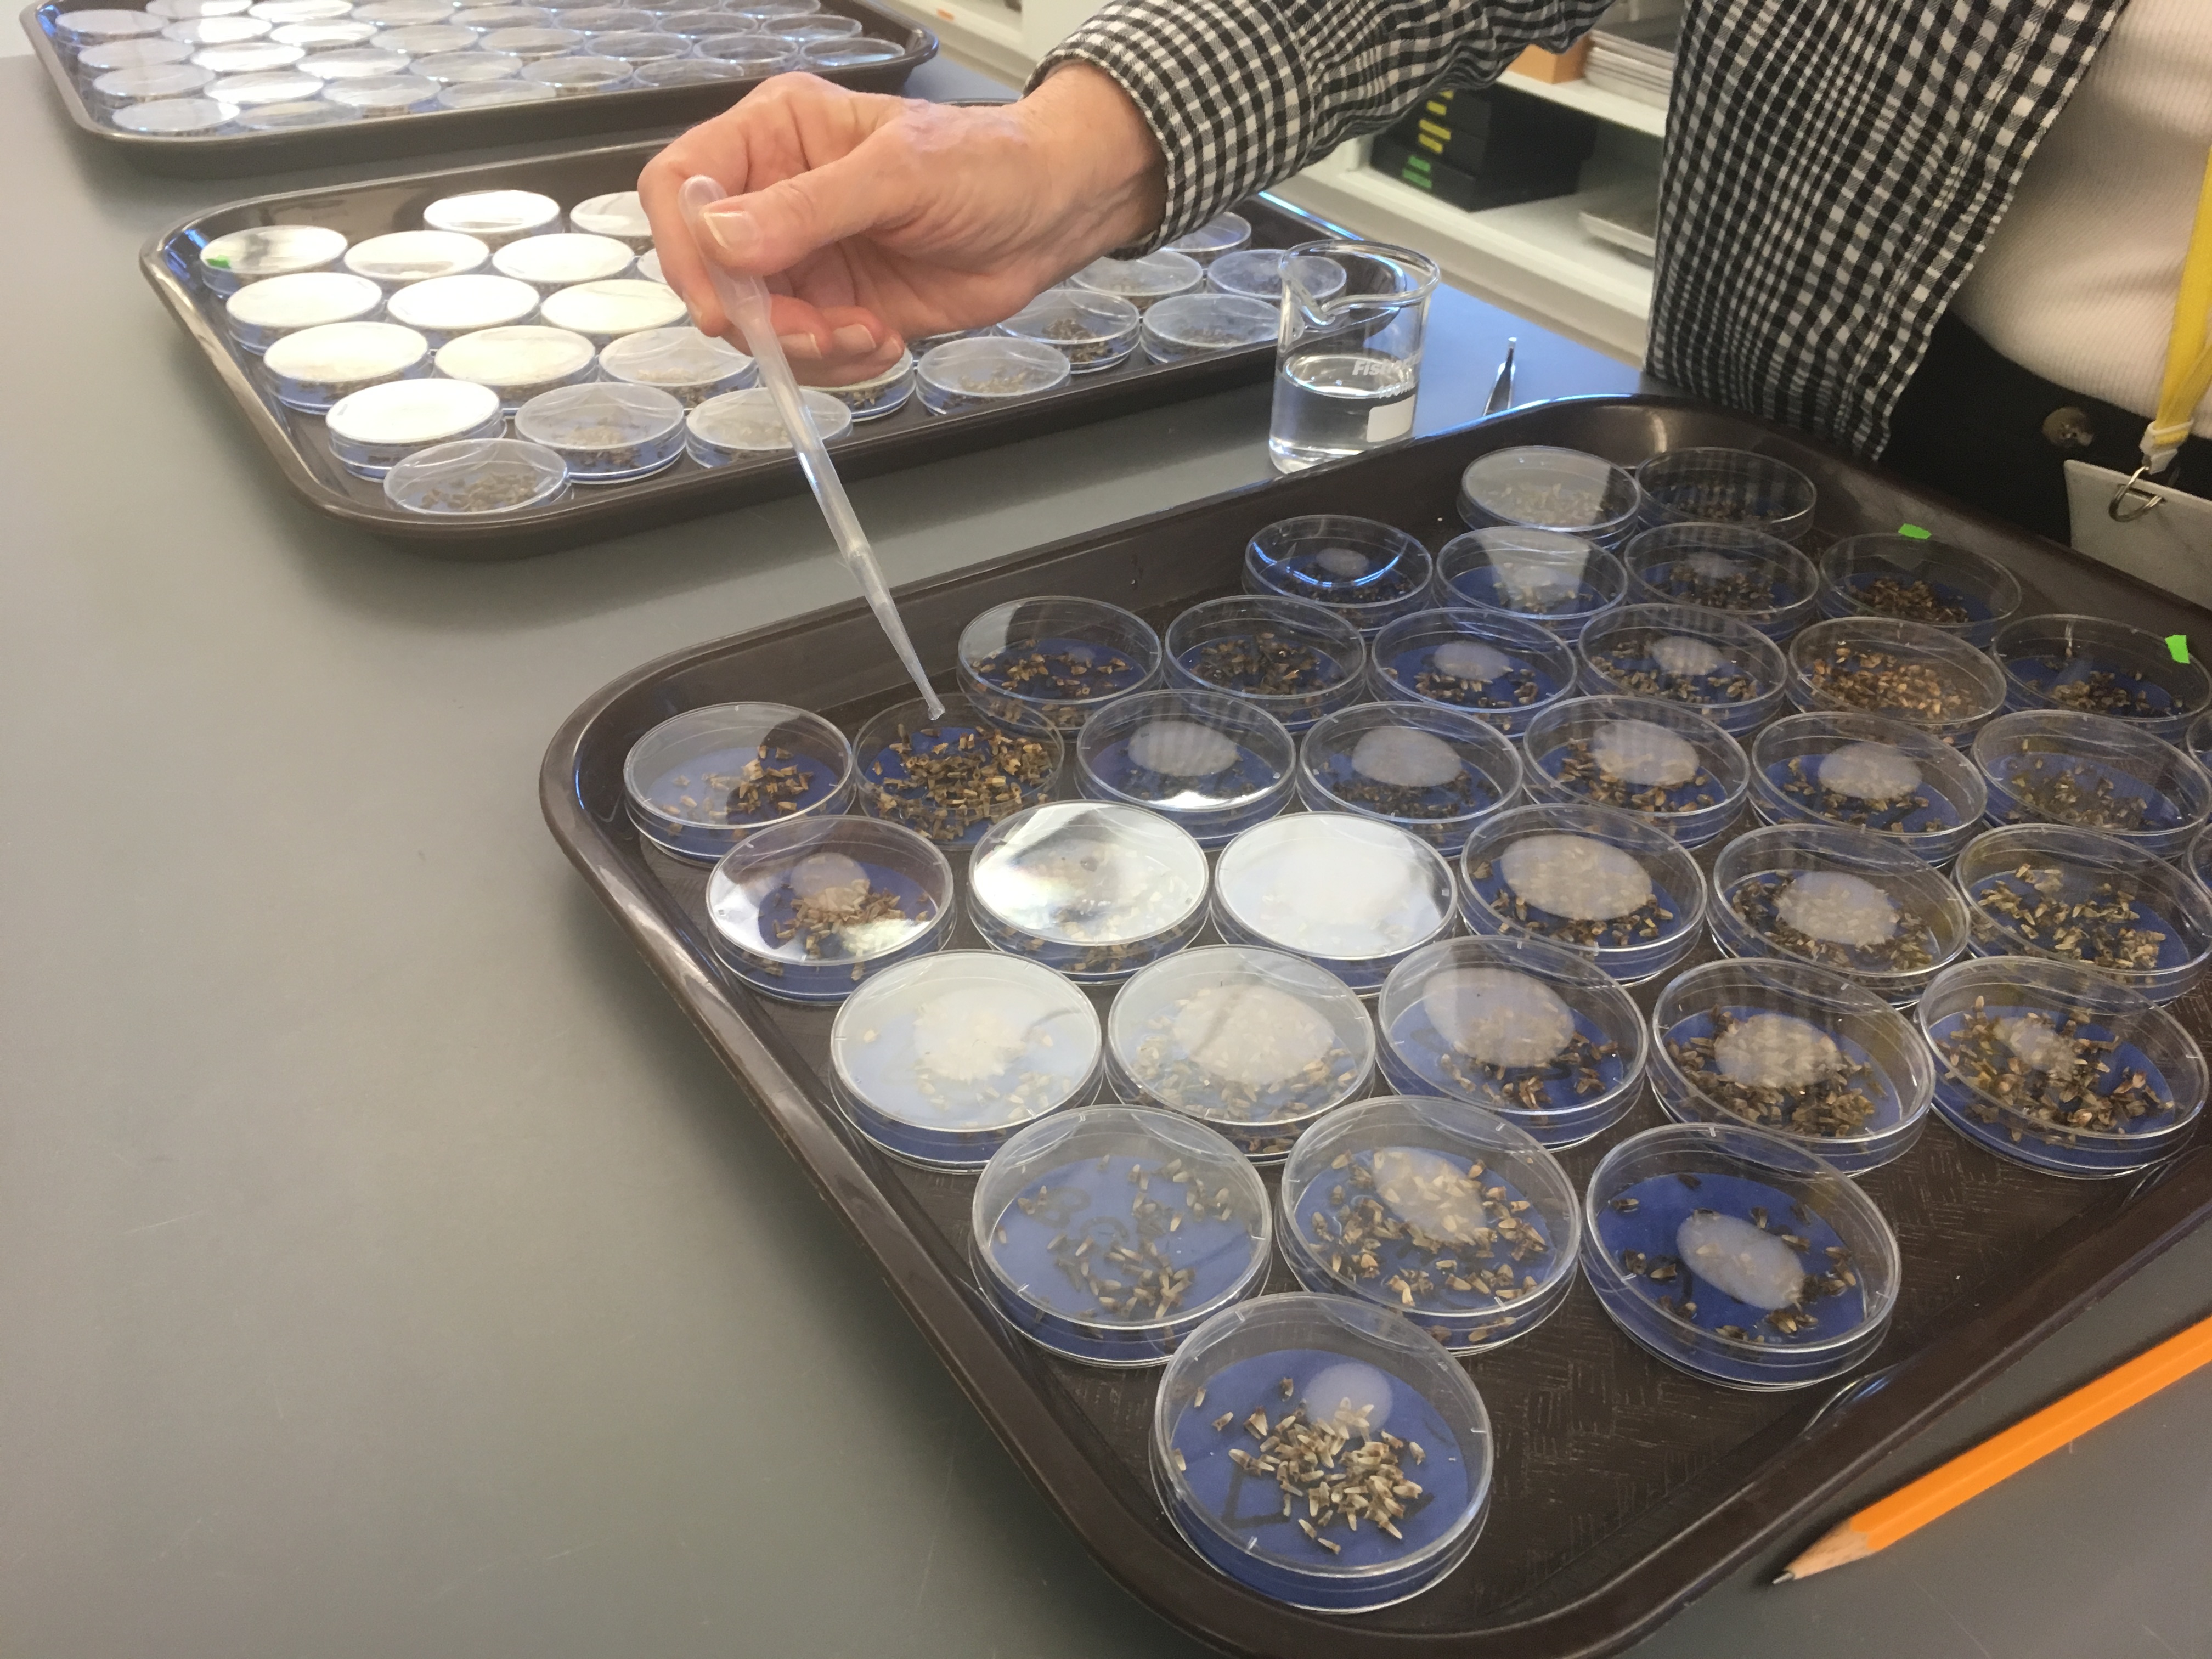
We’ve taken this opportunity to do a small experiment on the shelf life of echinacea achenes. We’re germinating 54 heads total, exactly half of which are from 2016, and half from 2017. If their germination rates differ, we’ll being to get an understanding of how long these seeds are viable for. If they don’t differ, well then I guess echinacea achenes last a pretty long time.
For right now, the achenes are going to spend two weeks in the refrigerator in low light to simulate their “winter.” I’m sure many people would also enjoy a 2-week, 40 degree winter.
Expect updates on the growth of these seeds in about two weeks when we pull them out of the fridge and they begin to sprout! It will very exciting!
 Suzanne giving some water (and a bit plant hormones) to the seeds Stayed tuned in to the flog this week for some exciting plugs for this weeks Unearth Festival!
Michael
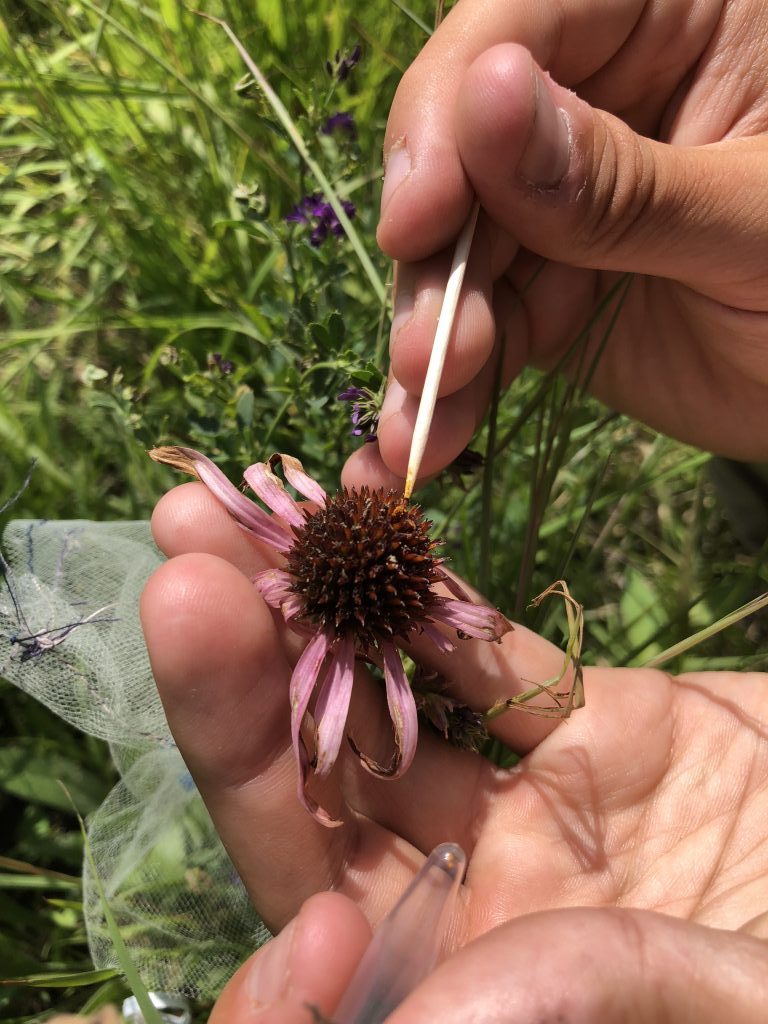
Michael adds pollen to one of the “addition” plants using a toothpick and a vial of collected pollen. Does receiving the maximum amount of pollination vs. no pollen at all affect a plant’s longevity or likelihood of flowering in subsequent years? Since 2012, we have been either adding or excluding pollen from the same plants’ heads to test what role pollen plays in ongoing survival and flowering. Unlike the previous two years, many plants in this experiment flowered this year, and analyzing them will likely reveal interesting results.
This summer, 14 of the 26 plants remaining in the pollen addition and exclusion experiment flowered, for a total of 25 heads. This is the most heads the pollen addition and exclusion project has had since 2013. We continued experimental treatments on these flowering plants and recorded the survival and flowering status of all plants in the experiment. Of the original 38 plants in this experiment, 12 of the exclusion plants and 14 of the pollen addition plants are still alive.
In this experiment, we assess the long-term effects of pollen addition and exclusion on plant fitness. In 2012 and 2013 we identified flowering E. angustifolia plants in experimental plot 1 and randomly assigned one of two treatments to each: pollen addition or pollen exclusion. When plants flower in subsequent years they receive the same treatment they were originally assigned. The increase in flowering rates this year will allow us to move forward with analyzing this data set, to potentially answer this 7-year question.
Start year: 2012
Location: Experimental plot 1
Physical specimens: We harvested 25 flowering heads from this experiment that will be pulled from the normal ACE processing and pushed through faster. This is so we can more quickly determine achene count and proportion of full achenes.
Data collected: Plants survival and flowering data was recorded as part of our annual surveys in P1 and can be found with the rest of the P1 data. Data on when heads had pollen added can be found in CGData/115_pollenLimitation, particularly dailyPollenAddition for the year 2018.
You can find more information about the pollen addition and exclusion experiment and links to previous flog posts regarding this experiment at the background page for the experiment.
This summer Team Echinacea continued adding and excluding aphids to plants in the experiment that Katherine Muller started in 2011. Katherine Muller randomly designated a sample of 100 Echinacea plants in experimental plot 1 for either aphid addition or removal.
Andy managed the project for the team in 2018, making sure that aphids were removed from the exclusion plants, and added to the addition plants. Twice a week, Andy (and occasionally Morgan) visited every plant in the study, recording the number of aphids, ants, and leaves infested. There remain 54 plants in the aphid study, 26 from the aphid addition plants and 28 from the exclusion plants. The data for this year will be added to the ongoing dataset.
Aphis echinaceae is a specialist aphid that is found only on Echinacea angustifolia. Read more about this experiment.
That’s a lot of aphids! Start year: 2011
Location: Experimental Plot 1
Overlaps with: Phenology and fitness in P1
Data collected: All sheets describing the addition and removal of aphids from echinacea are stored in two places. All physical sheets are in Stuart’s manila folder titled “Aphid Add/Ex 2018.” Additionally, all data from the sheets are present in the aphidAdd2018Master and aphidEx2018Master. The exact path of this file may change but is currently ~\Dropbox\teamEchinacea2018\andyHoyt\aphidAddEx2018\aphidDataAllYears
Physical specimens: We harvested 25 flowering heads from this experiment that will be pulled from the normal ACE processing and pushed through faster. This is so we can more quickly determine achene counts and proportions of full achenes.
Products:
- Andy Hoyt’s poster presented at the Fall 2018 Research Symposium at Carleton College.
- 2016 paper by Katherine Muller and Stuart on aphids and foliar herbivory damage on Echinacea
- 2015 paper by Ruth Shaw and Stuart on fitness and demographic consequences of aphid loads
You can read more about the aphid addition and exclusion experiment, as well as links to previous flog entries mentioning the experiment, on the background page for this experiment.
Over 90% of flowering plants rely on insect pollinators for sexual reproduction. Pollination biologists often quantify pollinator effectiveness by counting the number of pollen grains a pollinator deposits on a plant’s stigma in a single visit. However, flowers in the Asteraceae, like Echinacea, are uniovulate, meaning that a there is just one ovule per style. Therefore, it theoretically only takes one viable pollen grain to fully set seed in an Echinacea ovary, which means the standard method of quantifying pollinator effectiveness may not be appropriate for Echinacea and other members of the Asteraceae. In this study, we wanted to estimate how many pollen grains are really necessary to set a seed in Echinacea angustifolia. We performed 60 hand crosses with varying levels of pollen deposited. Each cross consisted of nine total styles of which three were removed before the cross to get estimates of self-pollen deposition, and six styles were crossed with pollen from other flowering individuals. We then collected styles and stained them using fuchsin gel and to count the number of pollen grains using a compound microscope. We x-rayed the achenes, fruits, from the crosses to determine if a seed was present. Preliminary data shows that seed set varies with the pollen grains deposited. These data will advance our understanding of pollinator effectiveness in this uniovulate plant. By increasing our understanding of pollinator efficiency in the Asteraceae we can better predict the consequences of pollinator declines in fragmented habitats, such as the North American tallgrass prairie.
 Mia doing one of her many, many crosses Start year: 2018
Location: exPt2
Overlaps with: The Big Event, Bees Remove and Deposit Pollen
Physical specimens: 183 Echinacea heads were dissected at the College of Wooster in fall 2018. They are currently being processed at CBG.
Data collected: Contact Dr. Jennifer Ison or Mia Stevens for data related to this experiment
Team members who have worked on this project include: Mia Stevens (2018) is the lead on this project.
|
|