|
|
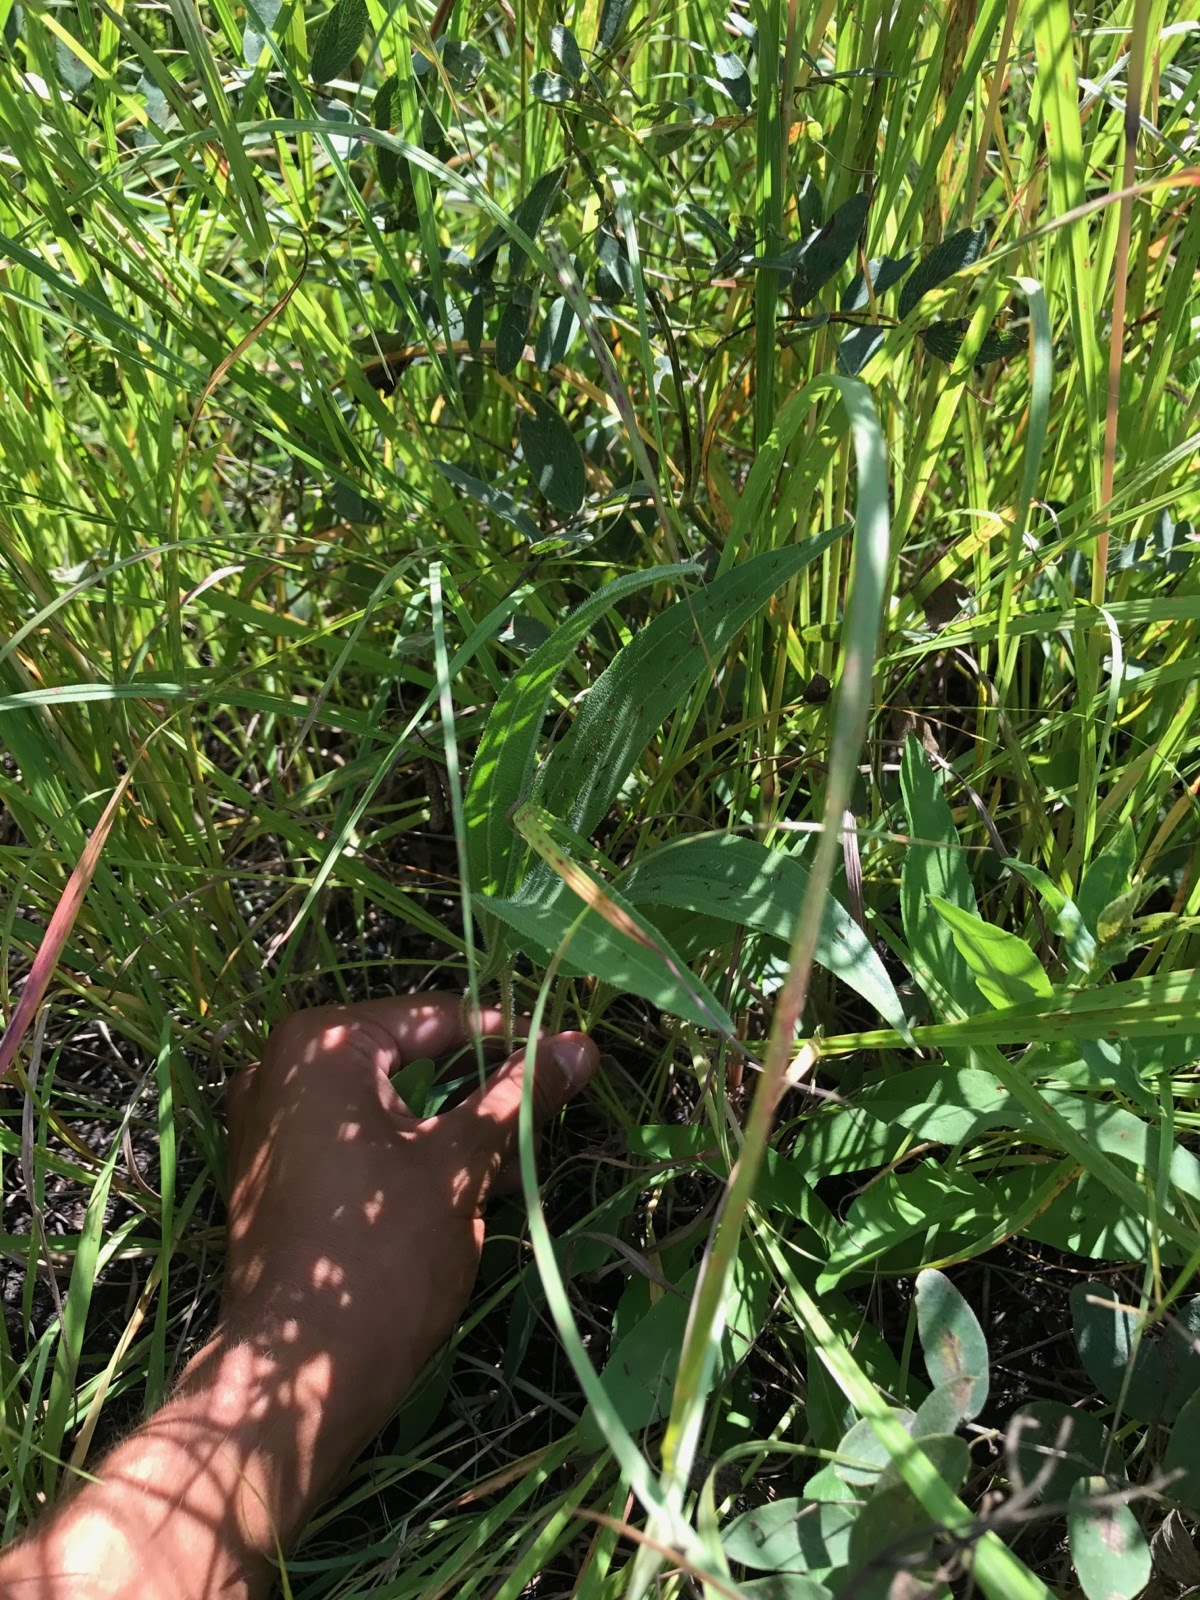
In summer 2018, we again measured Echinacea plants in experimental plot 9 at Hegg Lake. These plants are from open-pollinated E. angustifolia plants near the restoration plot with flowering E. pallida plants. ExPt9 includes some hybrid plants, as determined by DNA fingerprinting techniques. The table below shows the number of plants found alive during each search since the experiment started in 2014. Much like last year, the average surviving plant had about 3 leaves. The average longest leaf was 21 cm, 4 cm shorter than in 2017. We suspect that leaves are shorter this year than last year (25cm in 2017 on average) because of a burn in the Hegg Lake WMA. This year we searched for plants once then rechecked every position where we didn’t find a plant during our first search. No plants flowered this year (no flowering plants yet!).
| Year / Event |
Number Alive |
% Original remaining |
% Of previous year |
| Planting (2014) |
746 |
100 |
N/A |
| 2014 |
638 |
85.5 |
85.5 |
| 2015 |
521 |
69.8 |
81.7 |
| 2016 |
493 |
66.1 |
94.6 |
| 2017 |
401 |
53.8 |
81.3 |
| 2018 |
329 |
44.1 |
82.0 |
This experiment comparing the fitness of Echinacea hybrids with pure-bred E. angustifolia and E. pallida will give insight into the possible consequences of non-native E. pallida being planted in restorations in Minnesota, where E. angustifolia is the only native Echinacea to this area of MN.
 Most exPt9 plants look like this! Start year: 2014
Location: Hegg Lake Wildlife Management Area — experimental plot 9
Overlapping experiments: Echinacea hybrids — experimental plot 6, Echinacea hybrids — experimental plot 7
Data collected: Rosette number, length of all leaves, herbivory for each plant collected electronically and exported to CGData. Recheck information for plants not found was also collected electronically and stored in CGData.
You can find out more information about experimental plot 9 and flog posts mentioning the experiment on the background page for the experiment.
As always, demo was a huge job this year. This season we added 3868 demo records and about 1539 survey records to our database. After over 20 years of this method, we are starting to get a very good idea of the demography of Echinacea in Solem Township.
So how do we do demo? When we find a new flowering Echinacea plant, we give it a tag and get its location with a survey-grade GPS (better than 6 cm precision). Then, we can revisit this plant for years to come and monitor its survival and reproduction. We’re monitoring over 10,000 plants as of 2018. With this many records, organizing demap in the future is going to be a big task!
We made some small adjustments to how we do total demo and flowering demo (we do flowering demo in every remnant now). Now, in our big plots, we only do a sample of the plants instead of total demo. Check out the updated table below (remember we did flowering demo everywhere). We still managed to shoot thousands of points, take even more demography records, and, as always, follow the colored flags!
| Total Demo |
BTG, Common Garden, DOG, East of Town Hall, KJs, Krusemark, Landfill West, Loeffler Corner East, Near Town Hall, Nessman, NNWLF, NRRX, recruit he, recruit hp, recruit hs, recruit el, recruit hw, recruit ke, recruit kw, RRX, RRXDC, South of Golf Course, Steven’s Approach, transplant plot, Tower, Town Hall, West of Aanenson, Woody’s |
| Sample Demo |
Aanenson, Around LF, East Riley, Hegg Lake, Elk Lake Road East, Golf Course, Landfill, Loeffler Corner, North of Golf Course, NWLF, On 27, Riley, Staffanson, Yellow Orchid Hill |
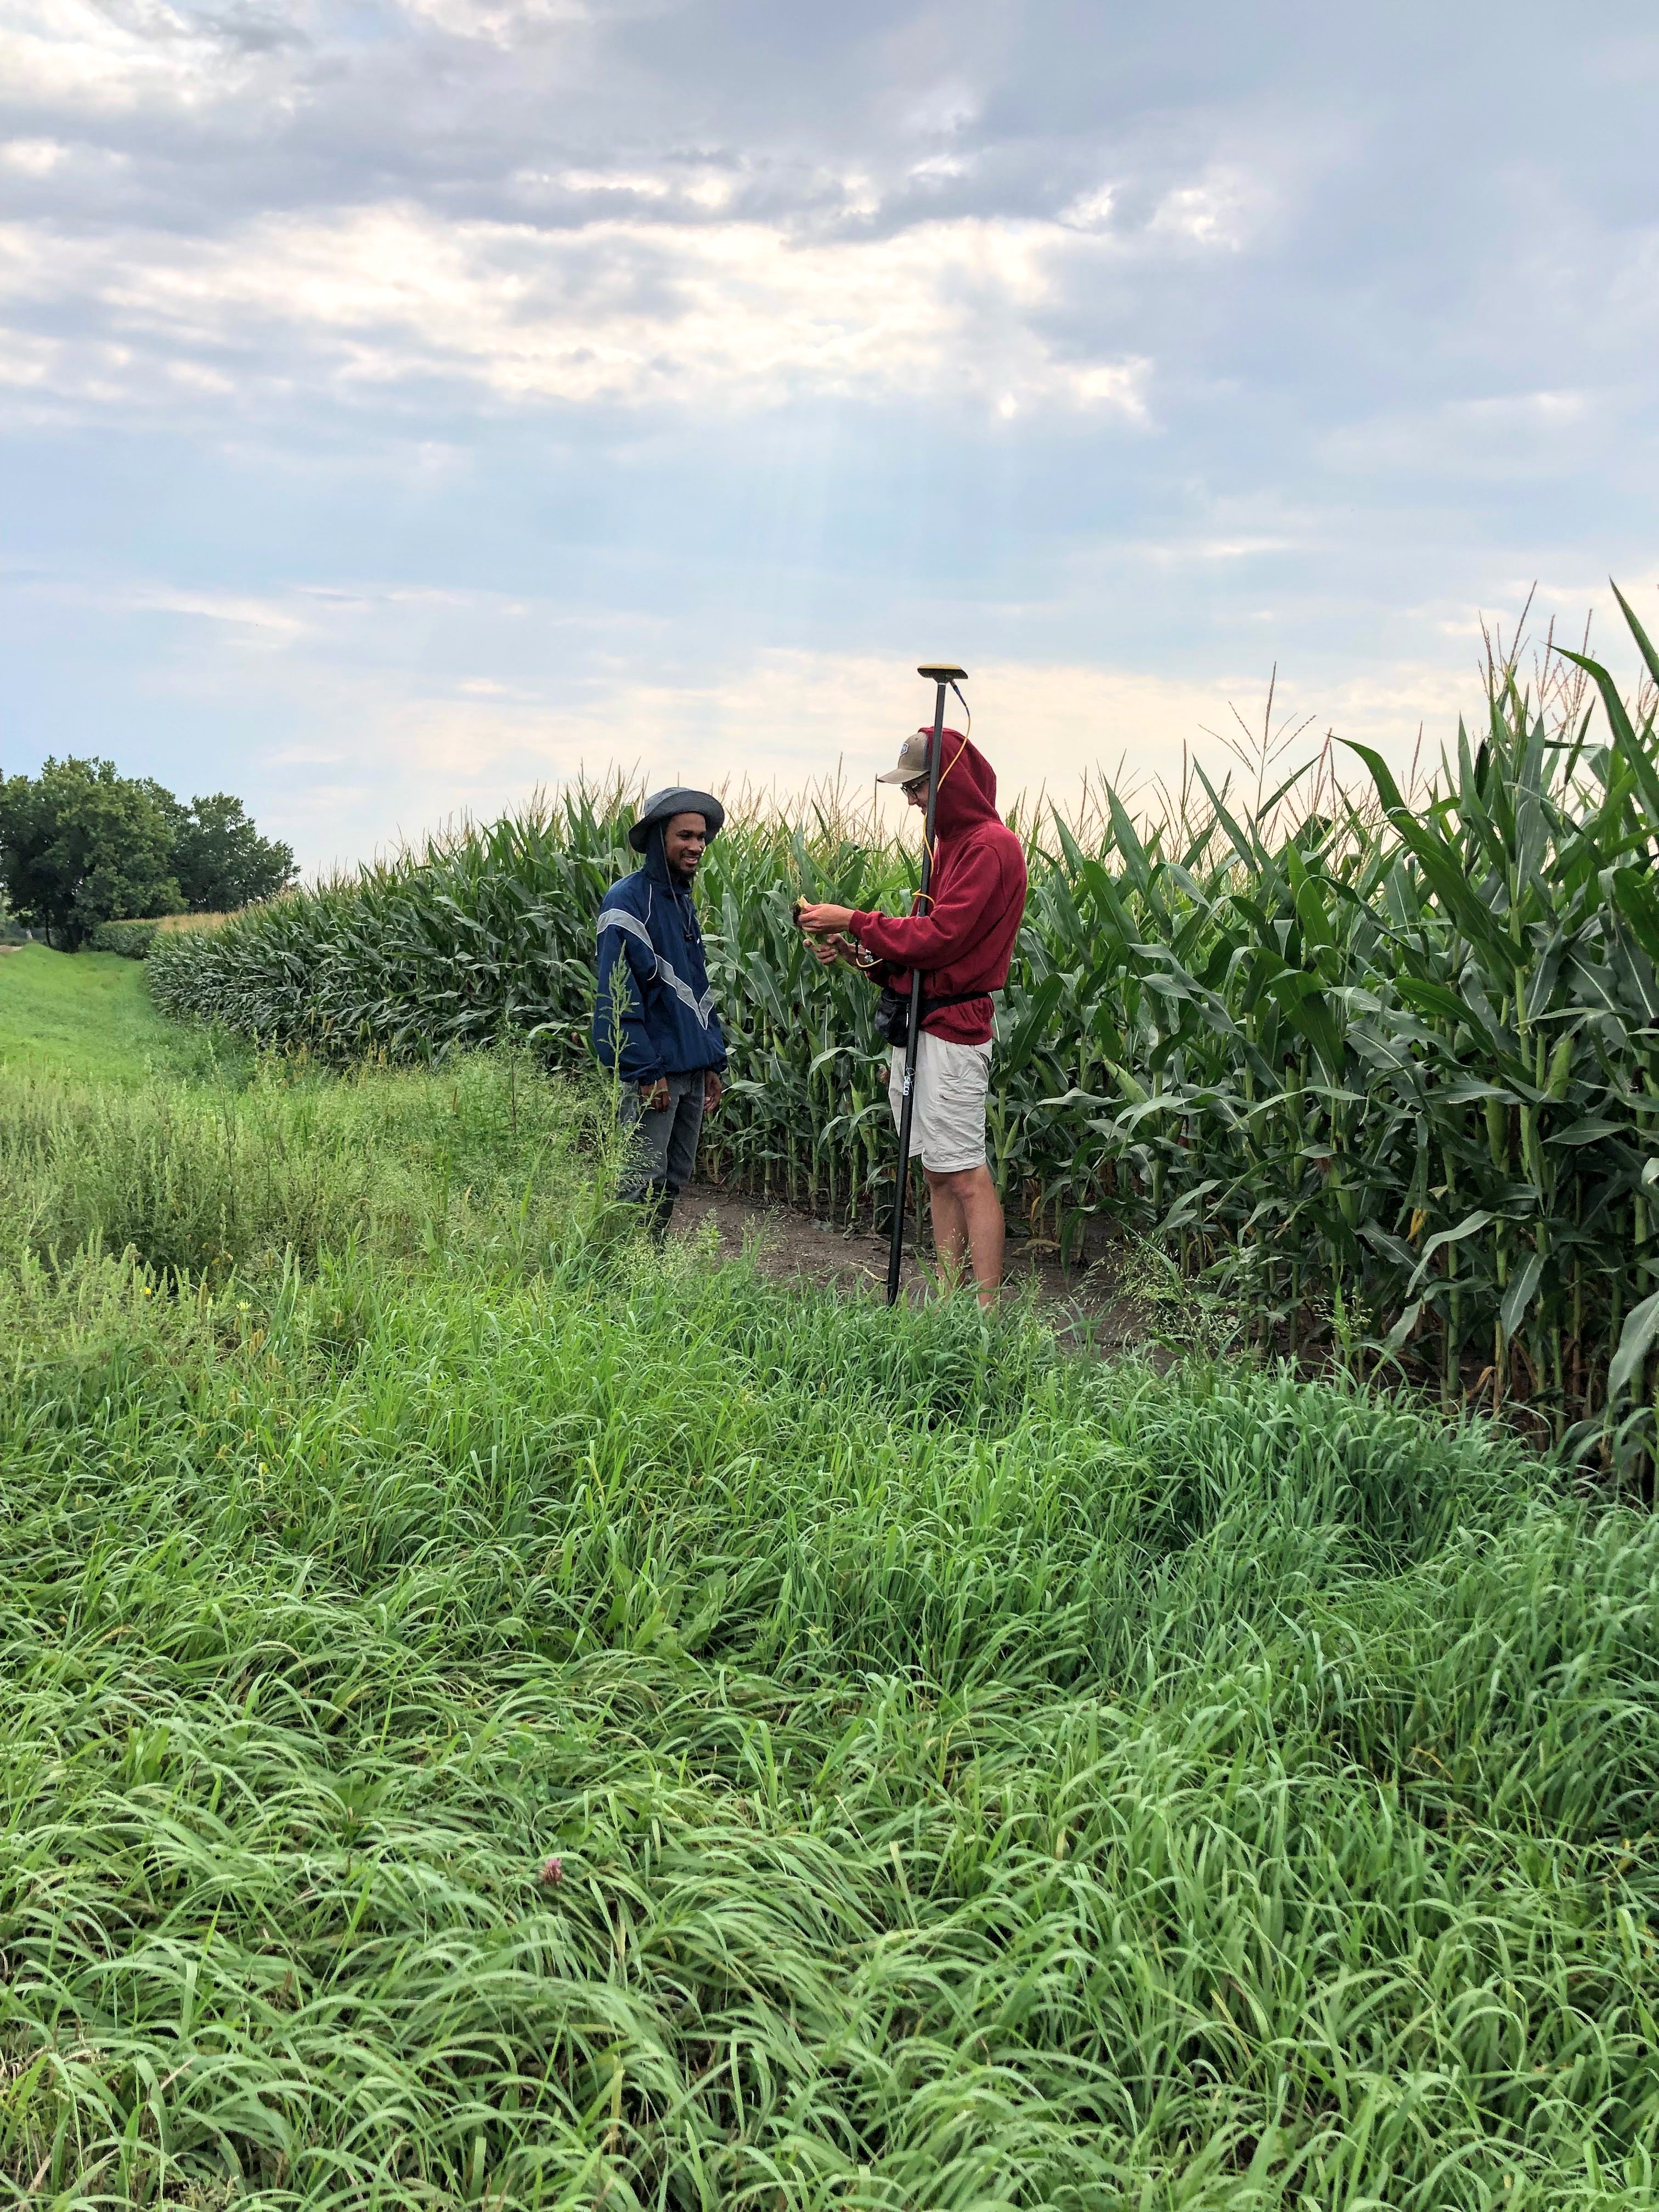
Evan and Will doing demo by the corn. While you might not be able to see the echinacea, we promise, it’s under there! Year started: 1996
Location: Roadsides, railroad rights of way, and nature preserves in and near Solem Township, Minnesota.
Overlaps with: Flowering phenology in remnants, fire and flowering at SPP
Data collected: demo records include Flowering status, number of rosettes, number of heads, neighbors within a 12 cm radius of plants found. These are all taken with PDAs that sync with an MS Access database. They are all transferred to the demap R repository in bitbucket with git version control.
GPS points shot: Points for each flowering plant this year shot mostly in SURV records, stored in surv.csv. Each location should be either associated with a loc from prior years or a point shot this year.
Products:
- Amy Dykstra’s dissertation included matrix projection modeling using demographic data
- Project “demap” merges phenological, spatial and demographic data for remnant plants
You can find out more about the demographic census in the remnants and links to previous posts regarding it on the background page for this experiment.
Hello Flog,
We’re wrapping up another week here at the Garden, but the excitement isn’t over yet! Tomorrow and Sunday at the Chicago Botanic Garden, members of Team Echinacea will be attending the Unearth Science festival. This festival is a great chance for everyone to see what all us scientists do at the Garden on a day-to-day basis.
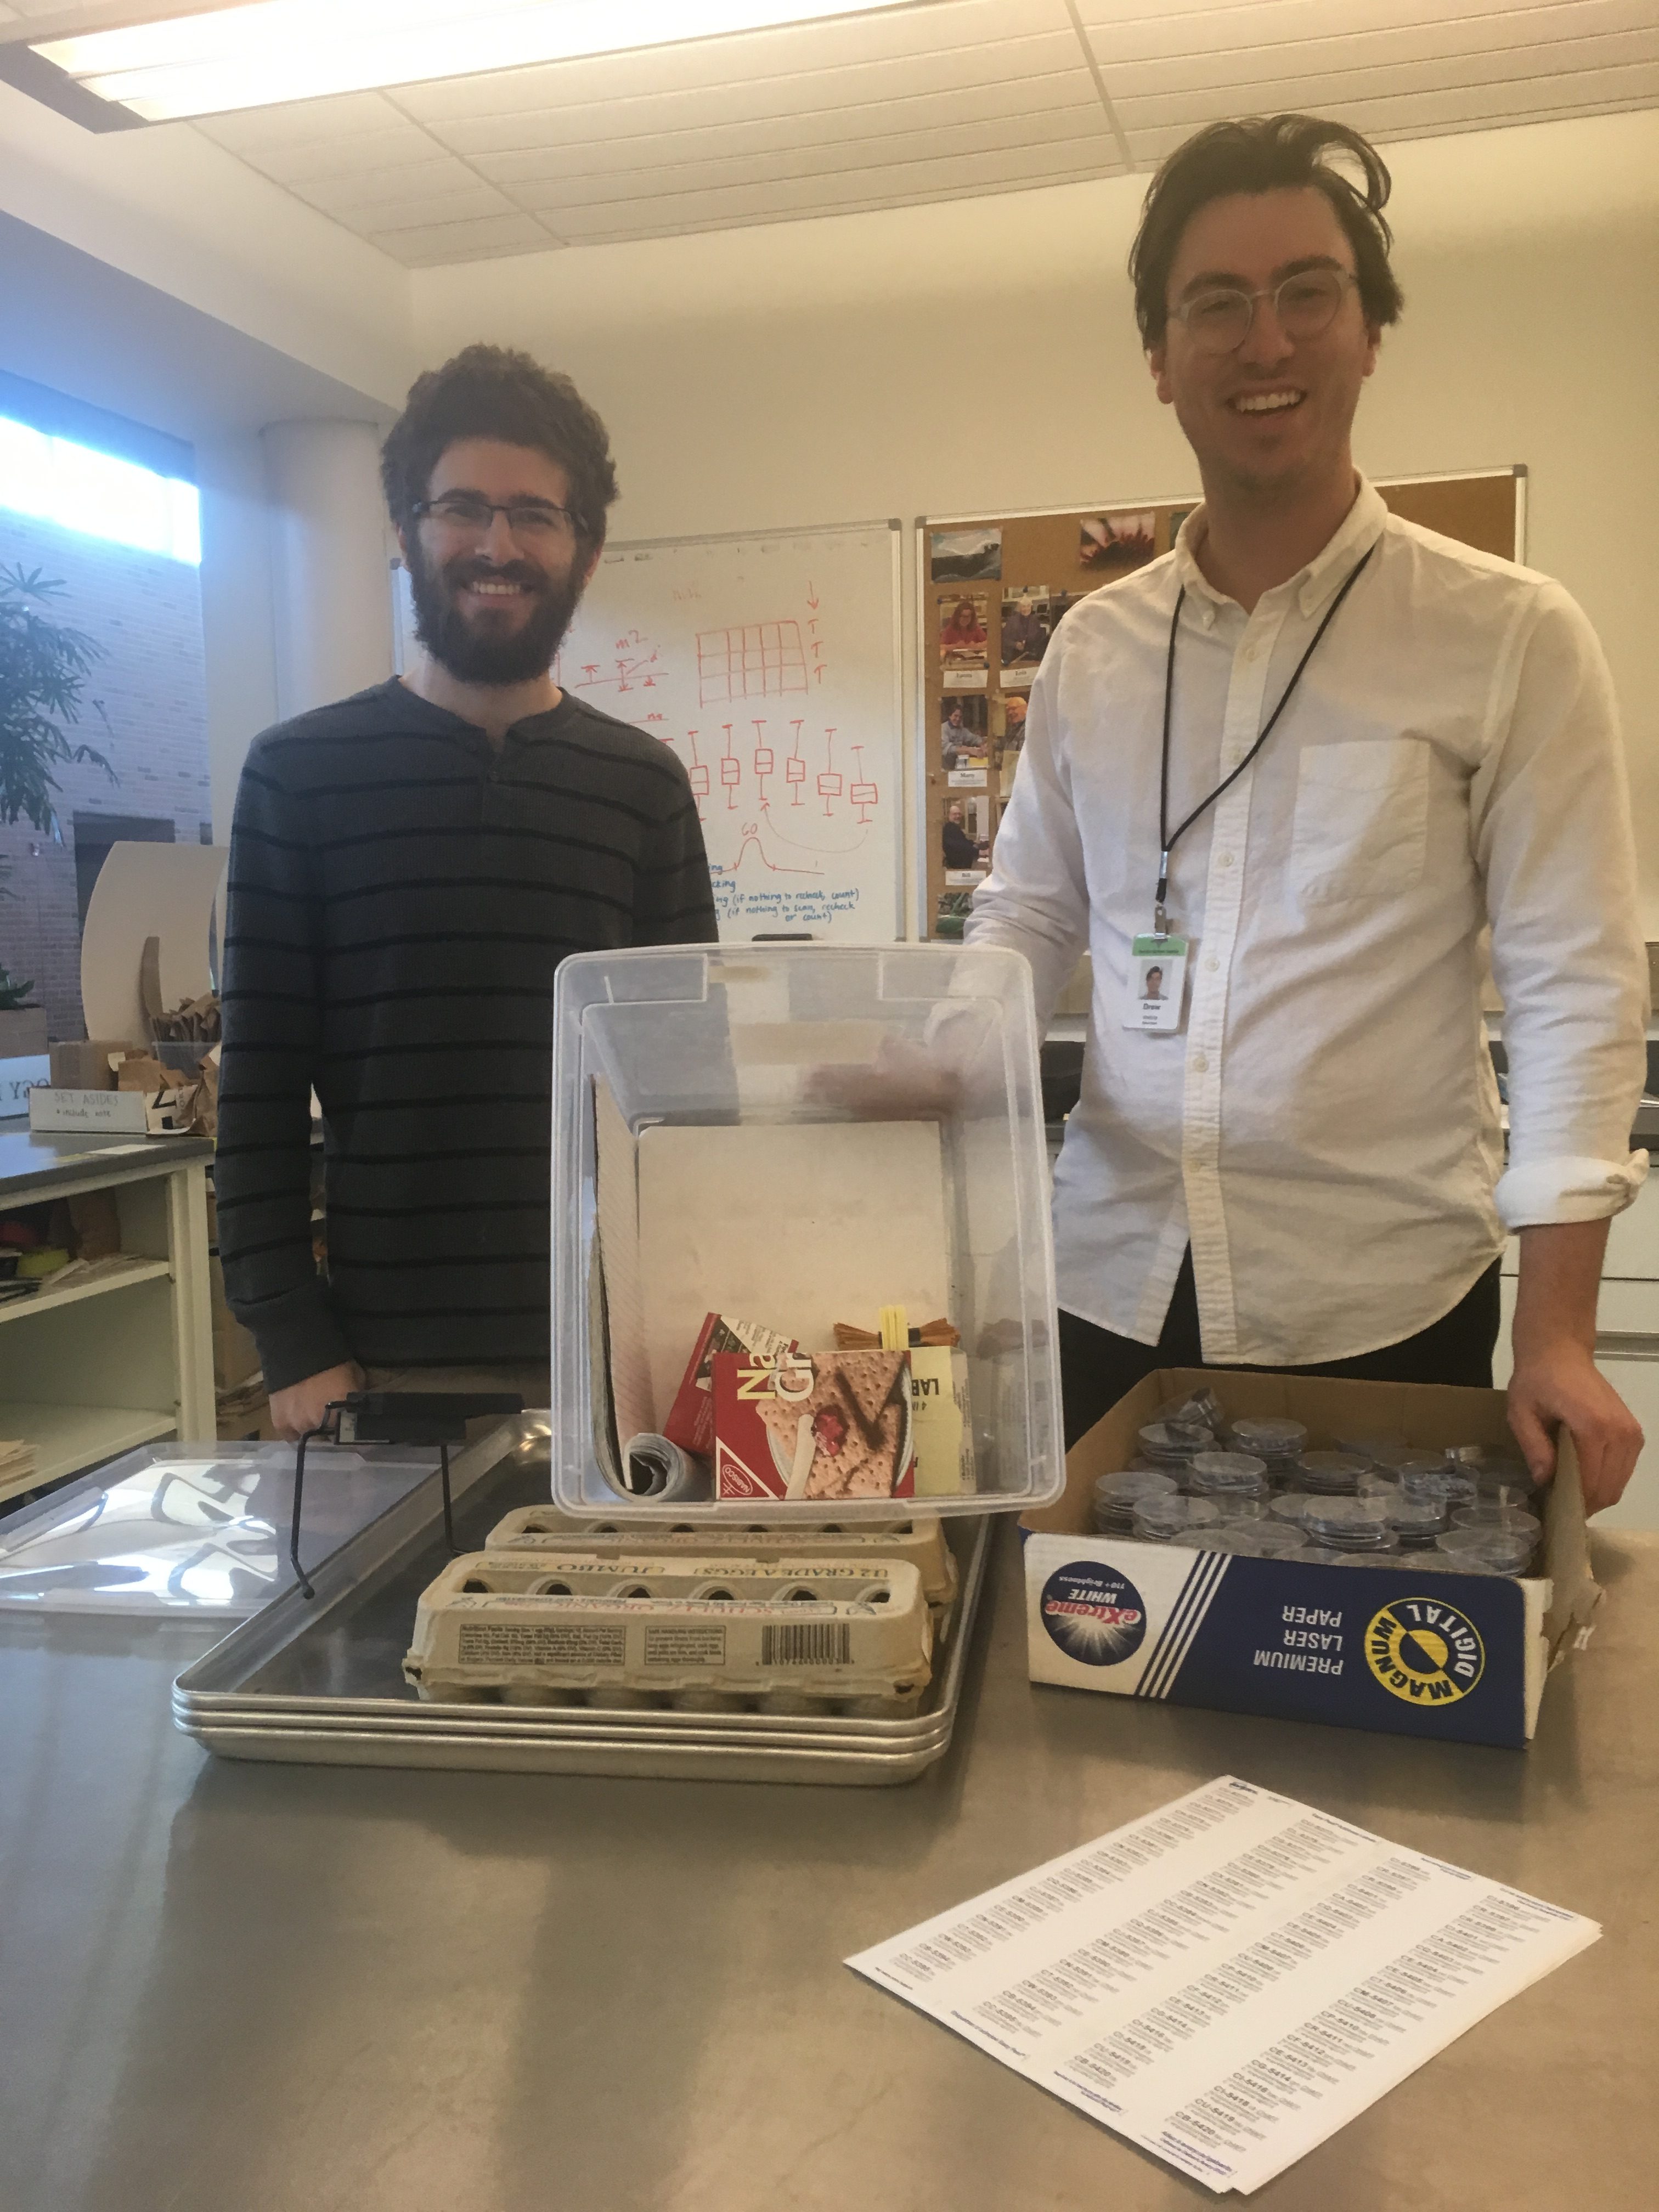
We’ve been coordinating with some of the organizers of this festival, and of course that means that there is going to be an echinacea themed table! We were more than happy to give Drew a bunch of the supplies and samples from our lab so everyone who comes can see what it’s like to process real echinacea plants. Basically, if you come to our table, you’re pretty much part of Team Echinacea! Read all about the festival – and how you can attend – at this link https://www.chicagobotanic.org/sciencefestival
Hope to see you there!
Michael
Michael and Drew with a bunch of Echinacea Lab supplies
 In 2018 only 19% of the plants flowered, despite it being a burn year. Is the 1996 finally showing its age? In 2018, 51 plants flowered of the surviving 269 plants in the 1996 cohort. That means that 41% of the original plants are surviving and 19% of the living individuals flowered. That’s up huge since last year, where only 2% flowered, and the year before where five percent of living individuals flowered. In contrast, however, 45% of living plants flowered in 2015, and 37%, 34%, and 40% flowered in 2014, 2013, and 2012 respectively. We found that of the original 646 individuals, 269 were alive in 2018, only 15 fewer than last year. We are not sure why so many more plants flowered this year. It’s probable that the fire in the plot in fall 2017 influenced flowering rates.
The 1996 cohort has the oldest Echinacea plants in experimental plot 1; they are 22 years old. They are part of a common garden experiment designed to study differences in fitness and life history characteristics among remnant populations. Every year, members of Team Echinacea assess survival and measure plant growth and fitness traits including plant status (i.e. if it is flowering or basal), plant height, leaf count, and number of flowering heads. We harvest all flowering heads in the fall, count all achenes, and estimate seed set for each head in the lab. As yet, these heads are still waiting to be cleaned April 2019.
Start year: 1996
Location: Experimental plot 1
Overlaps with: phenology in experimental plots, qGen3, pollen addition/exclusion
Physical specimens:
- We harvested 59 heads. At present, they await processing in the lab to find their achene count and seed set.
Data collected:
- We used Visors to collect plant growth and fitness traits—plant status, height, leaf count, number of flowering heads, presence of insects—these data have been added to the database
- We used Visors to collect flowering phenology data—start and end date of flowering for all individual heads—which is ready to be added to the exPt1 phenology dataset
- Eventually, we will have achene count and seed set data for all flowering plants (stay tuned)
Products:
- See the exPt1 core dataset where yrPlanted == ‘1996’ for 1996 cohort fitness measurements
- Amy Waananen’s paper, Mating opportunity increases with synchrony of flowering among years more than synchrony within years in a nonmasting perennial, published last year in The American Naturalist, was based on plants in this cohort.
You can find more information about the 1996 cohort and links to previous flog posts regarding this experiment at the background page for the experiment.
Spring is here! The birds have returned and some plants are finally starting to poke up after a (seemingly) very long winter. Of course, you know what that means! It’s time to get planting!
While many people will take this opportunity to begin growing their garden, here at the Echinacea Project we’re taking the opportunity to… well, grow more echinacea!
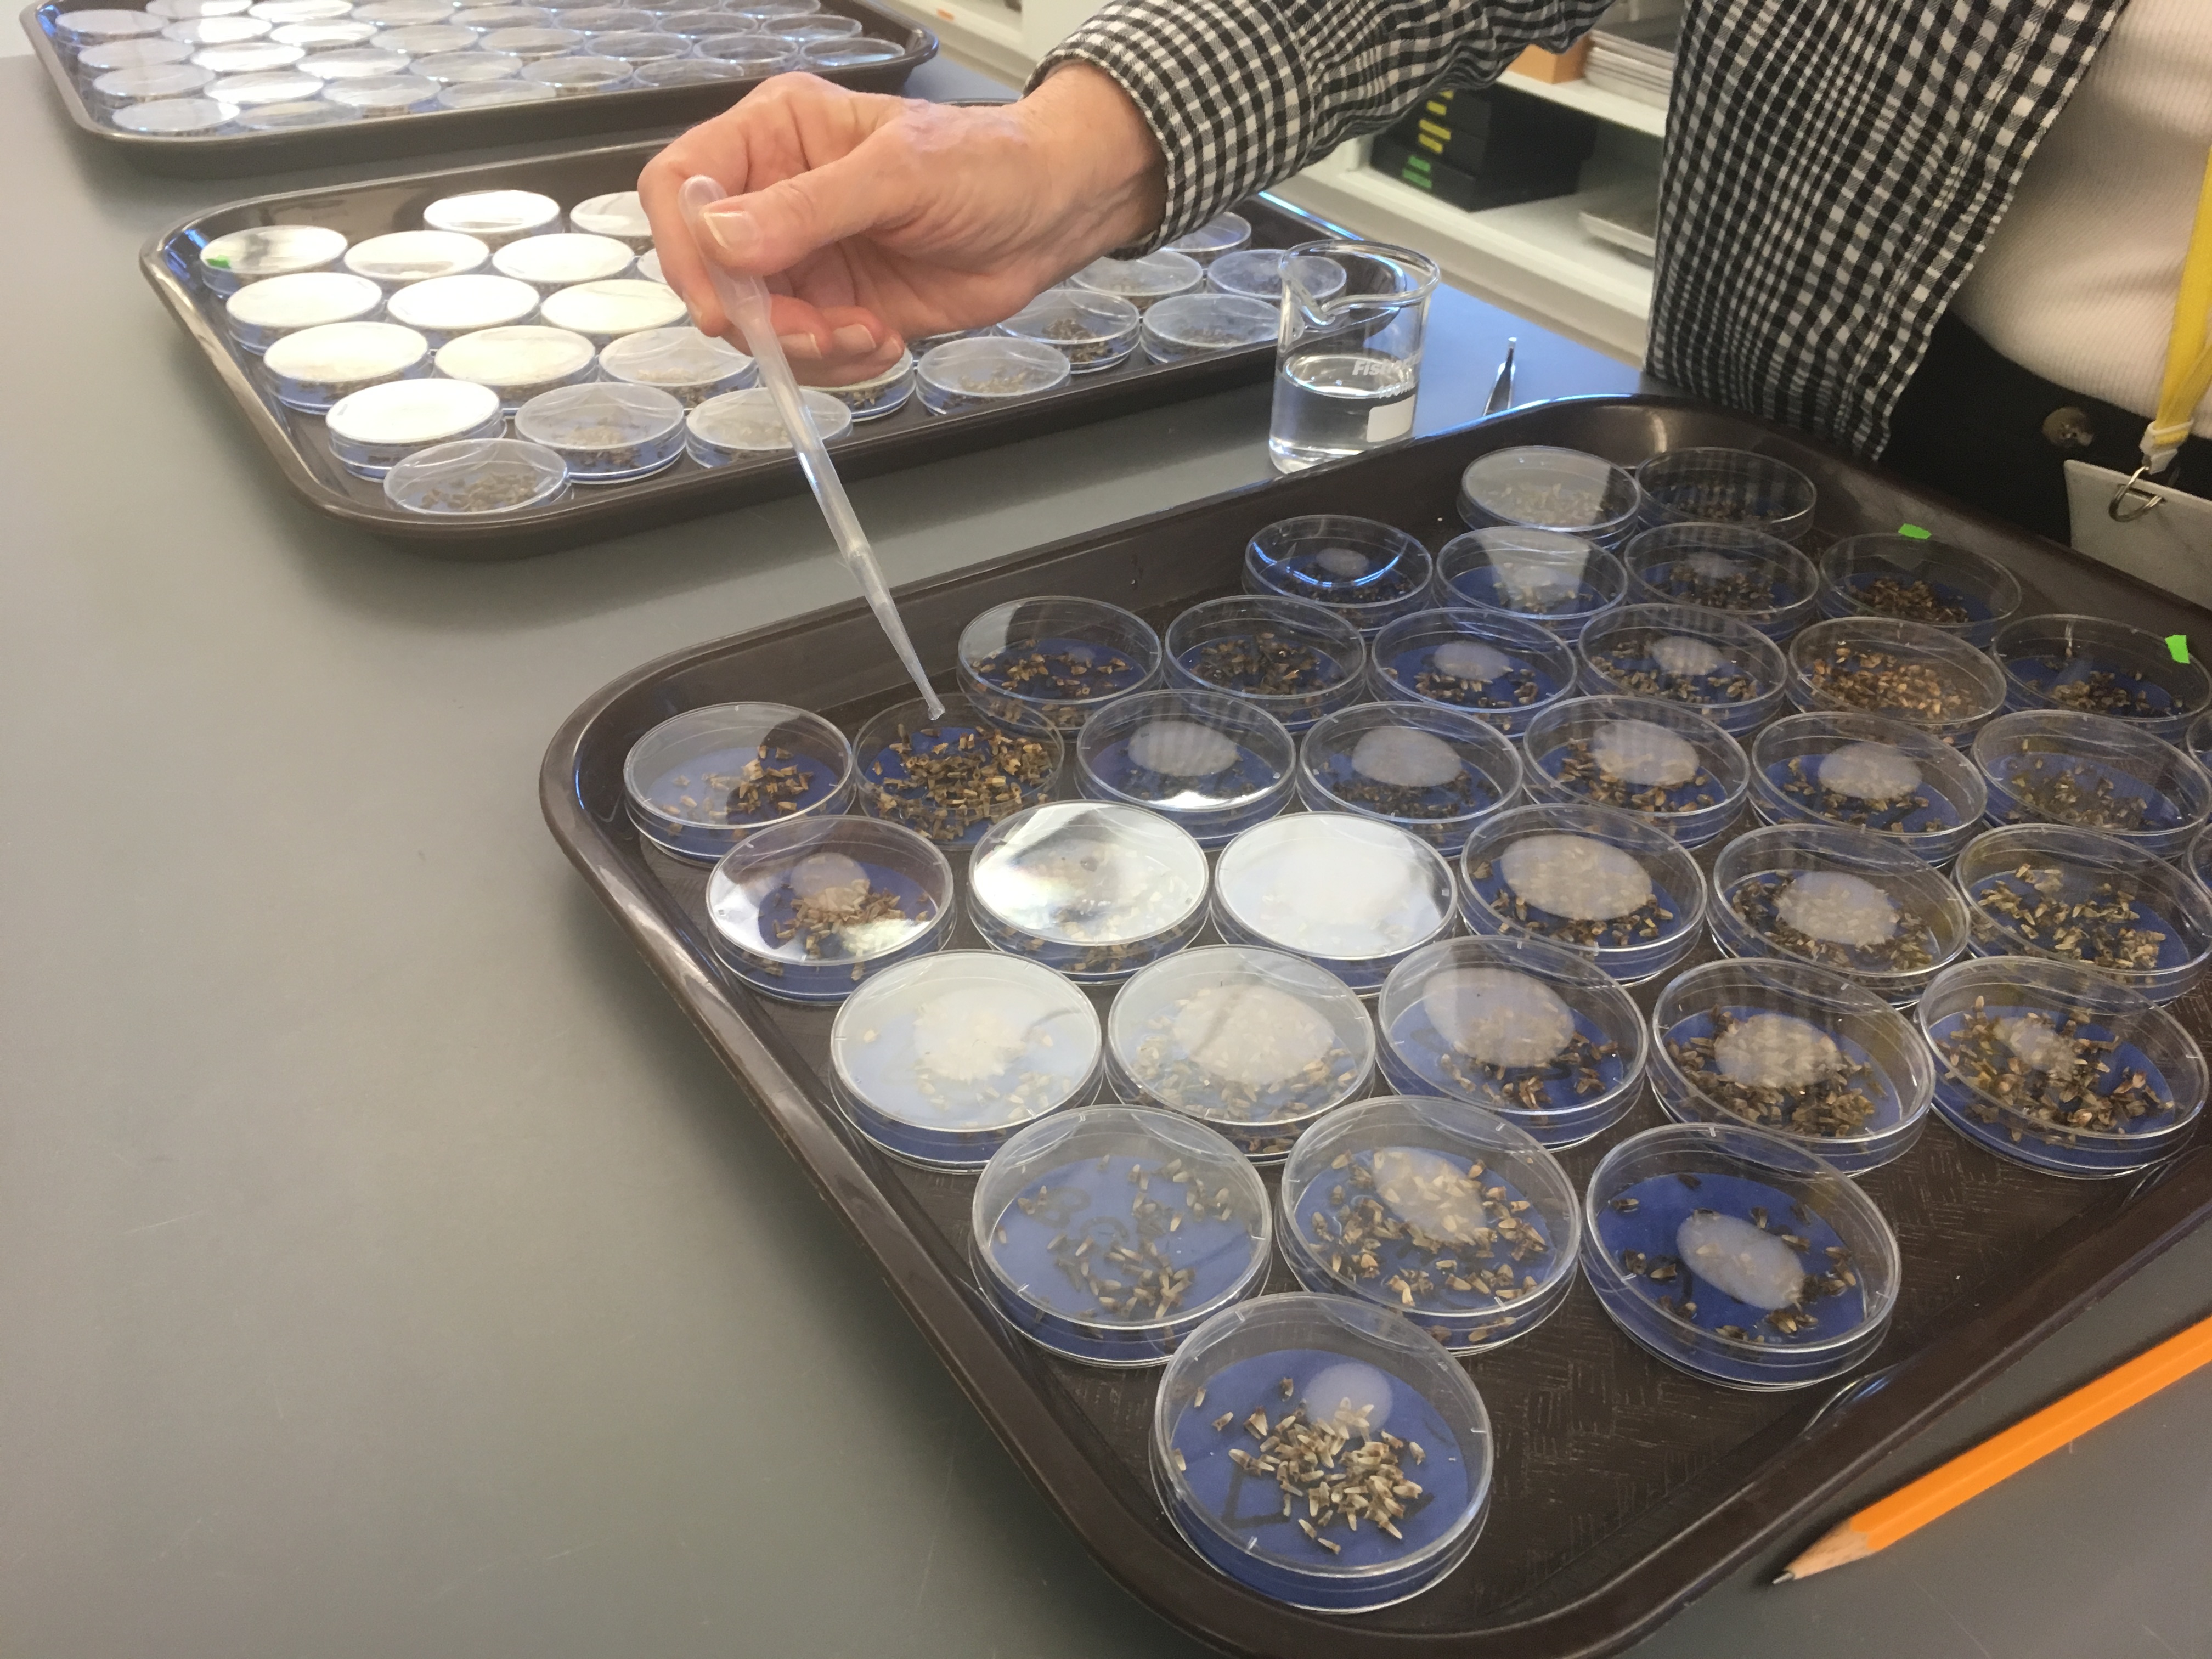
We’ve taken this opportunity to do a small experiment on the shelf life of echinacea achenes. We’re germinating 54 heads total, exactly half of which are from 2016, and half from 2017. If their germination rates differ, we’ll being to get an understanding of how long these seeds are viable for. If they don’t differ, well then I guess echinacea achenes last a pretty long time.
For right now, the achenes are going to spend two weeks in the refrigerator in low light to simulate their “winter.” I’m sure many people would also enjoy a 2-week, 40 degree winter.
Expect updates on the growth of these seeds in about two weeks when we pull them out of the fridge and they begin to sprout! It will very exciting!
 Suzanne giving some water (and a bit plant hormones) to the seeds Stayed tuned in to the flog this week for some exciting plugs for this weeks Unearth Festival!
Michael
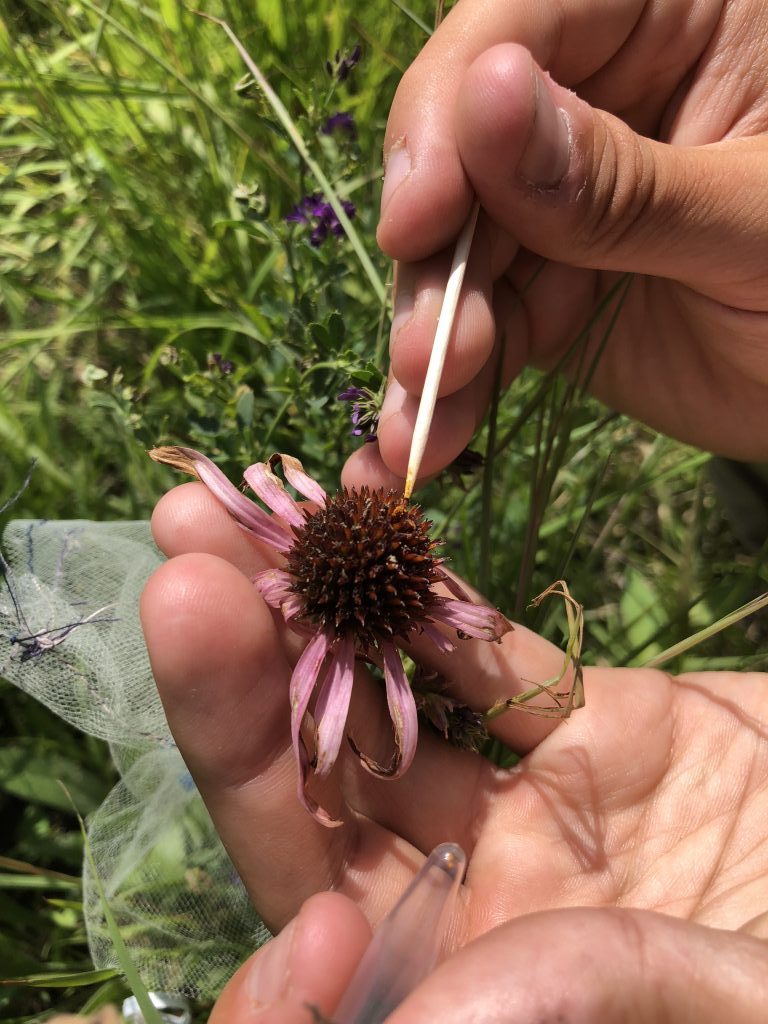
Michael adds pollen to one of the “addition” plants using a toothpick and a vial of collected pollen. Does receiving the maximum amount of pollination vs. no pollen at all affect a plant’s longevity or likelihood of flowering in subsequent years? Since 2012, we have been either adding or excluding pollen from the same plants’ heads to test what role pollen plays in ongoing survival and flowering. Unlike the previous two years, many plants in this experiment flowered this year, and analyzing them will likely reveal interesting results.
This summer, 14 of the 26 plants remaining in the pollen addition and exclusion experiment flowered, for a total of 25 heads. This is the most heads the pollen addition and exclusion project has had since 2013. We continued experimental treatments on these flowering plants and recorded the survival and flowering status of all plants in the experiment. Of the original 38 plants in this experiment, 12 of the exclusion plants and 14 of the pollen addition plants are still alive.
In this experiment, we assess the long-term effects of pollen addition and exclusion on plant fitness. In 2012 and 2013 we identified flowering E. angustifolia plants in experimental plot 1 and randomly assigned one of two treatments to each: pollen addition or pollen exclusion. When plants flower in subsequent years they receive the same treatment they were originally assigned. The increase in flowering rates this year will allow us to move forward with analyzing this data set, to potentially answer this 7-year question.
Start year: 2012
Location: Experimental plot 1
Physical specimens: We harvested 25 flowering heads from this experiment that will be pulled from the normal ACE processing and pushed through faster. This is so we can more quickly determine achene count and proportion of full achenes.
Data collected: Plants survival and flowering data was recorded as part of our annual surveys in P1 and can be found with the rest of the P1 data. Data on when heads had pollen added can be found in CGData/115_pollenLimitation, particularly dailyPollenAddition for the year 2018.
You can find more information about the pollen addition and exclusion experiment and links to previous flog posts regarding this experiment at the background page for the experiment.
This summer Team Echinacea continued adding and excluding aphids to plants in the experiment that Katherine Muller started in 2011. Katherine Muller randomly designated a sample of 100 Echinacea plants in experimental plot 1 for either aphid addition or removal.
Andy managed the project for the team in 2018, making sure that aphids were removed from the exclusion plants, and added to the addition plants. Twice a week, Andy (and occasionally Morgan) visited every plant in the study, recording the number of aphids, ants, and leaves infested. There remain 54 plants in the aphid study, 26 from the aphid addition plants and 28 from the exclusion plants. The data for this year will be added to the ongoing dataset.
Aphis echinaceae is a specialist aphid that is found only on Echinacea angustifolia. Read more about this experiment.
That’s a lot of aphids! Start year: 2011
Location: Experimental Plot 1
Overlaps with: Phenology and fitness in P1
Data collected: All sheets describing the addition and removal of aphids from echinacea are stored in two places. All physical sheets are in Stuart’s manila folder titled “Aphid Add/Ex 2018.” Additionally, all data from the sheets are present in the aphidAdd2018Master and aphidEx2018Master. The exact path of this file may change but is currently ~\Dropbox\teamEchinacea2018\andyHoyt\aphidAddEx2018\aphidDataAllYears
Physical specimens: We harvested 25 flowering heads from this experiment that will be pulled from the normal ACE processing and pushed through faster. This is so we can more quickly determine achene counts and proportions of full achenes.
Products:
- Andy Hoyt’s poster presented at the Fall 2018 Research Symposium at Carleton College.
- 2016 paper by Katherine Muller and Stuart on aphids and foliar herbivory damage on Echinacea
- 2015 paper by Ruth Shaw and Stuart on fitness and demographic consequences of aphid loads
You can read more about the aphid addition and exclusion experiment, as well as links to previous flog entries mentioning the experiment, on the background page for this experiment.
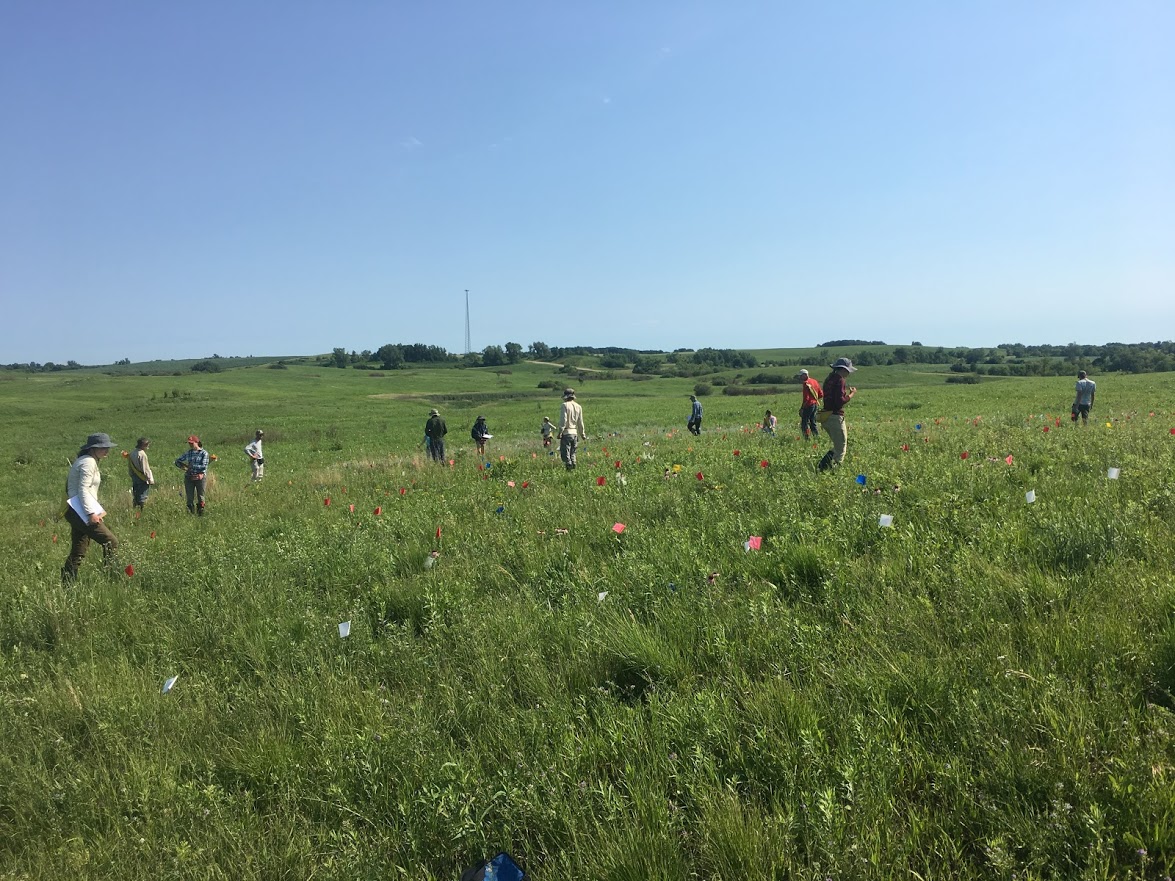
In plant populations where reproduction is mate-limited, the potential exists for selection on floral traits through both male and female function (seed production and siring success). Selection could be strong because of high variation in both male and female fitness. Additionally, most plants rely on a number of generalist insect pollinators, each of which is likely imposing selection on plant traits associated with reproduction. In many plant species, these generalist pollinators are native solitary bees. However, pollination research mainly focuses on large social bees—bumblebees and the non-native honeybee.
The main objective of this research project is to quantify how four generalist solitary bee taxa contribute to male and female fitness in the mate-limited prairie perennial, Echinacea angustifolia. To accomplish this objective, 15 researchers worked together to monitor the complete pollinator visitation in a prairie community with over 200 flowering Echinacea individuals during five days in July 2018. Through this effort, we recorded over 700 individual bee visits to a flowering Echinacea plant. To assess seed set, we removed achenes from Echinacea seedheads produced during the five observations day and xrayed the achenes for viable embryos.
Currently, we are germinating the resulting seeds and taking leaf samples. This summer, we will extract DNA from the leaf samples and genotype each sample at 11 previously optimized Echinacea-specific microsatellite loci. We will use a full paternity maximum likelihood analysis to quantify siring success mediated by the different generalist bee taxa. Our results will advance our understanding of relationships between male, female, and total fitness in plant populations. Our results will also reveal how different pollinators may cause variation in fitness. These results can help us predict the effects of changing pollinator communities for fragmented plant populations.
Everyone in exPt2 looking for bees Start year: 2018
Location: exPt2
Overlaps with: Bees Remove and Deposit Pollen, Pollen to Seed
Physical specimens: 183 Echinacea Heads are currently being processed at CBG
Data collected: Contact Dr. Jennifer Ison for data related to this experiment
Team members who have worked on this project include: Everyone in 2018! The big event was just that- a few very big events
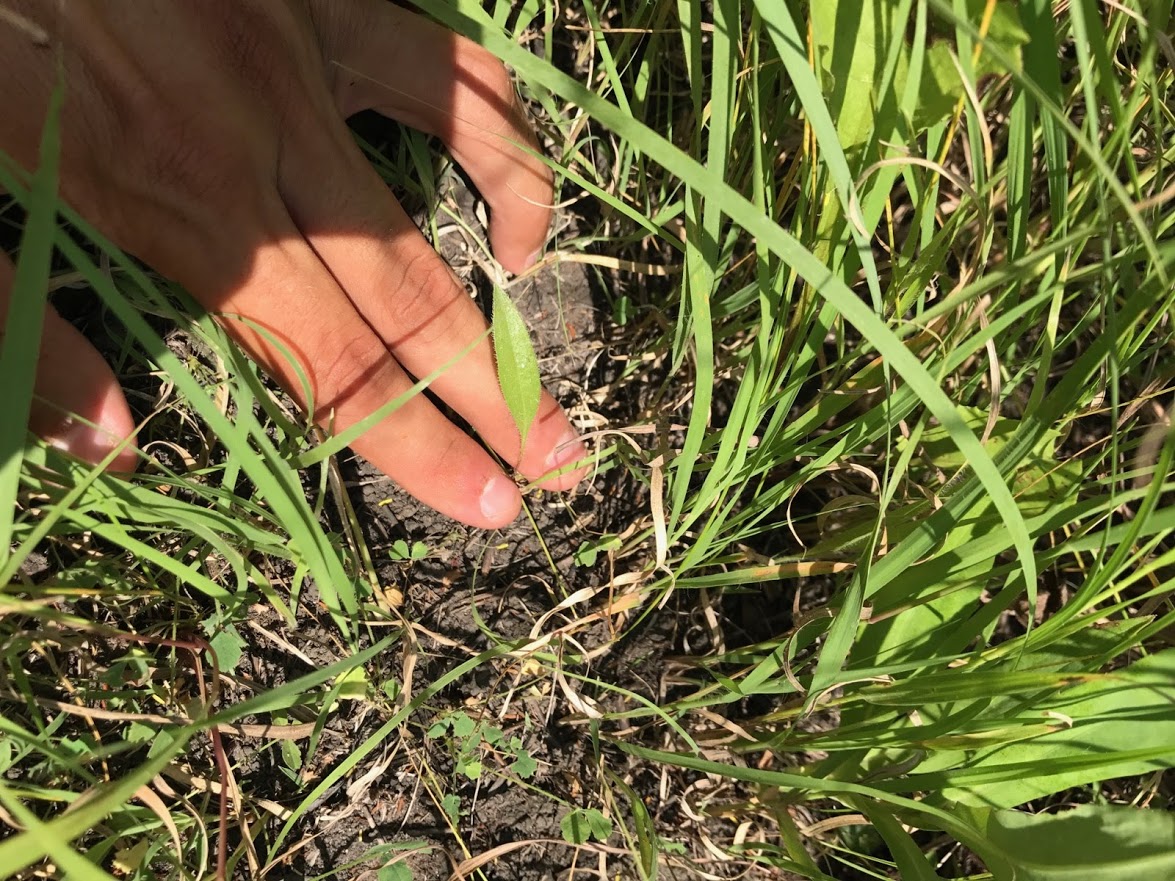
In 2018, we checked 80* focal plants at 12 remnants for nearby seedlings found in previous years. We found 97 out of the original 955 seedlings (26 fewer than the 123 found last summer). Although challenging to obtain, information about the early stages of E. angustifolia in remnants is critical to understanding the demography of these remnant populations. With still no flowering plants, it is plain to see how long it takes for Echinacea to begin flowering.
Between the summers of 2007 and 2013, team Echinacea observed the recruitment of Echinacea angustifolia seedlings around focal plants at 13 different prairie remnants. The locations of these seedlings were mapped relative to each focal plant and the seedlings (now former seedlings) are revisited each year. For each of these former seedlings, we make a record each year updating its status (e.g., basal, not found), rosette count, and leaf lengths. We also try to update the maps, which are kept on paper and passed down through the years, each person using a different color ink. As you can imagine, they are quite colorful & marked up by now.
It can be tough to find small plants like this one! Year started: 2007
Location: East Elk Lake Road, East Riley, East of Town Hall, KJ’s, Loeffler’s Corner, Landfill, Nessman, Riley, Steven’s Approach, South of Golf Course remnants and Staffanson Prairie Preserve.
Overlaps with: Demographic census in remnants
Data collected:
- Electronic records of status, leaf measurements, rosette count, and 12-cm neighbors for each seedling. Currently in Pendragon database
- Updated paper maps with status of searched-for plants and helpful landmarks
Products: Amy Dykstra used seedling survival data from 2010 and 2011 to model population growth rates as a part of her dissertation.
You can read more about the seedling establishment experiment and links to previous flog entries about the experiment on the background page for this experiment.
* This number originally read 119, which is incorrect according to the sling master datasheet from 2018. EE edited this on 8 Jan 2020 while writing the PSR for 2019. I encourage someone to correct this number if it is now incorrect but to the best of my knowledge 80 is the number of maternal plants/circles visited.
Hi Flog!
As I’ve said before, here at the Echinacea Project we rely pretty heavily on the work done by our volunteers. That is why I am so excited to introduce you to the newest member of Team Echinacea: Priti!
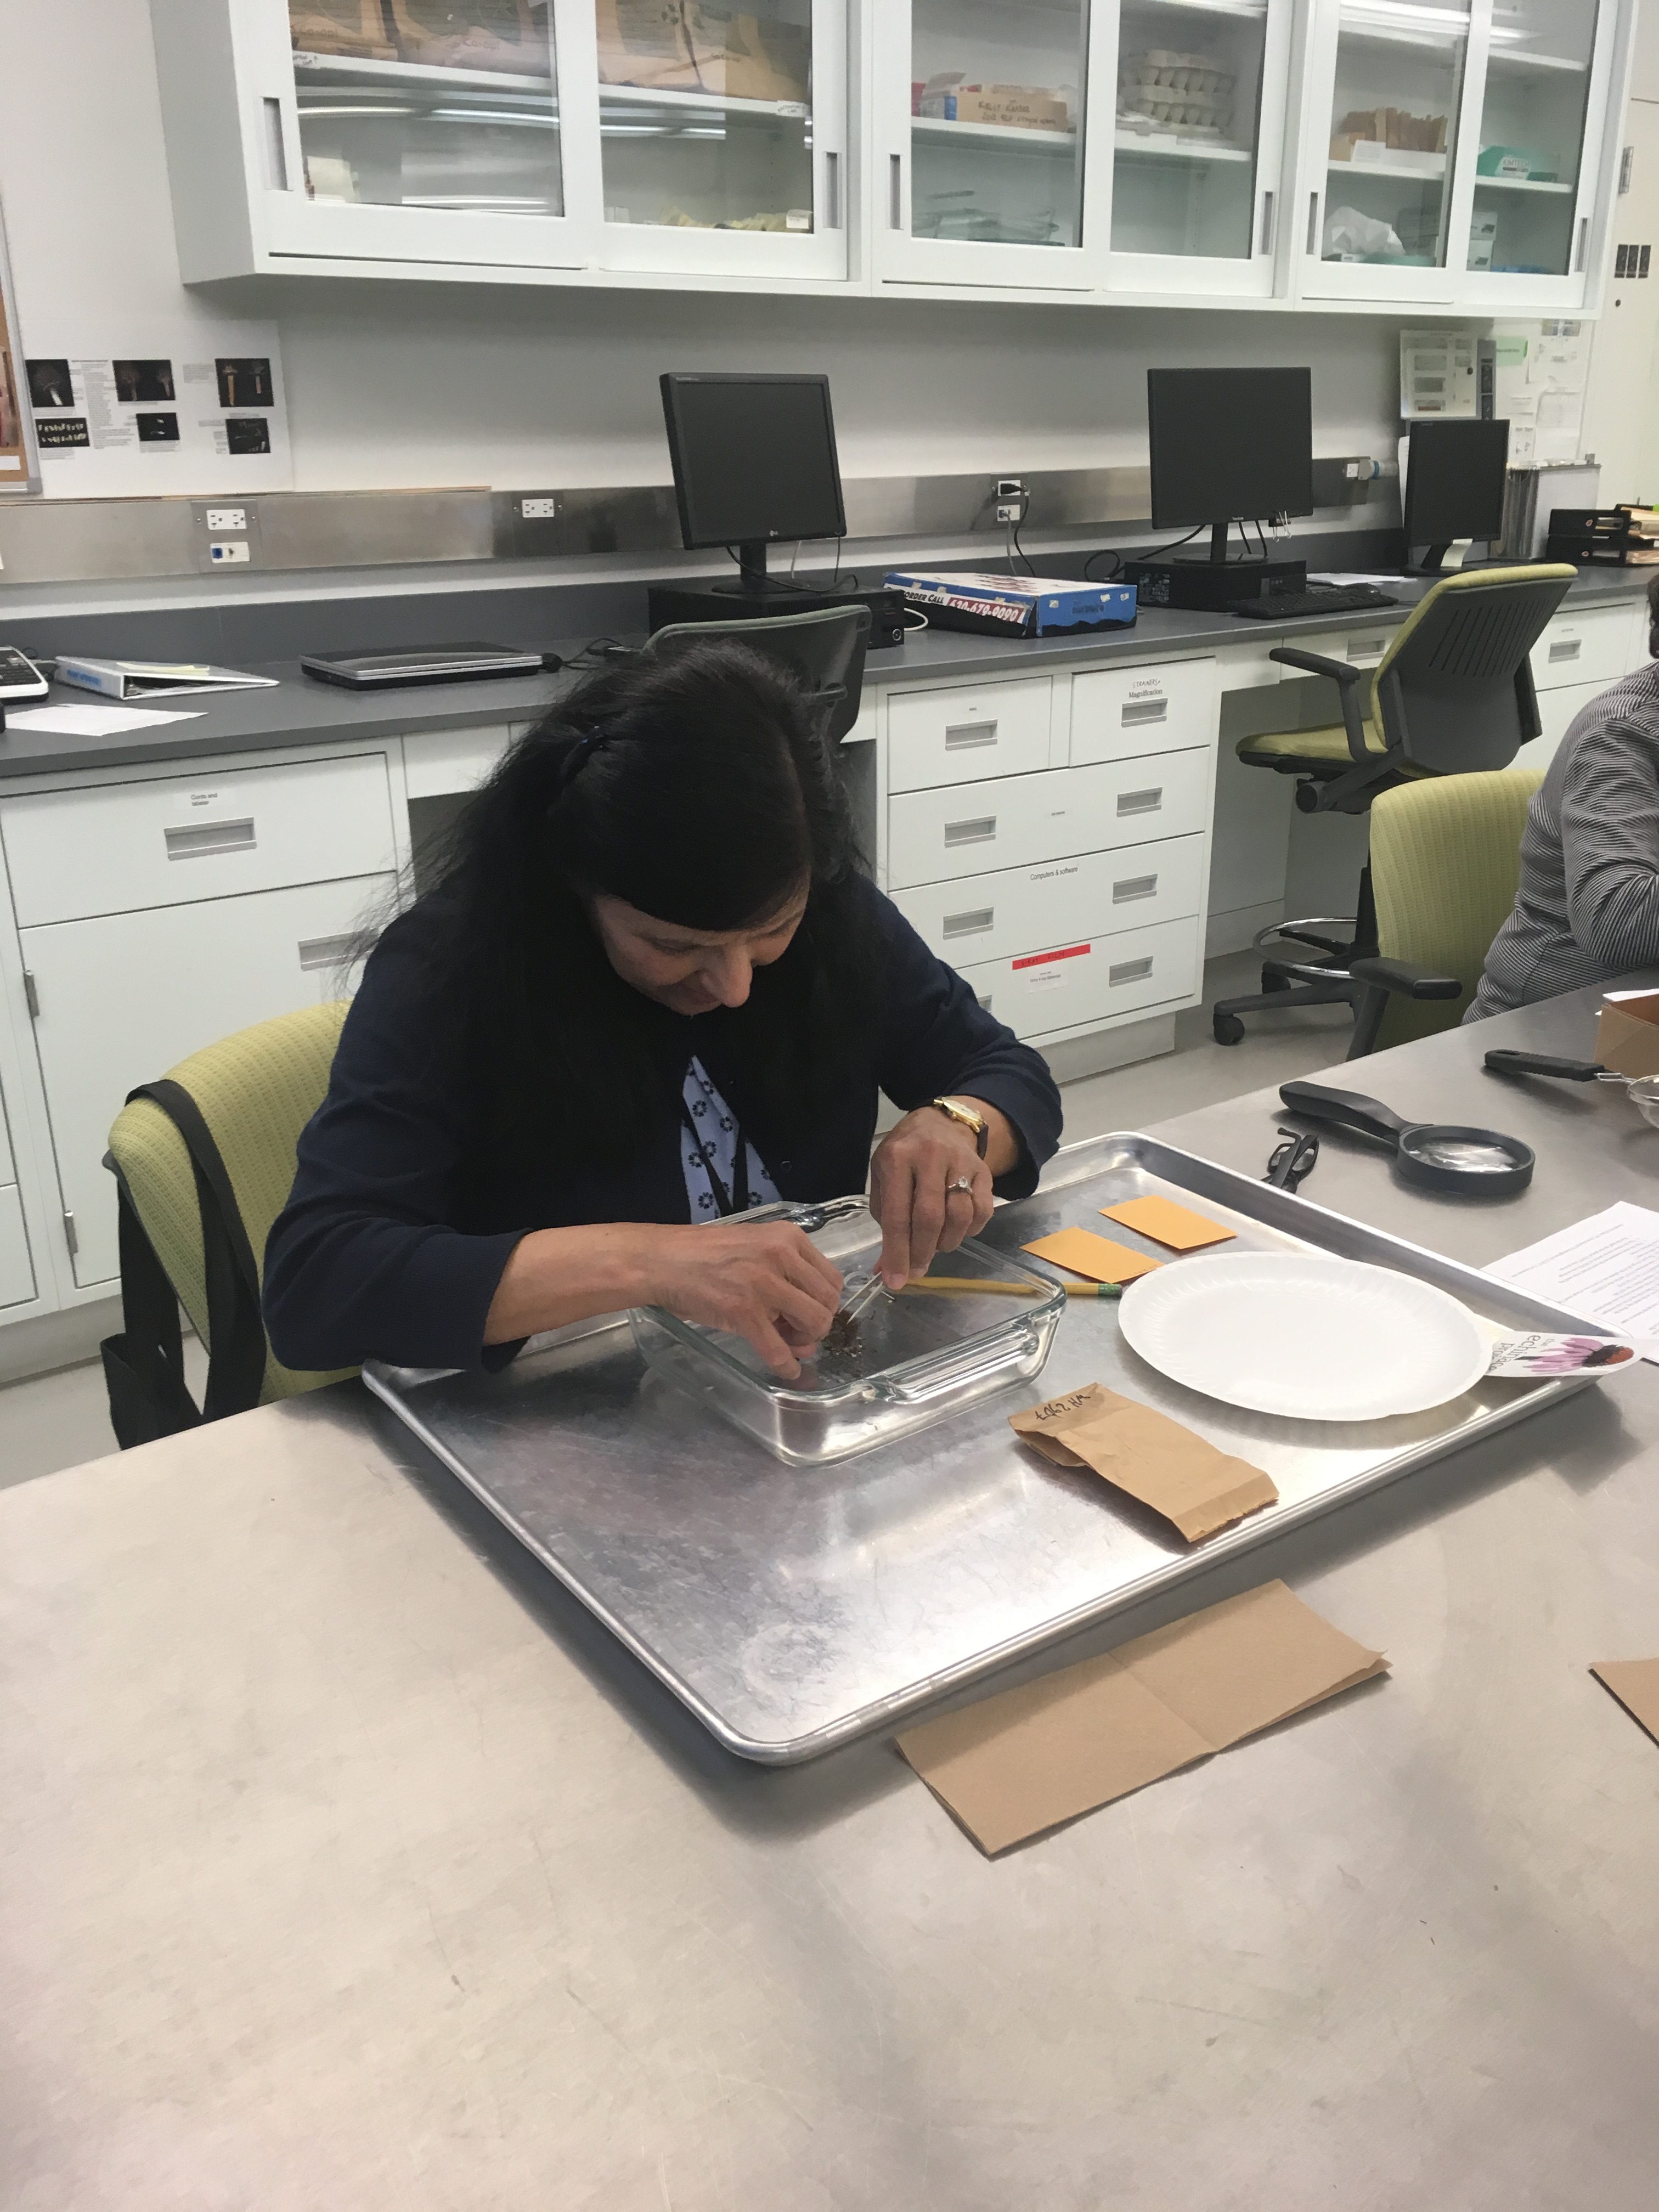
Priti has been working in the seed bank here at the Plant Conservation Science Center, but has just started working our lab today. Priti will be joining us on Fridays to clean heads — the first step to processing echinacea heads, and one of the most important.
Priti cleaning a head We’re thrilled to have Priti as part of the team!
|
|