Since 1995, the Echinacea Project has been mapping and collecting demographic information on Echinacea angustifolia to generate long-term records detailing individual fitness in prairie remnants. In summer 2023, Team Echinacea visited 42 prairie remnants to search at 2443 locations where adult Echinacea plants had been previously mapped. We call this “total demo.” At small sites, the team took records for all adult plants found at a site (no change in total demo protocol from previous years). At larger sites, we scaled down and visited a subset of adult plants. Burning led to high flowering rates and lots of newly flowering plants entering the census, which stressed our system for total demo. This year we did not visit plants that were “not present” for the past 3+ years and we also capped total demo points at 100 per site. For example, at Landfill, we searched at 100 locations at Landfill East and 100 Locations at Landfill West.
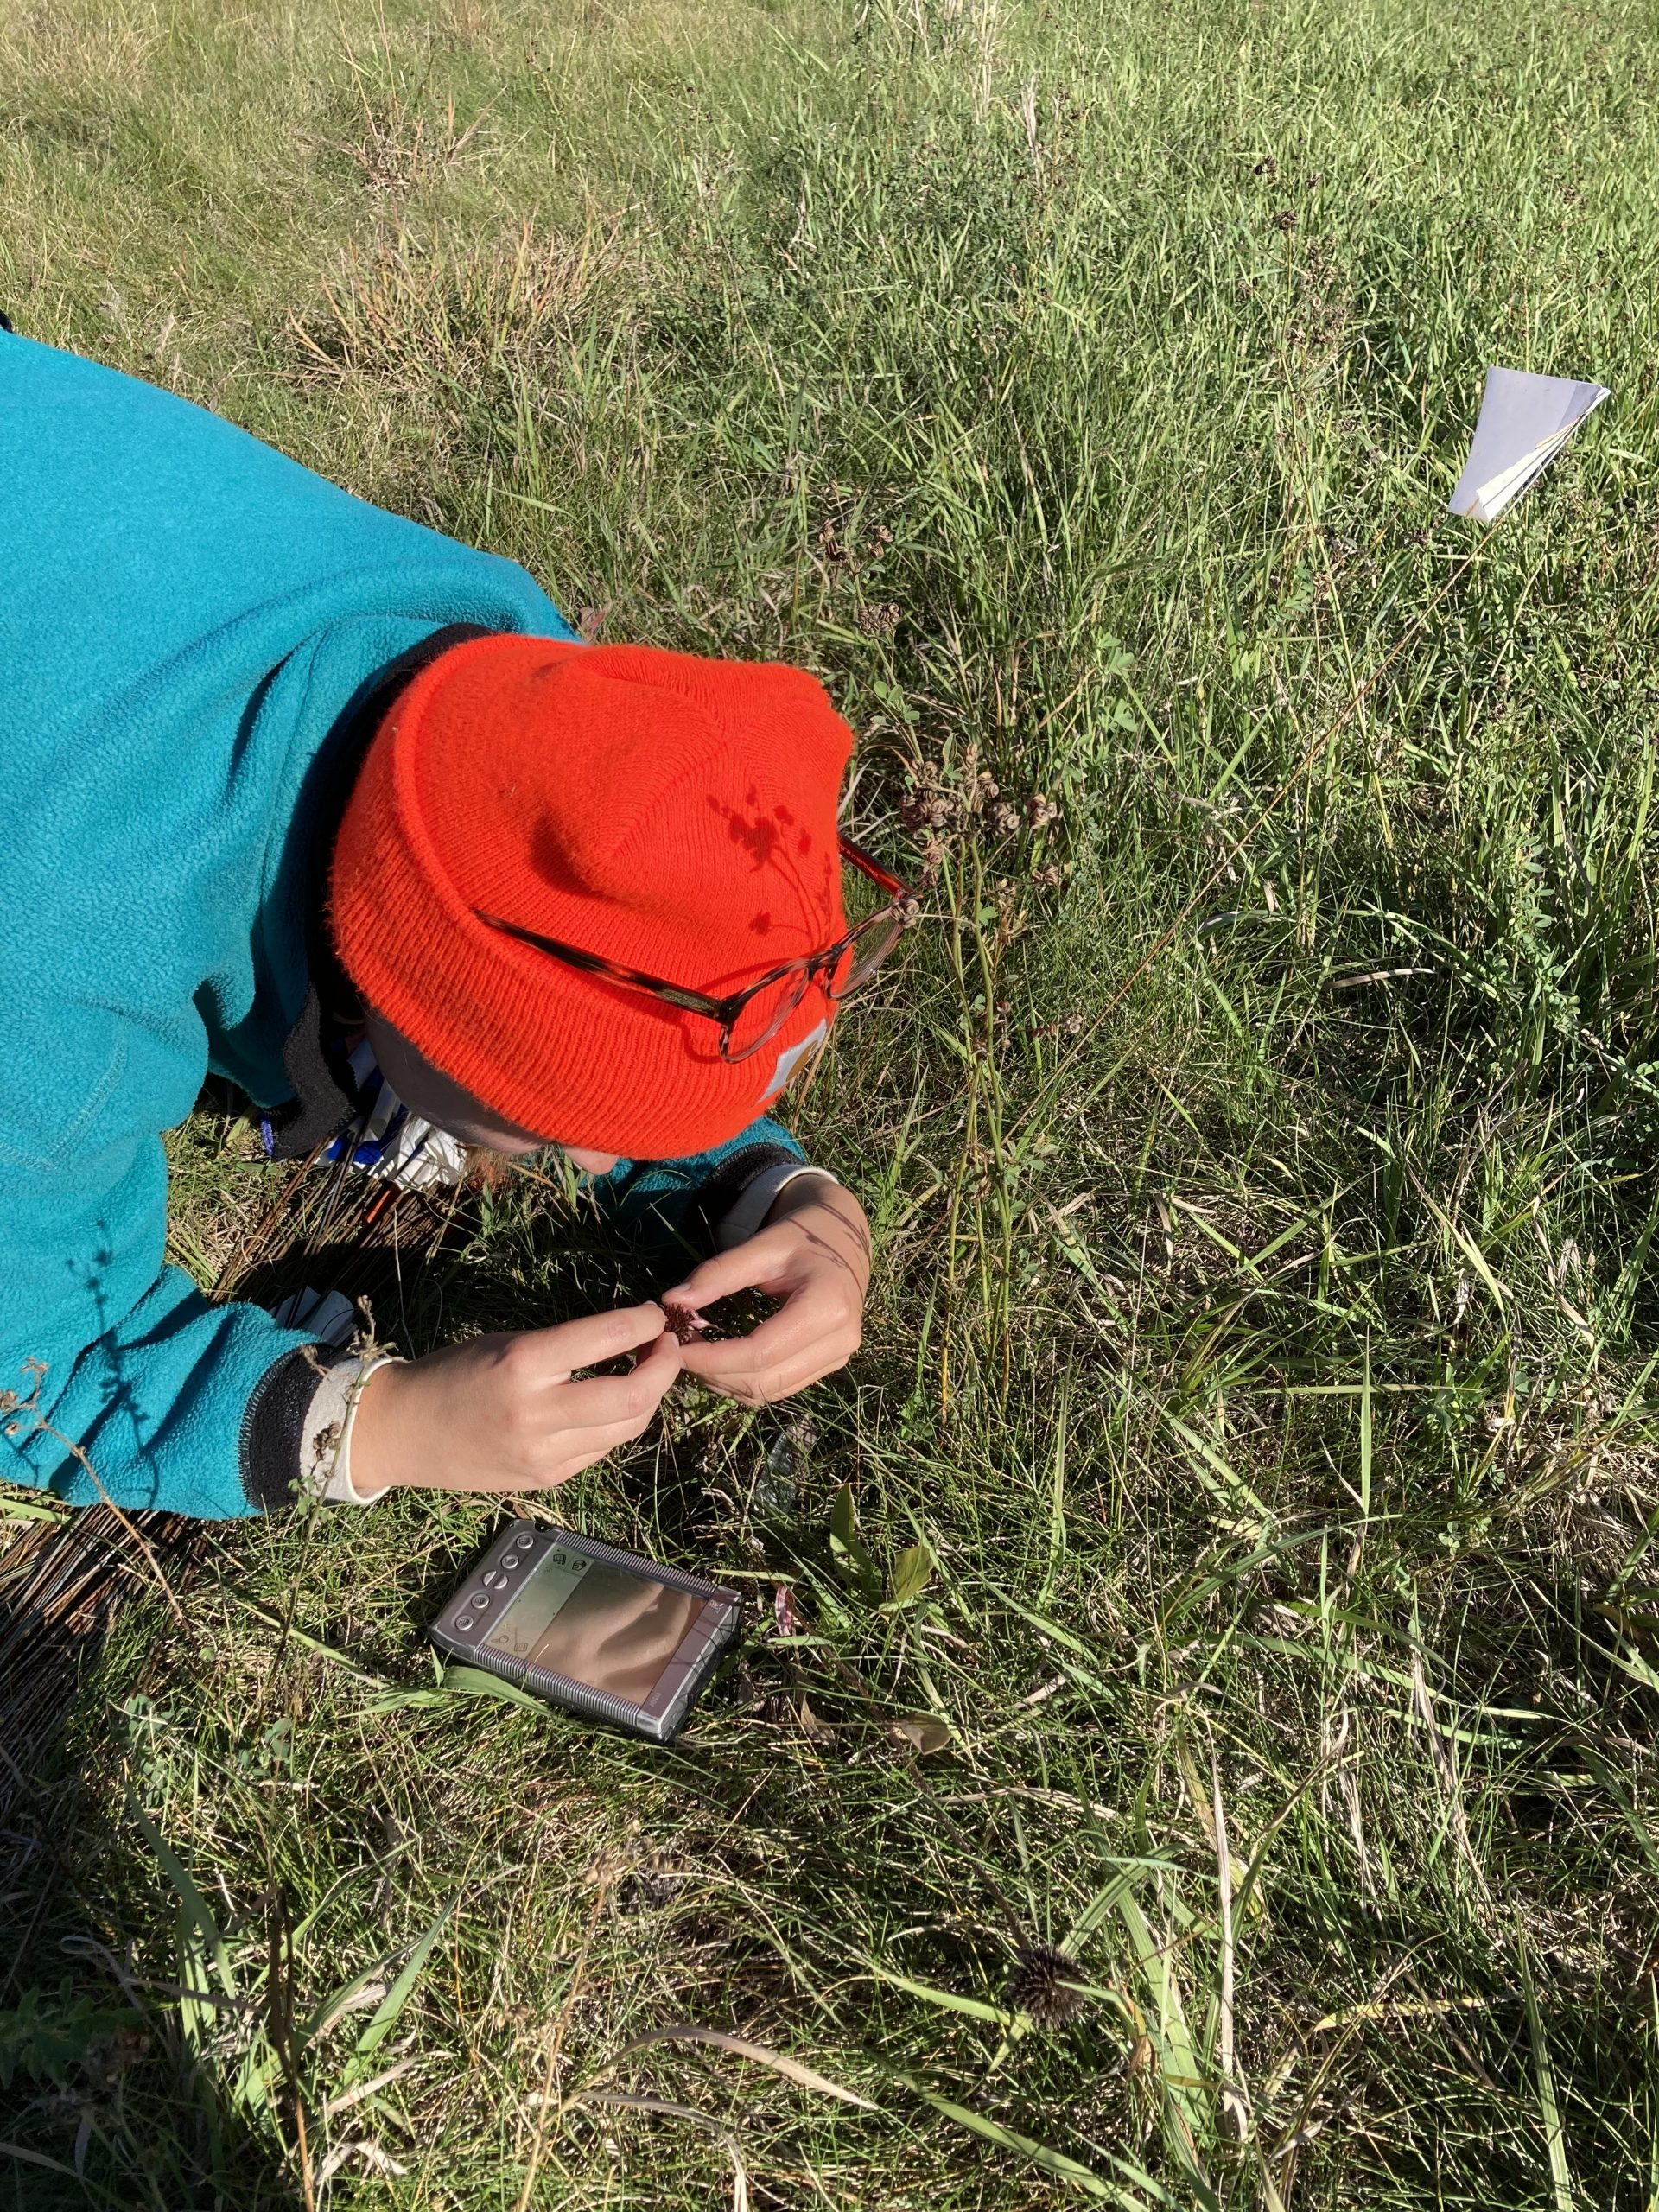
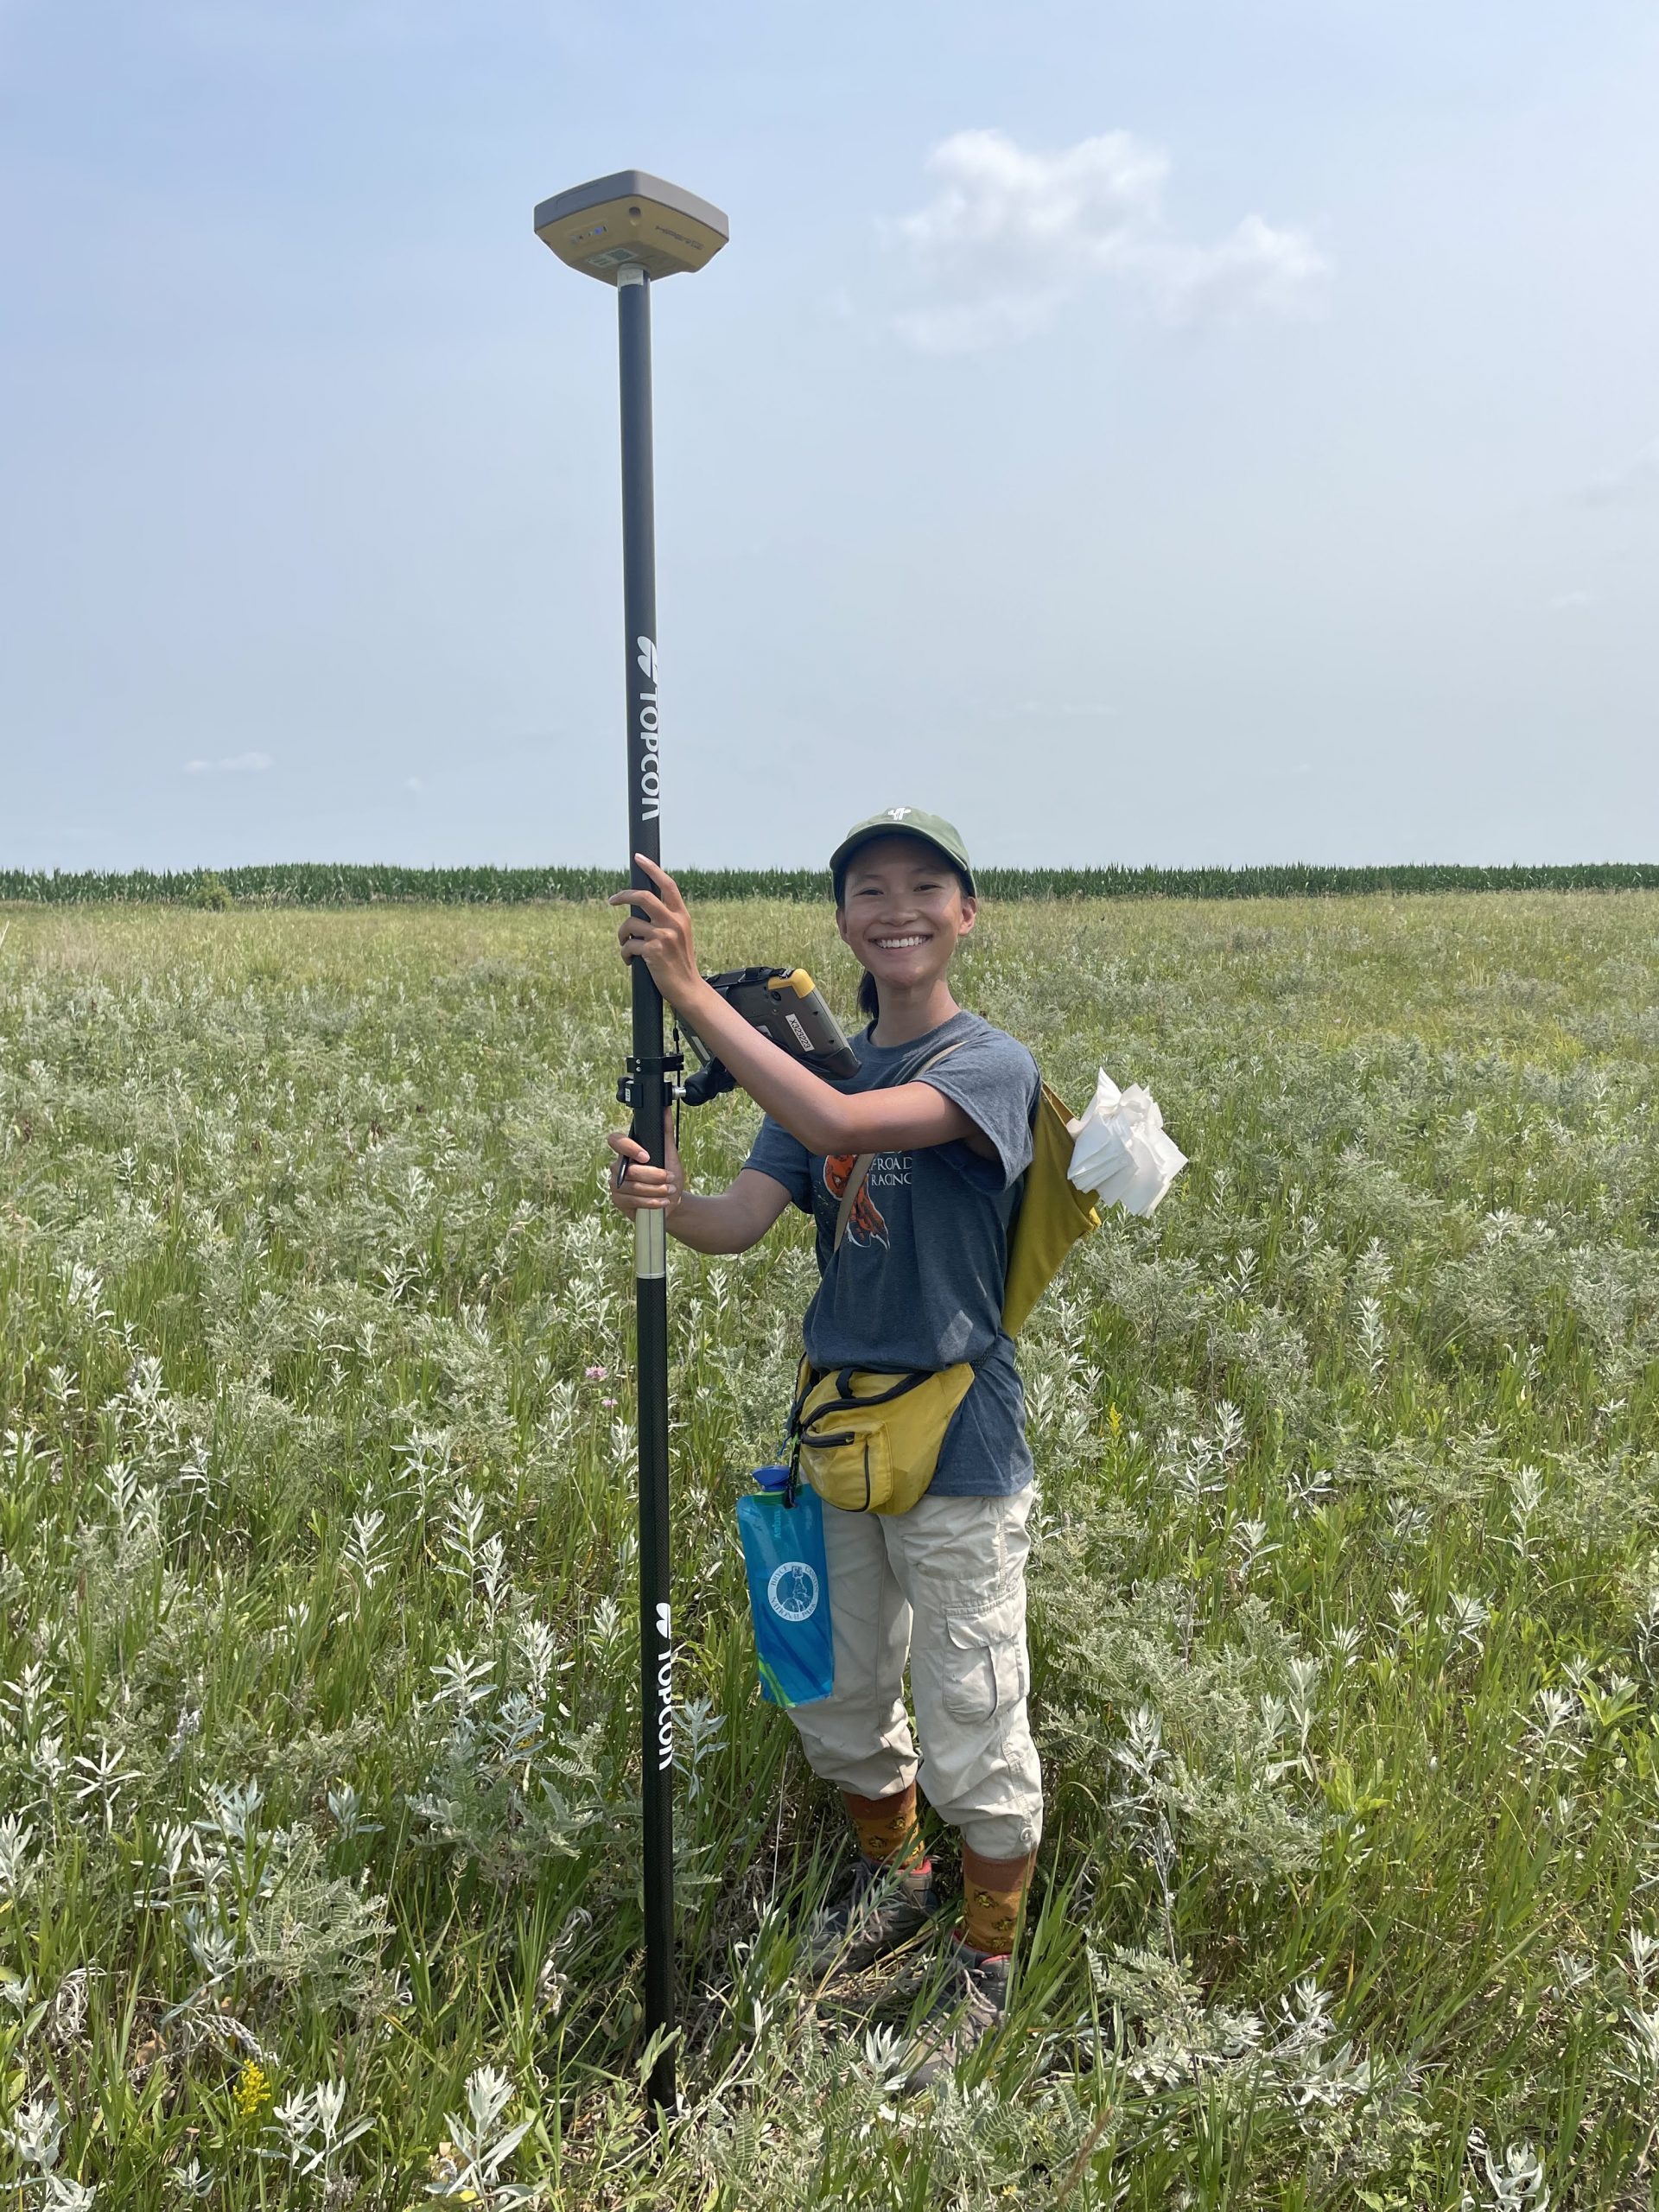
We used stake files on our high-precision GPS units to stake to each Echinacea plant in our total demo visit list, where we recorded flowering status, number of flowering heads, number of rosettes, and near neighbors of the plant on handheld data collectors (visors).
In addition to total demo, we searched and took records for all flowering plants in our remnant sites. For flowering demo, we visited 50 sites. In summer 2023, we took 5,601 demographic records in prairie remnants (demo) and 1929 GPS records (surv). We saw a much lower flowering year following 2022, with ~1586 flowering plants total. At Landfill, there were ~262 flowering plants and at Loeffler’s corner, there were 285.
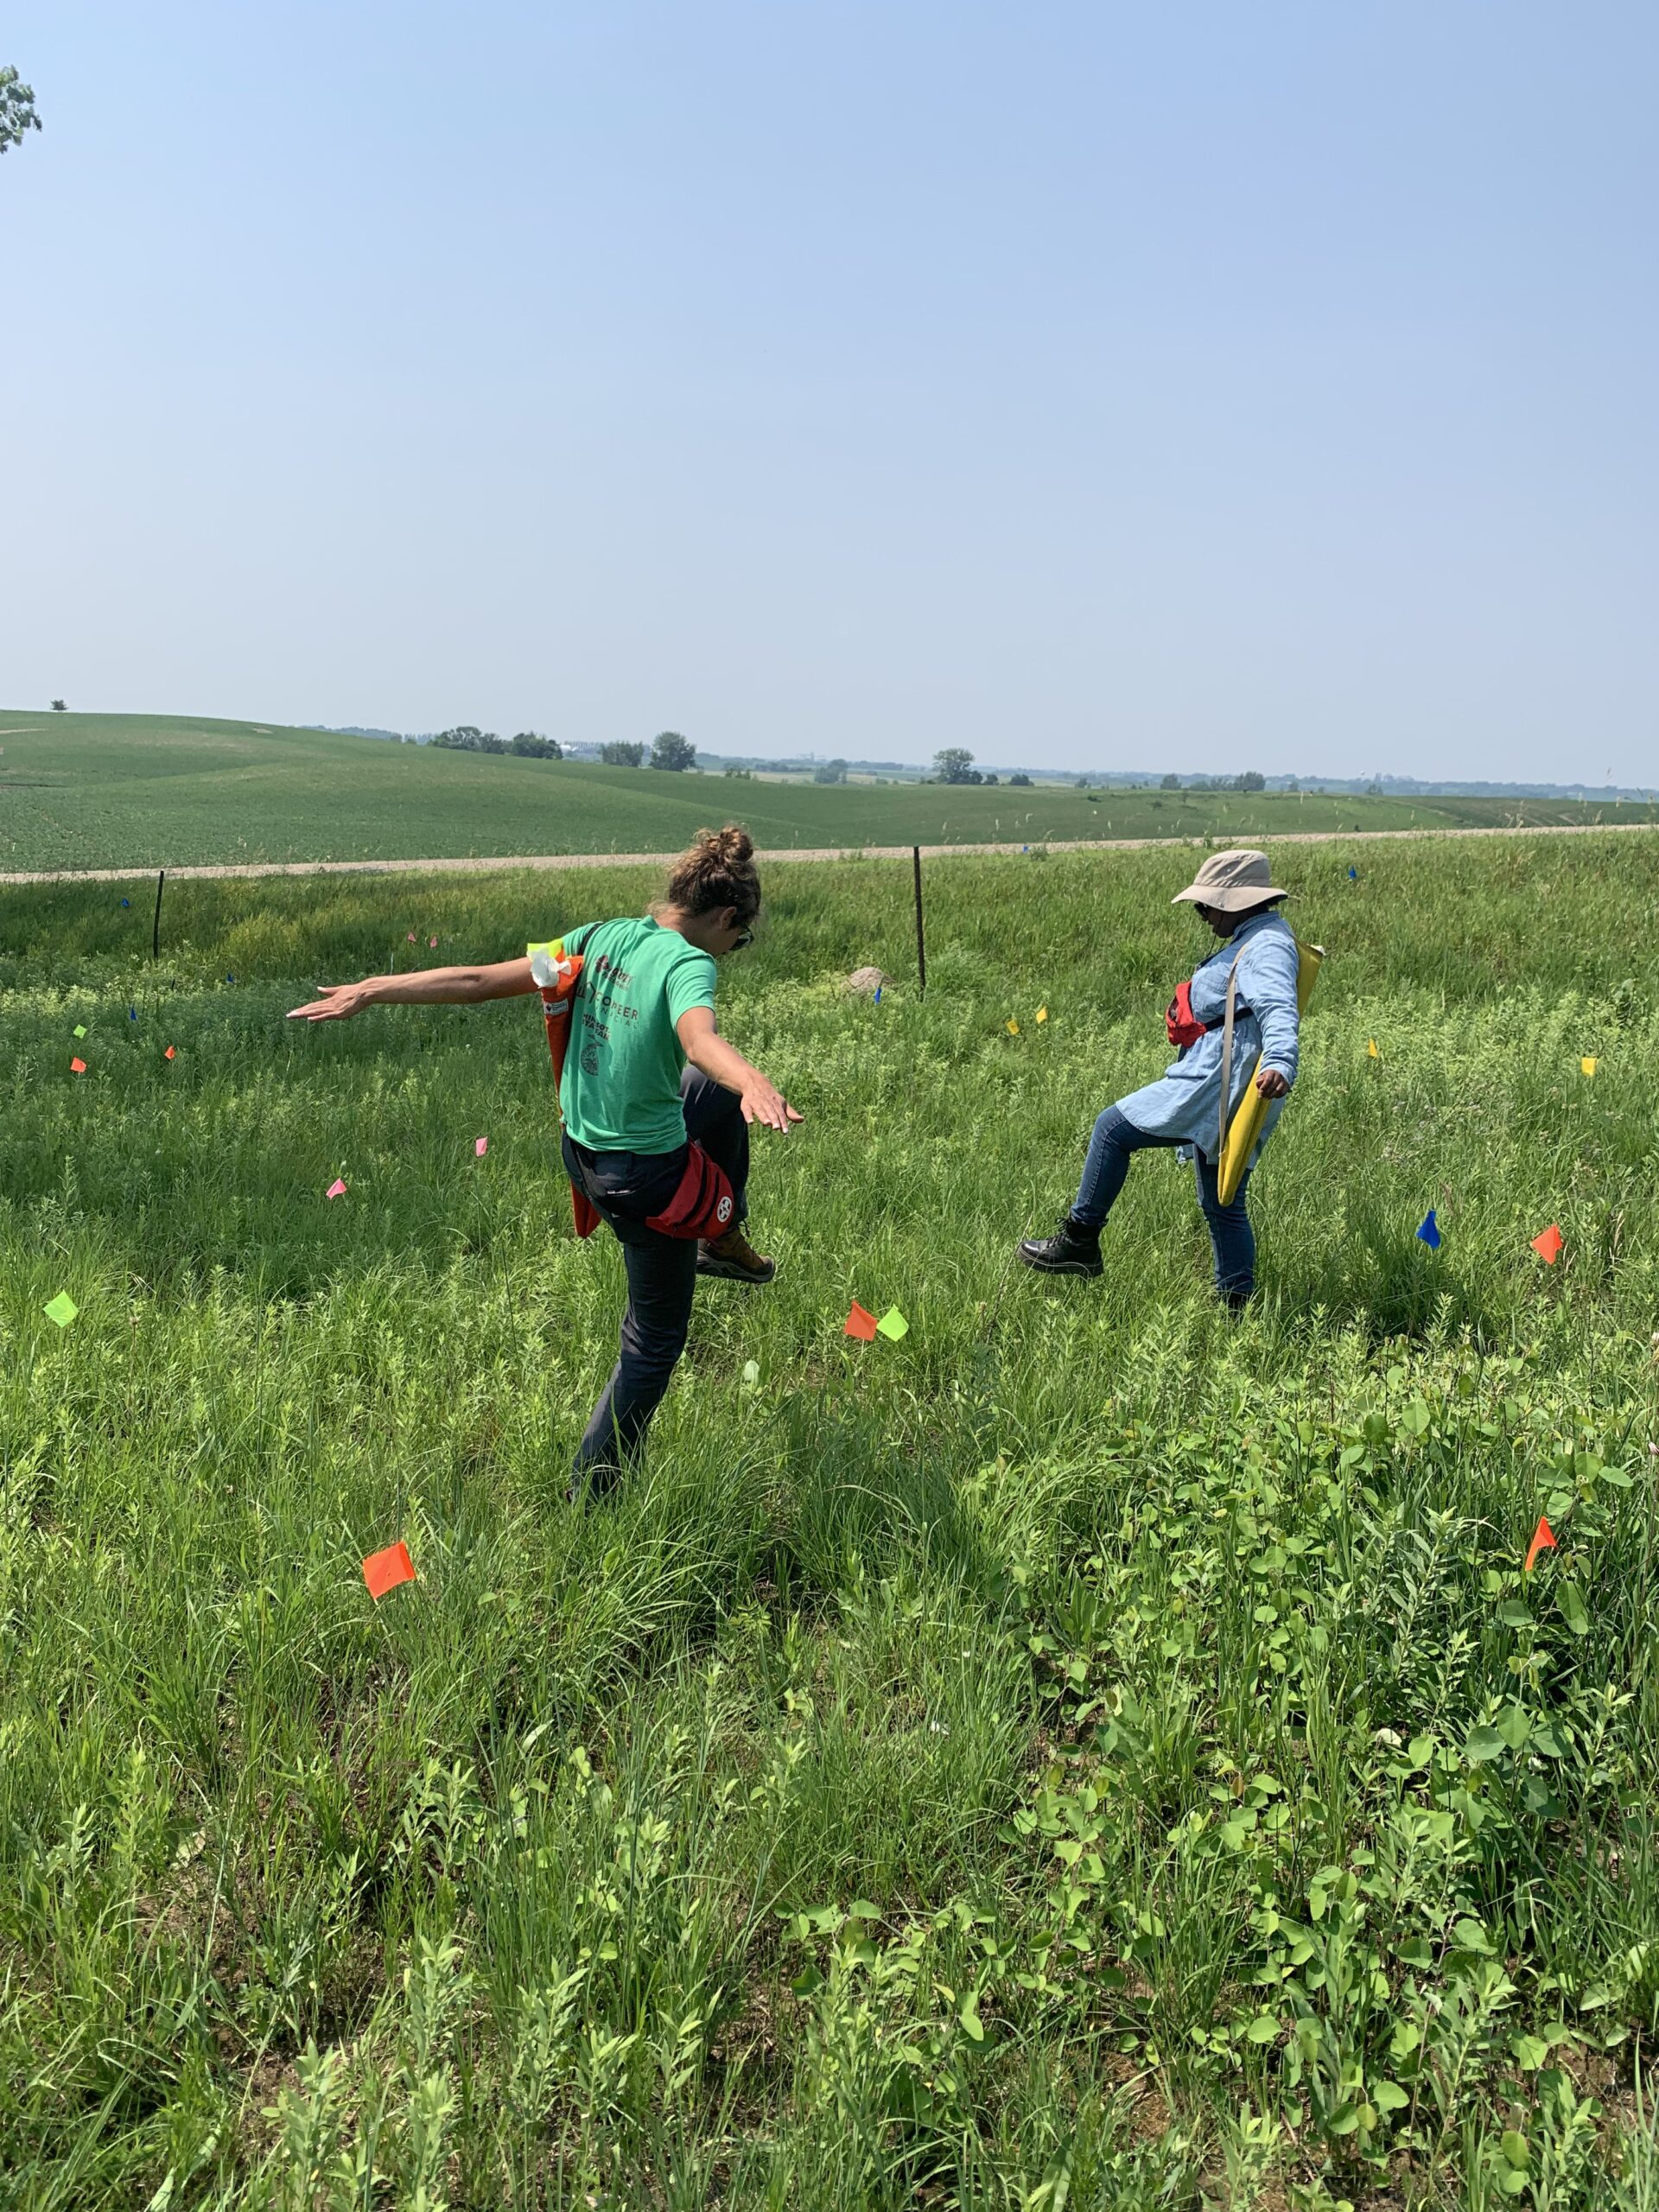
Alexa and Jak step carefully through Kjs as they search for flowering Echinacea plants. 63 plants flowered at Kjs in 2023!
We also took demo and surv data as part of our Pollen and Nectar project where we will compare characteristics of pollen and nectar in burned vs. unburned prairies. We collected demographic data at a subset of plants at several sites where we have never done demo or surv. We put out our first tags at hulze, hulzw, torges, torgen, hutche, hutchw, and koons.
This year, we put out 528 new tags which started at 28001. Two 29000 tags were accidentally created and placed in Landfill East, but those were quickly removed during our demo rechecks following completion of flowering demo and total demo.
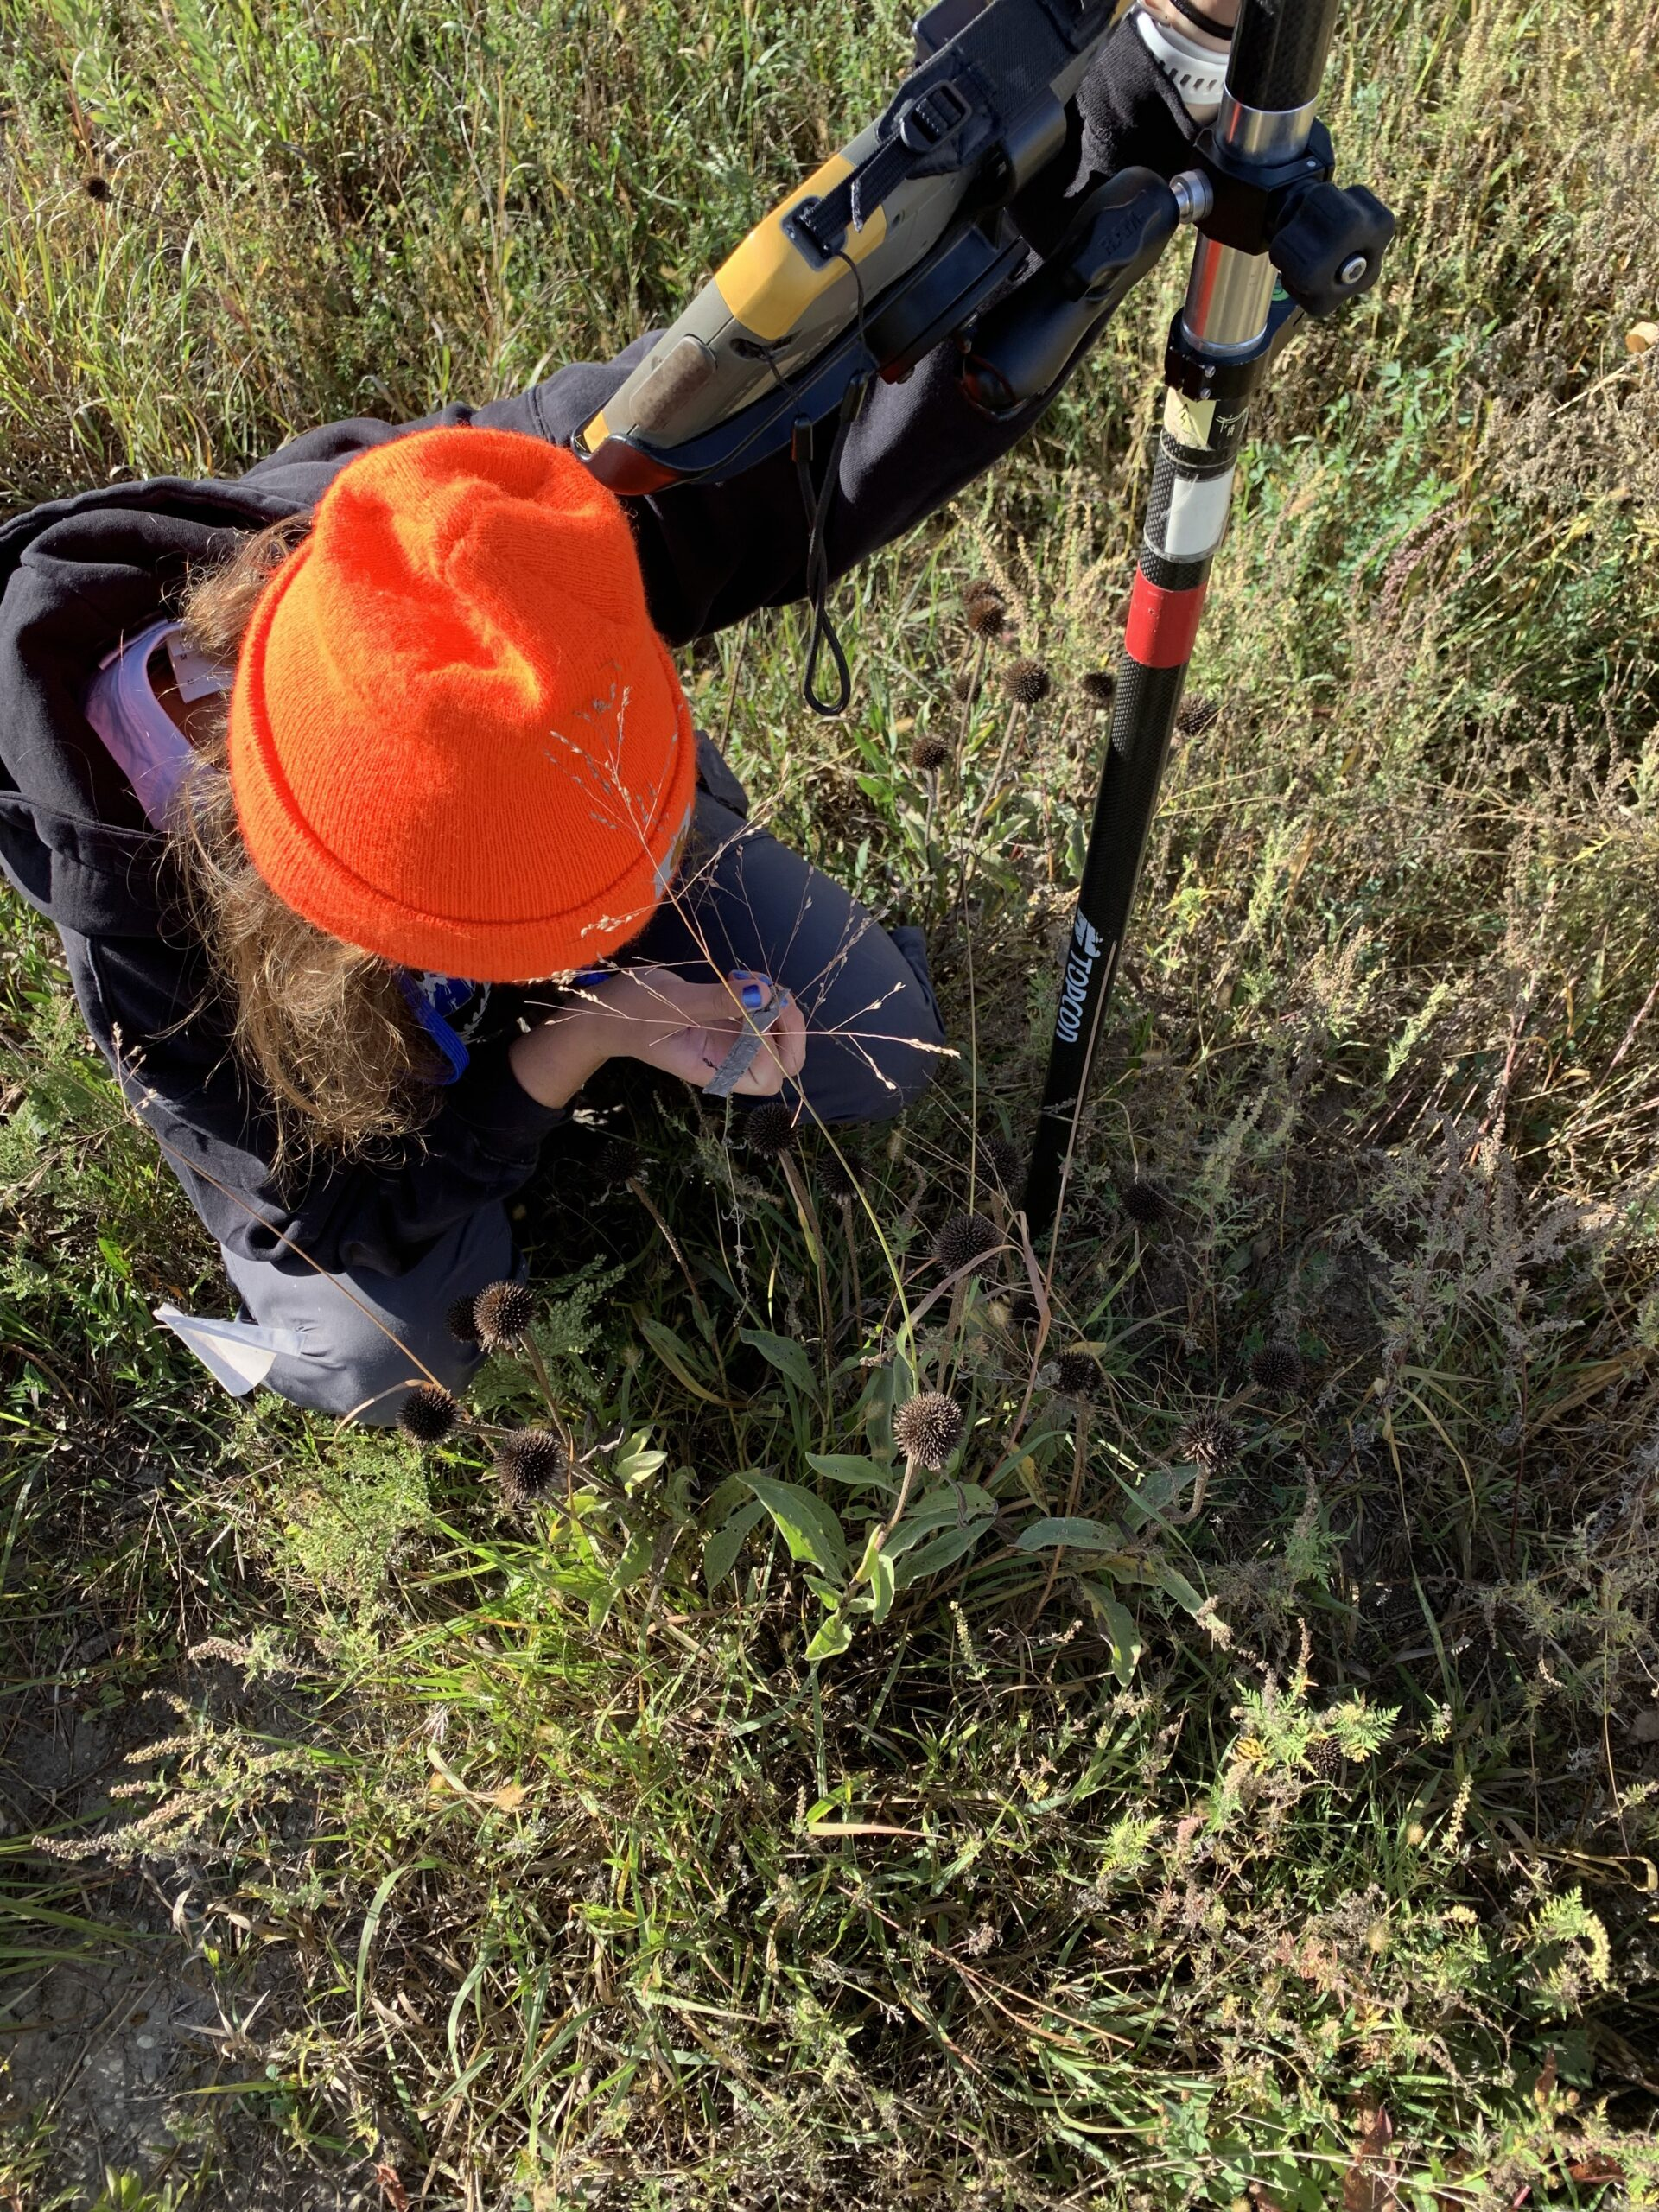
Lindsey visits an 18 headed Echinacea plant at Steven’s Approach. This plant produced the most heads of any this year.
After revisiting a final round of recheck plants during a trip to Minnesota in mid-November, we are just getting ready to move data from aiisummer2023 into demap.
Start year: 1995
Location: Remnant prairie populations of the purple coneflower, Echinacea angustifolia, in Douglas County, MN. Sites are located between roadsides and fields, in railroad margins, on private land, and in protected natural areas.
Total demo: Bill Thom’s Gate, Common Garden, Dog, East of Town Hall, Golf Course, Martinson’s Approach, Near Pallida, Nessman, North of Golf Course, South of Golf Course, Sign, Town Hall, Tower, Transplant Plot, West of Aanenson, Woody’s, Yellow Orchid Hill, plus the recruitment plots REL, RHE, RHP, RHS, RHX, RKE, RKW
Annual sample: Aanenson, Around Landfill, East Elk Lake Road, East Riley, KJ’s, Krusemarks, Loeffler’s Corner, Landfill, North of Railroad Crossing, Northwest of Landfill and North of Northwest of Landfill (lumped), On 27, Riley, Railroad Crossing, Steven’s Approach, Staffanson Prairie
Plant status (can’t find, basal, dead this year’s leaves, dead last year’s leaves, flowering), number of rosettes, nearest neighbors, and head count, if flowering
All GPS files are found here: Dropbox/geospatialDataBackup2023
All demo and surv records are stored in the aiisummer2023 repo
The most recent copies of allDemoDemo.RData and allSurv.RData can be accessed at Dropbox/demapSupplements/demapInputFiles
Samples or specimens collected: NA
Products:
Amy Dykstra’s dissertation included matrix projection modeling using demographic data
The “demap” project is a long-term dataset that combines phenological, spatial and demographic data for remnant plants
You can read more about the demographic census in the remnants, as well as links to prior flog entries about this experiment, on the background page for this experiment.
Since 1995, the Echinacea Project has been mapping and collecting demographic information on Echinacea angustifolia to generate detailed, long-term records of individual fitness in prairie remnants. In summer 2022, Team Echinacea visited 34 prairie remnants to search at 2927 locations where adult Echinacea plants had been previously mapped, a process we call “total demo.” At small sites, the team searched for all adult plants, and at large sites, we visited a subset of the adult plants. This year, we did not visit plants that had been “not present” for the past 4 years. However, we added plants that flowered for the first time in 2019, 2020, or 2021. At the large sites, we added many more plants than we removed; at Landfill, we removed 18 plants but added 129 new plants, so we visited 285 plants in total. We plan to revisit the total demo protocol before next summer so our subsets do not reach unreasonable sizes.
At each Echinacea plant, the team used handheld data collectors (visors) to record the flowering status, number of flowering heads, number of rosettes, and near neighbors of the plant. We then mapped the location of every flowering plant within each prairie remnant using a high-precision GPS unit. Unfortunately, the new GPS unit, Collins, stopped working early in the summer. Nevertheless, the team persisted with the old GPS.
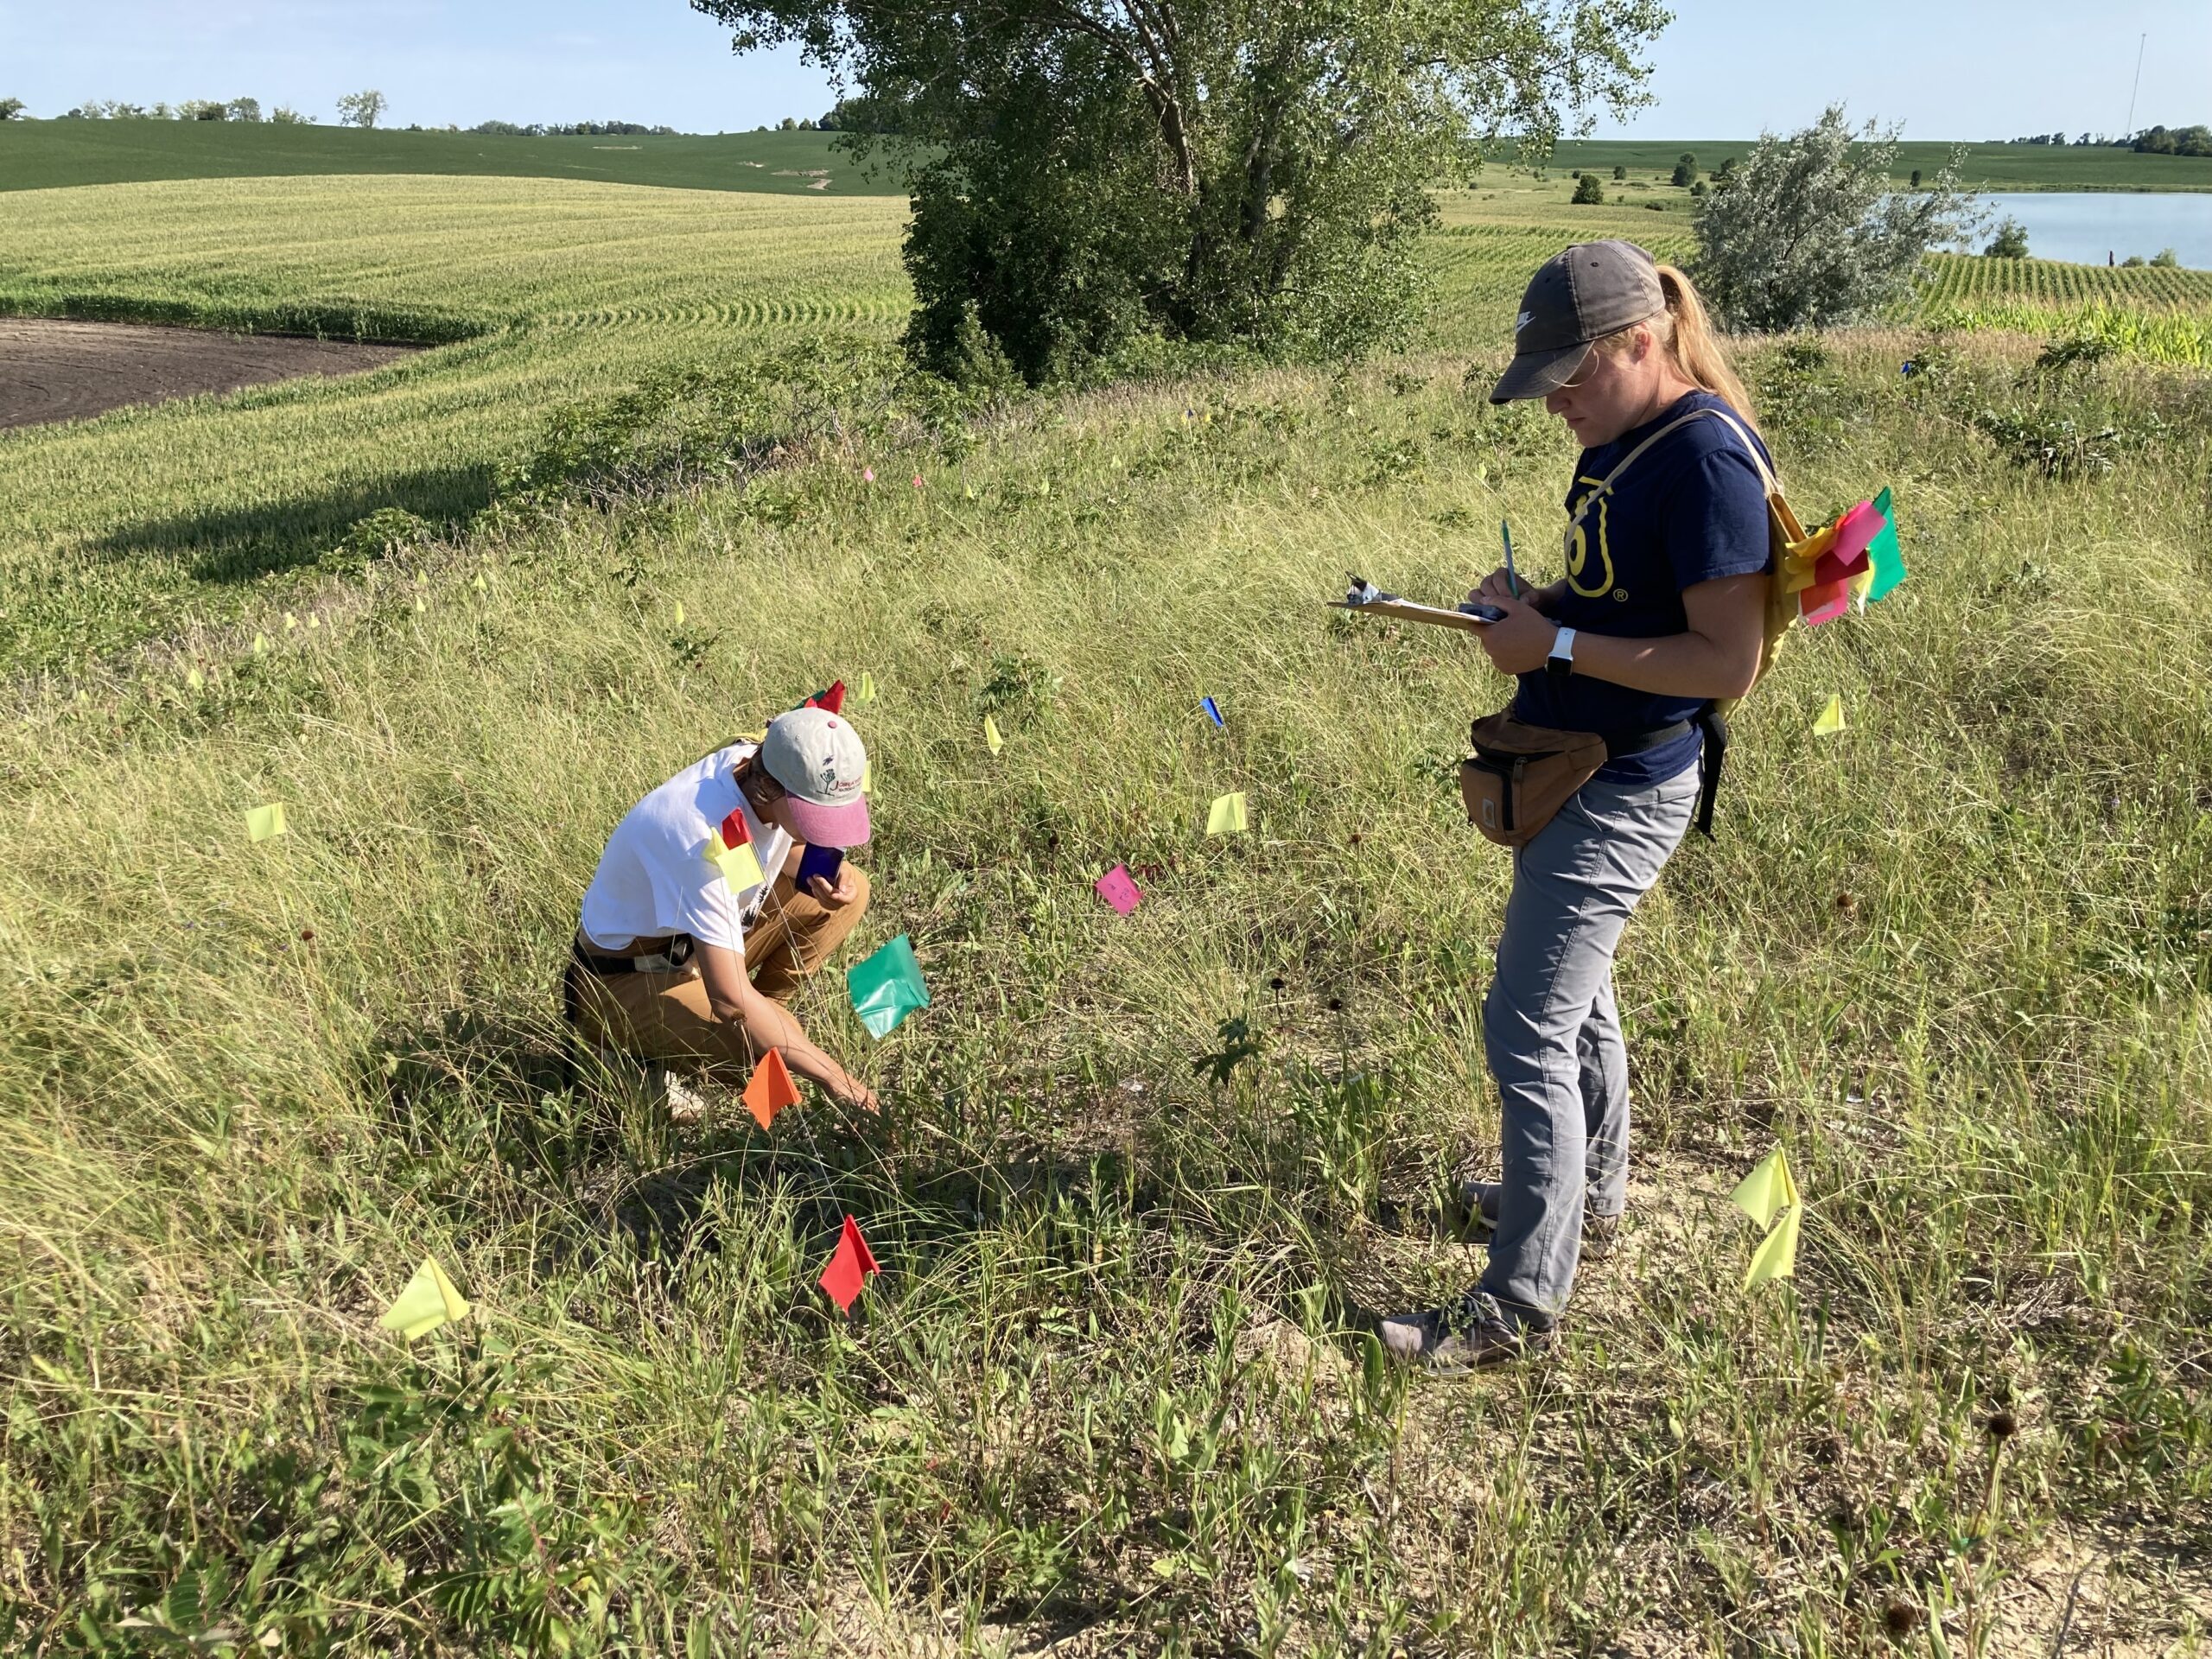
Johanna and Kennedy collect demographic data on Echinacea at On27
In summer 2022, Team Echinacea collected 7926 demographic records (demo) and recorded 3708 GPS points (surv). In total, we collected data on ~2870 flowering Echinacea angustifolia plants. A combination of favorable weather and prescribed burns made it a record-breaking year for flowering Echinacea. Landfill had 713 flowering plants this year (east: 373, west: 340) compared to only 327 last year. There were 518 flowering plants at Loeffler’s Corner (east: 292, west: 226), and 266 flowering plants at Staffanson. The demo and surv datasets are in the process of being combined with previous years’ records of flowering plants in “demap,” the spatial dataset of remnant reproductive fitness that the Echinacea Project maintains.
This year, new tags ranged from 27001 to 27999. However, due to the high number of flowering plants and issues with people adding unnecessary tags, we ran out of tag numbers in the 27000s. Therefore, we also used new tags ranging from 25651 to 25890 and from 26881 to 26999 in 2022.
We are especially interested in understanding how fire influences reproductive effort in fragmented prairies. The following sites were burned in spring 2022: Bill Thom’s Gate, Landfill West, Loeffler’s Corner West, Martinson’s Approach, Northwest of Landfill, North of Northwest Landfill, Staffanson West, and West of Aanenson. We noticed increases in flowering at most burned sites, even some of the small ones. For example, West of Aanenson had 7 flowering plants this year, which is the highest flowering rate on record since we started mapping Echinacea there in 1999. Stay tuned for more results from this intriguing dataset!
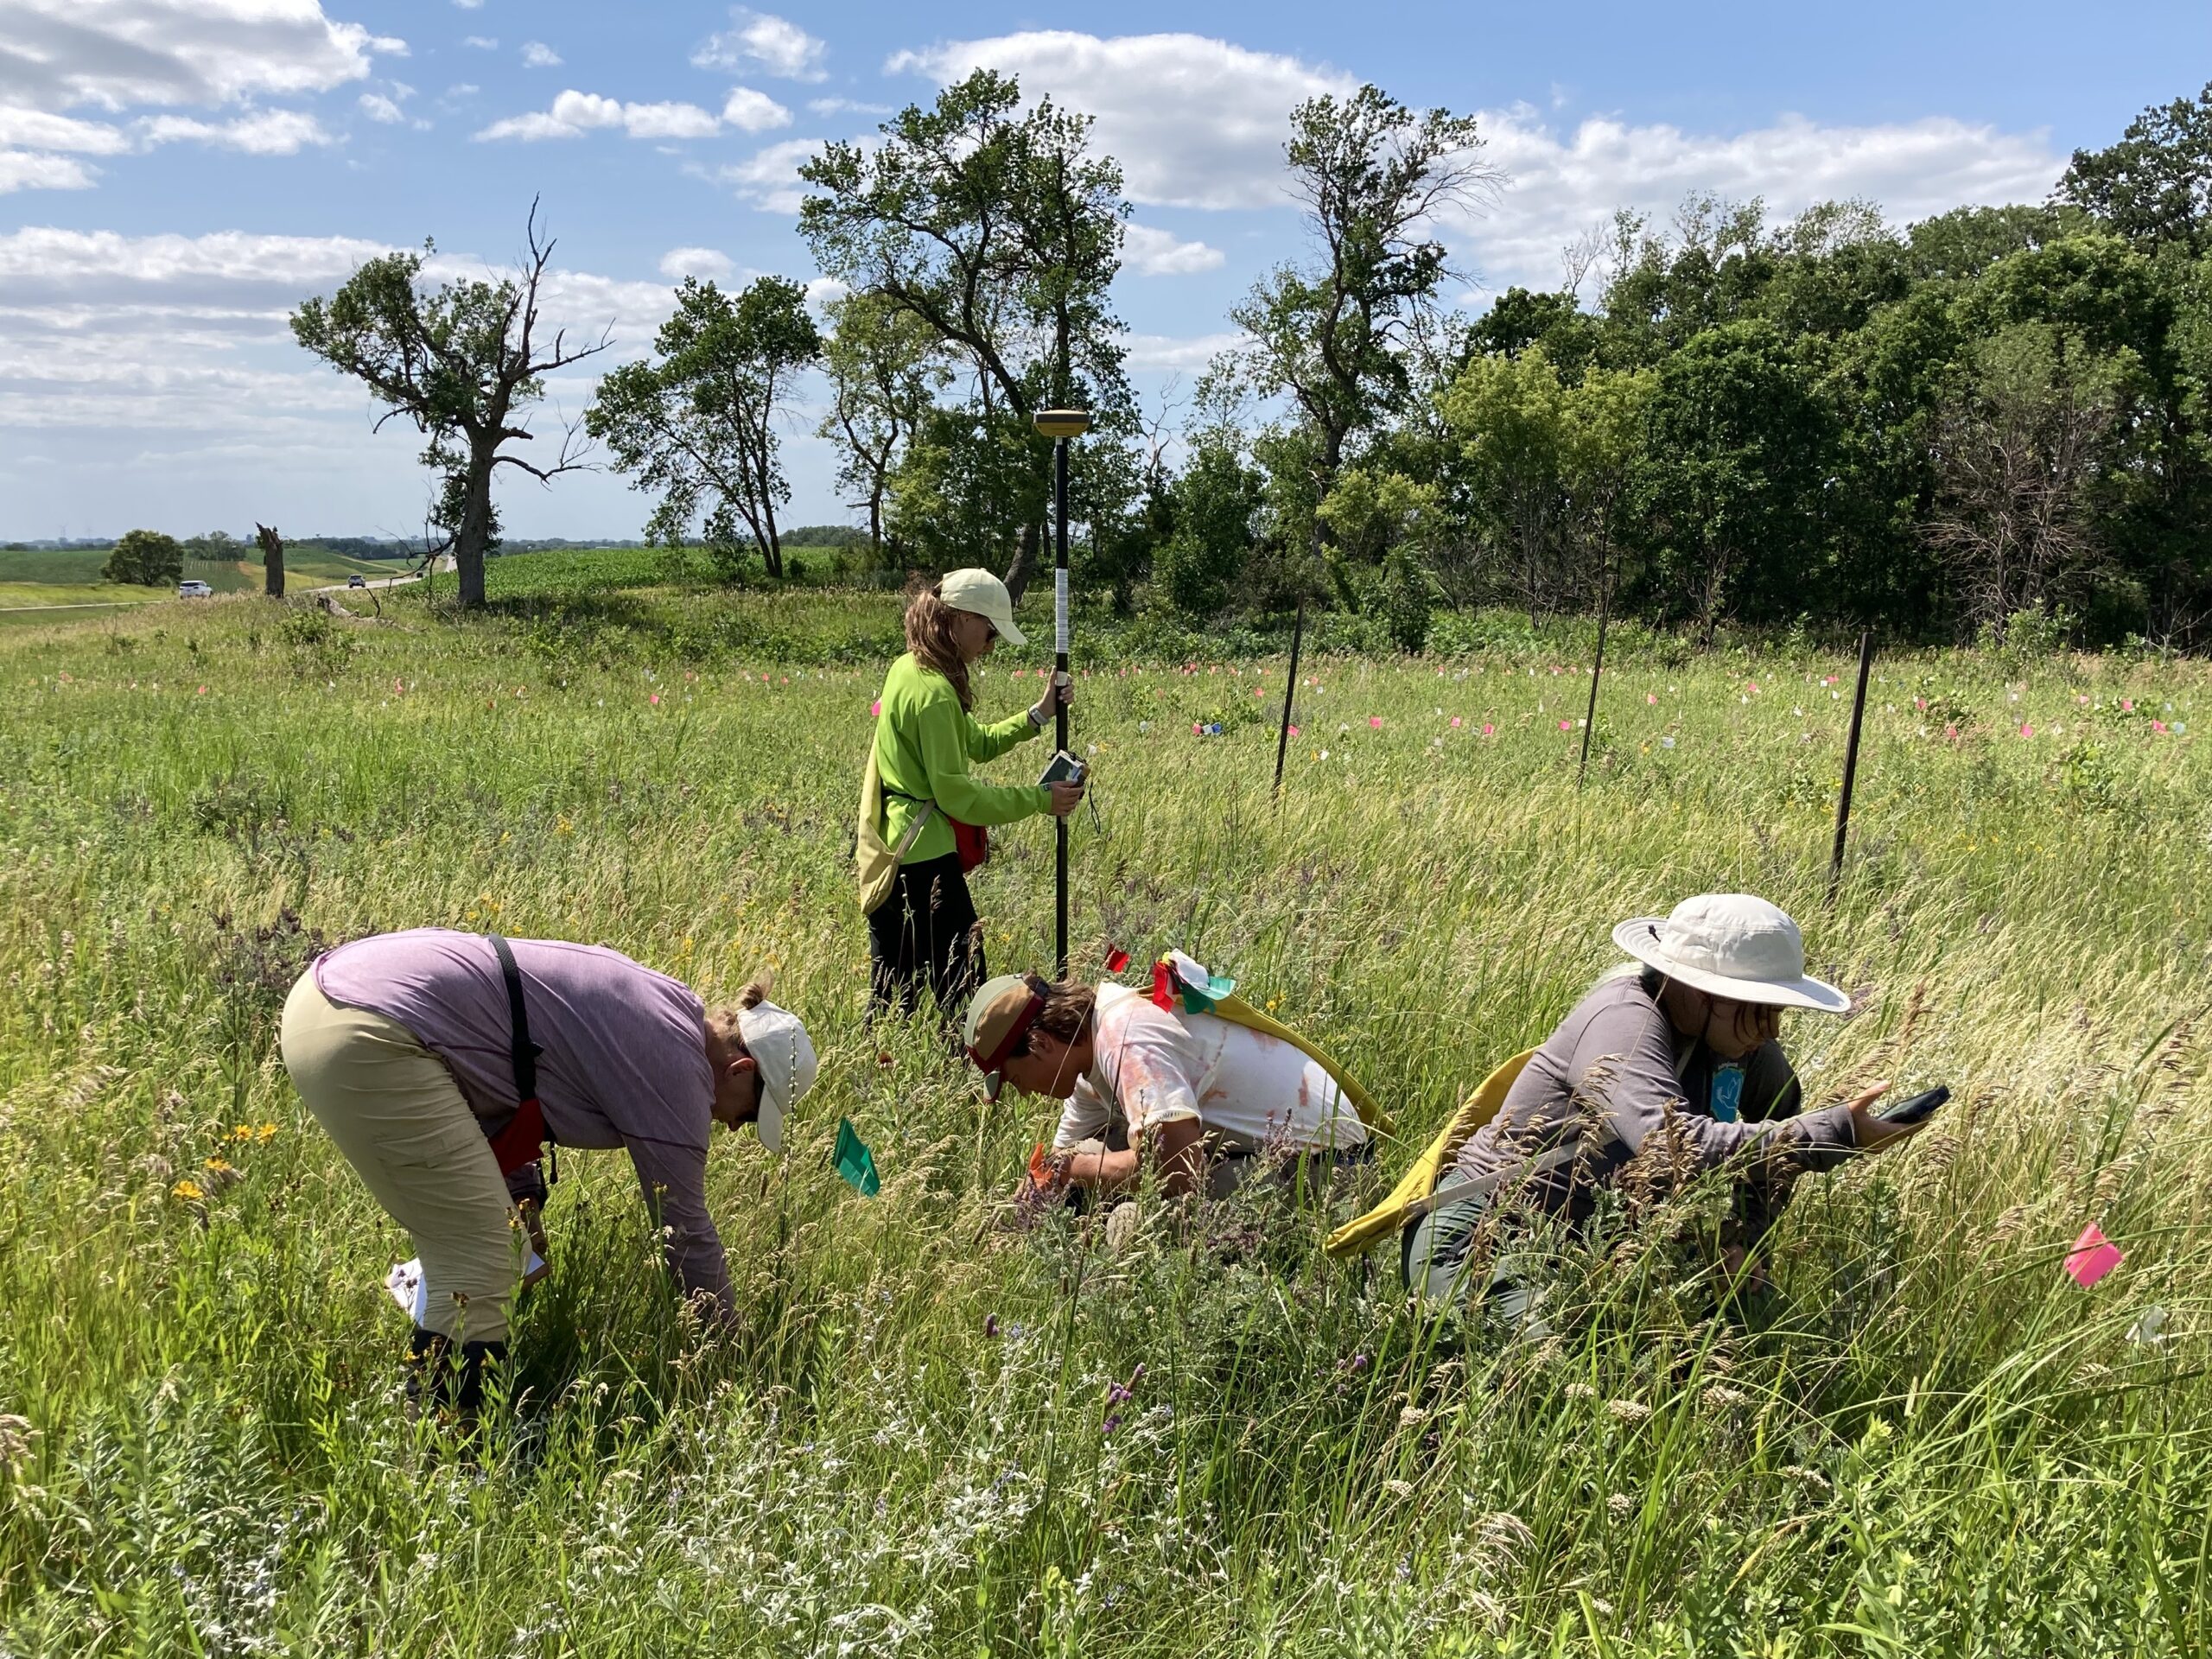
Members of Team Echinacea do total demo at the Transplant Plot
Start year: 1995
Location: Remnant prairie populations of the purple coneflower, Echinacea angustifolia, in Douglas County, MN. Sites are located between roadsides and fields, in railroad margins, on private land, and in protected natural areas.
Total demo: Bill Thom’s Gate, Common Garden, Dog, East of Town Hall, Golf Course, Martinson’s Approach, Near Pallida, Nessman, North of Golf Course, Randt, South of Golf Course, Sign, Town Hall, Tower, Transplant Plot, West of Aanenson, Woody’s, Yellow Orchid Hill, plus the recruitment plots REL, RHE, RHP, RHS, RHX, RKE, RKW
Annual sample: Aanenson, Around Landfill, East Elk Lake Road, East Riley, KJ’s, Krusemarks, Loeffler’s Corner, Landfill, North of Railroad Crossing, Northwest of Landfill and North of Northwest of Landfill (lumped), On 27, Riley, Railroad Crossing, Steven’s Approach, Staffanson Prairie
Plant status (can’t find, basal, dead this year’s leaves, dead last year’s leaves, flowering), number of rosettes, nearest neighbors, and head count, if flowering
All GPS files are found here: Dropbox/geospatialDataBackup2022
All demo and surv records are stored in the aiisummer2022 repo
The most recent copies of allDemoDemo.RData and allSurv.RData can be accessed at Dropbox/demapSupplements/demapInputFiles
Samples or specimens collected: NA
Products:
Amy Dykstra’s dissertation included matrix projection modeling using demographic data
The “demap” project is a long-term dataset that combines phenological, spatial and demographic data for remnant plants
You can read more about the demographic census in the remnants, as well as links to prior flog entries about this experiment, on the background page for this experiment.
For the remnants, I finished data reconciliation for all the plants at Staffanson Prairie Preserve (spp) through 2021 in demap, our repository for data from the remnants. Each summer, we use the GPS to record the positions of every flowering Echinaceaangustifolia plant within the transect at Staffanson, and we also revisit plants that flowered previously to check whether they are still alive, a process called total demo. This winter, I connected records between years so we can track the life of individual plants across the years.
Last week, I completed demo.out for Staffanson in 2017, 2018, 2019, 2020, and 2021. Demo.out makes one record for each plant that we visited each year and records whether it was living or dead, whether it flowered, and how many heads it had. This is the dataset that we can use to do longitudinal data analysis and study the demography of Echinacea plants over time. In 2020, both sides of Staffanson burned, and it had the highest flowering rate in the past 5 years – 275 plants! Of those plants, 33 flowered for the first time. In 2021, there was just one new flowering plant.
Since 1995, the Echinacea Project has been mapping and collecting demographic information on Echinacea angustifolia to generate detailed, long-term records of individual fitness in prairie remnants. In summer 2021, Team Echinacea visited 34 prairie remnants to search at 2899 locations where adult Echinacea plants had been previously mapped. At small sites, the team searched for all adult plants, and at large sites, they visited a subset of the adult plants.
At each Echinacea plant, the team used handheld data collectors (visors) to record the flowering status, number of flowering heads, number of rosettes, and near neighbors of the plant. They then mapped the location of every flowering plant within each prairie remnant using a high-precision GPS unit. This year, the Echinacea Project purchased a second GPS unit, named Collins, to facilitate faster mapping.
In summer 2021, Team Echinacea took 4768 demographic records (demo) and shot 1788 GPS points (surv). In total, they recorded data on 1662 flowering Echinacea angustifolia plants, after removing duplicate records. Landfill had the most flowering plants (327), followed by Loeffler’s Corner (272) and Aanenson (146). The demo and surv datasets are in the process of being combined with previous years’ records of flowering plants in “demap,” the spatial dataset of remnant reproductive fitness that the Echinacea Project maintains.
The following sites were burned in fall 2020 and spring 2021: Dog, East Riley, KJ’s, Landfill East, Loeffler’s Corner East, Steven’s Approach (east and west), and Yellow Orchid Hill (east and west). In 2021, Team Echinacea did not do total demo at Railroad Crossing Douglas County (rrxdc). To avoid confusion at Hegg Lake WPA, a site which also contains recruitment plots RHE, RHP, RHS, and RHX, site “hegg” (Hegg Lake) was renamed “nrpal” (Near Pallida) in the demo and surv datasets.
Over the course of the summer, Team Echinacea spent a total of 25,245 minutes (421 person-hours) on demo and surv. This includes flowering demo (131 person-hours), flowering surv (72 person-hours), total demo (161 person-hours), and demo/surv rechecks (57 person-hours).
Mia scrutinizes a flowering Echinacea
Allie shoots a GPS point
Start year: 1995
Location: Remnant prairie populations of the purple coneflower, Echinacea angustifolia, in Douglas County, MN. Sites are located between roadsides and fields, in railroad margins, on private land, and in protected natural areas.
Total demo: Bill Thom’s Gate, Common Garden, Dog, East of Town Hall, Golf Course, Martinson’s Approach, Near Pallida, Nessman, North of Golf Course, REL, RHE, RHP, RHS, RHX, RKE, RKW, Randt, South of Golf Course, Sign, Town Hall, Tower, Transplant Plot, West of Aanenson, Woody’s, Yellow Orchid Hill
Annual sample: Aanenson, Around Landfill, East Elk Lake Road, East Riley, KJ’s, Krusemarks, Loeffler’s Corner, Landfill, North of Railroad Crossing, Northwest of Landfill and North of Northwest of Landfill (lumped), On 27, Riley, Railroad Crossing, Steven’s Approach, Staffanson Prairie
Plant status (can’t find, basal, dead this year’s leaves, dead last year’s leaves, flowering), number of rosettes, nearest neighbors, and head count, if flowering
All GPS files are found here: Dropbox/geospatialDataBackup2021
All demo and surv records are stored in the aiisummer2021 repo
The most recent copies of allDemoDemo.RData and allSurv.RData can be accessed at Dropbox/demapSupplements/demapInputFiles
Samples or specimens collected: NA
Products:
Amy Dykstra’s dissertation included matrix projection modeling using demographic data
The “demap” project is a long-term dataset that combines phenological, spatial and demographic data for remnant plants
You can read more about the demographic census in the remnants, as well as links to prior flog entries about this experiment, on the background page for this experiment.
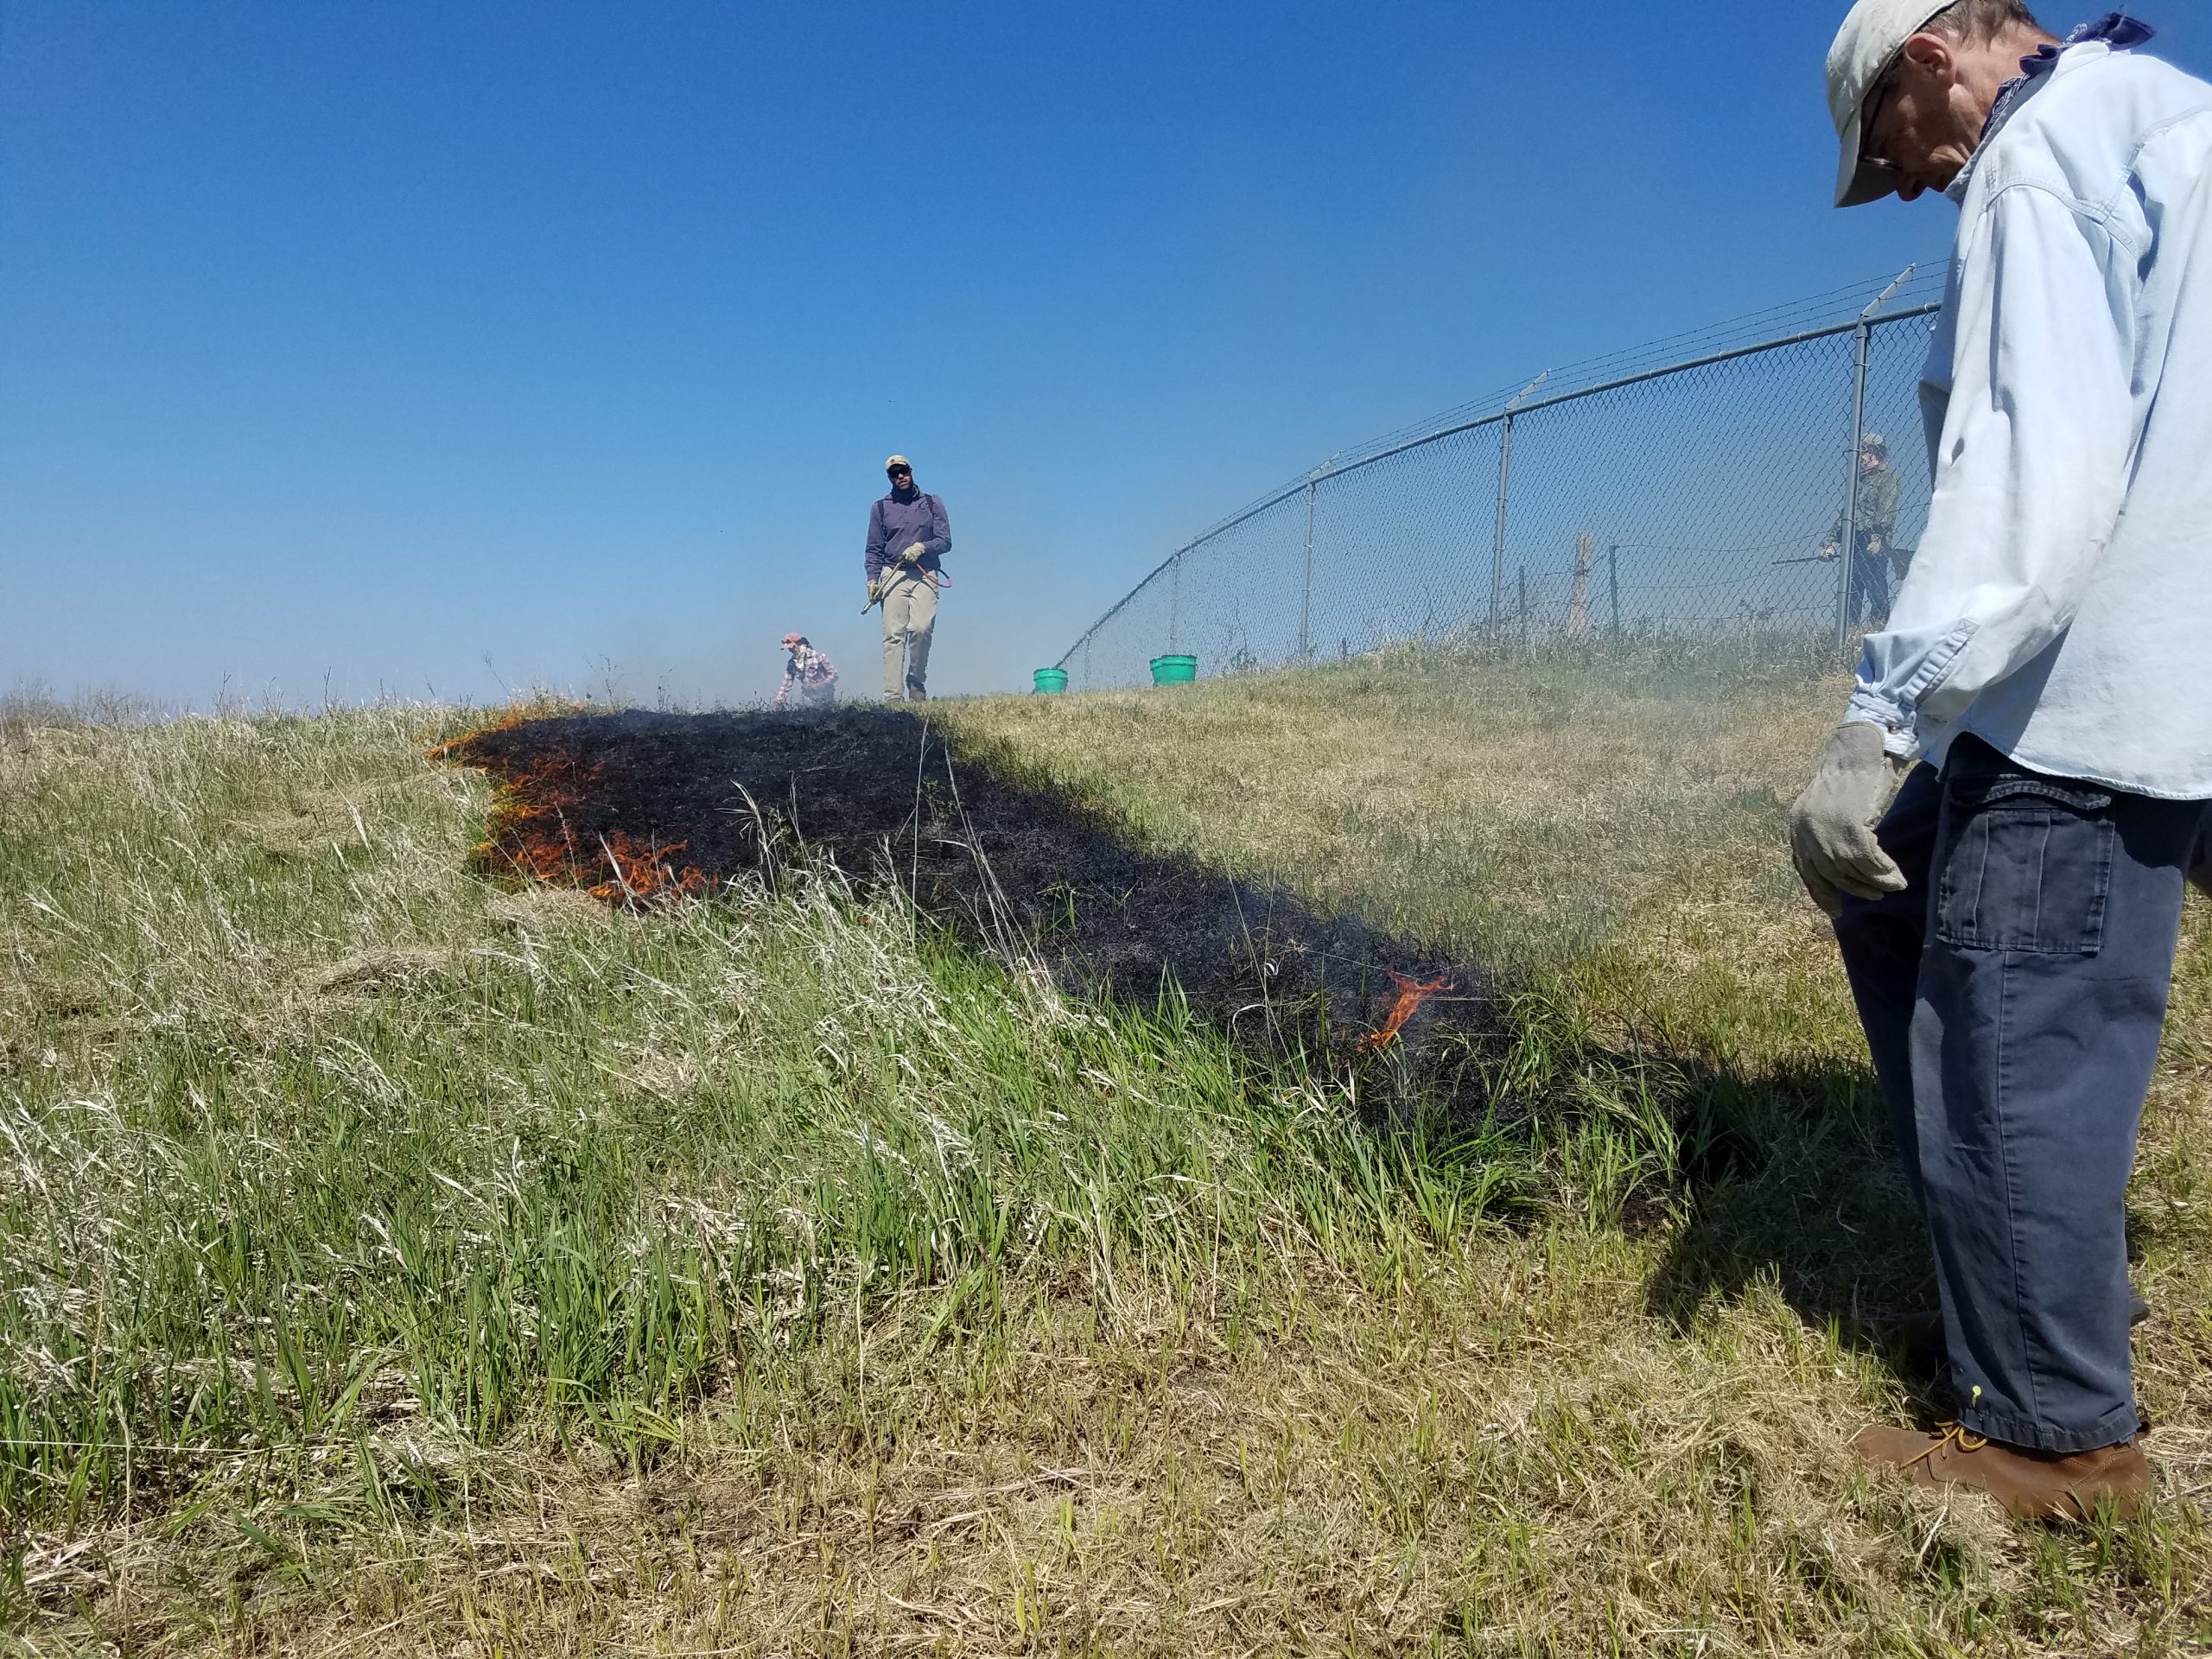
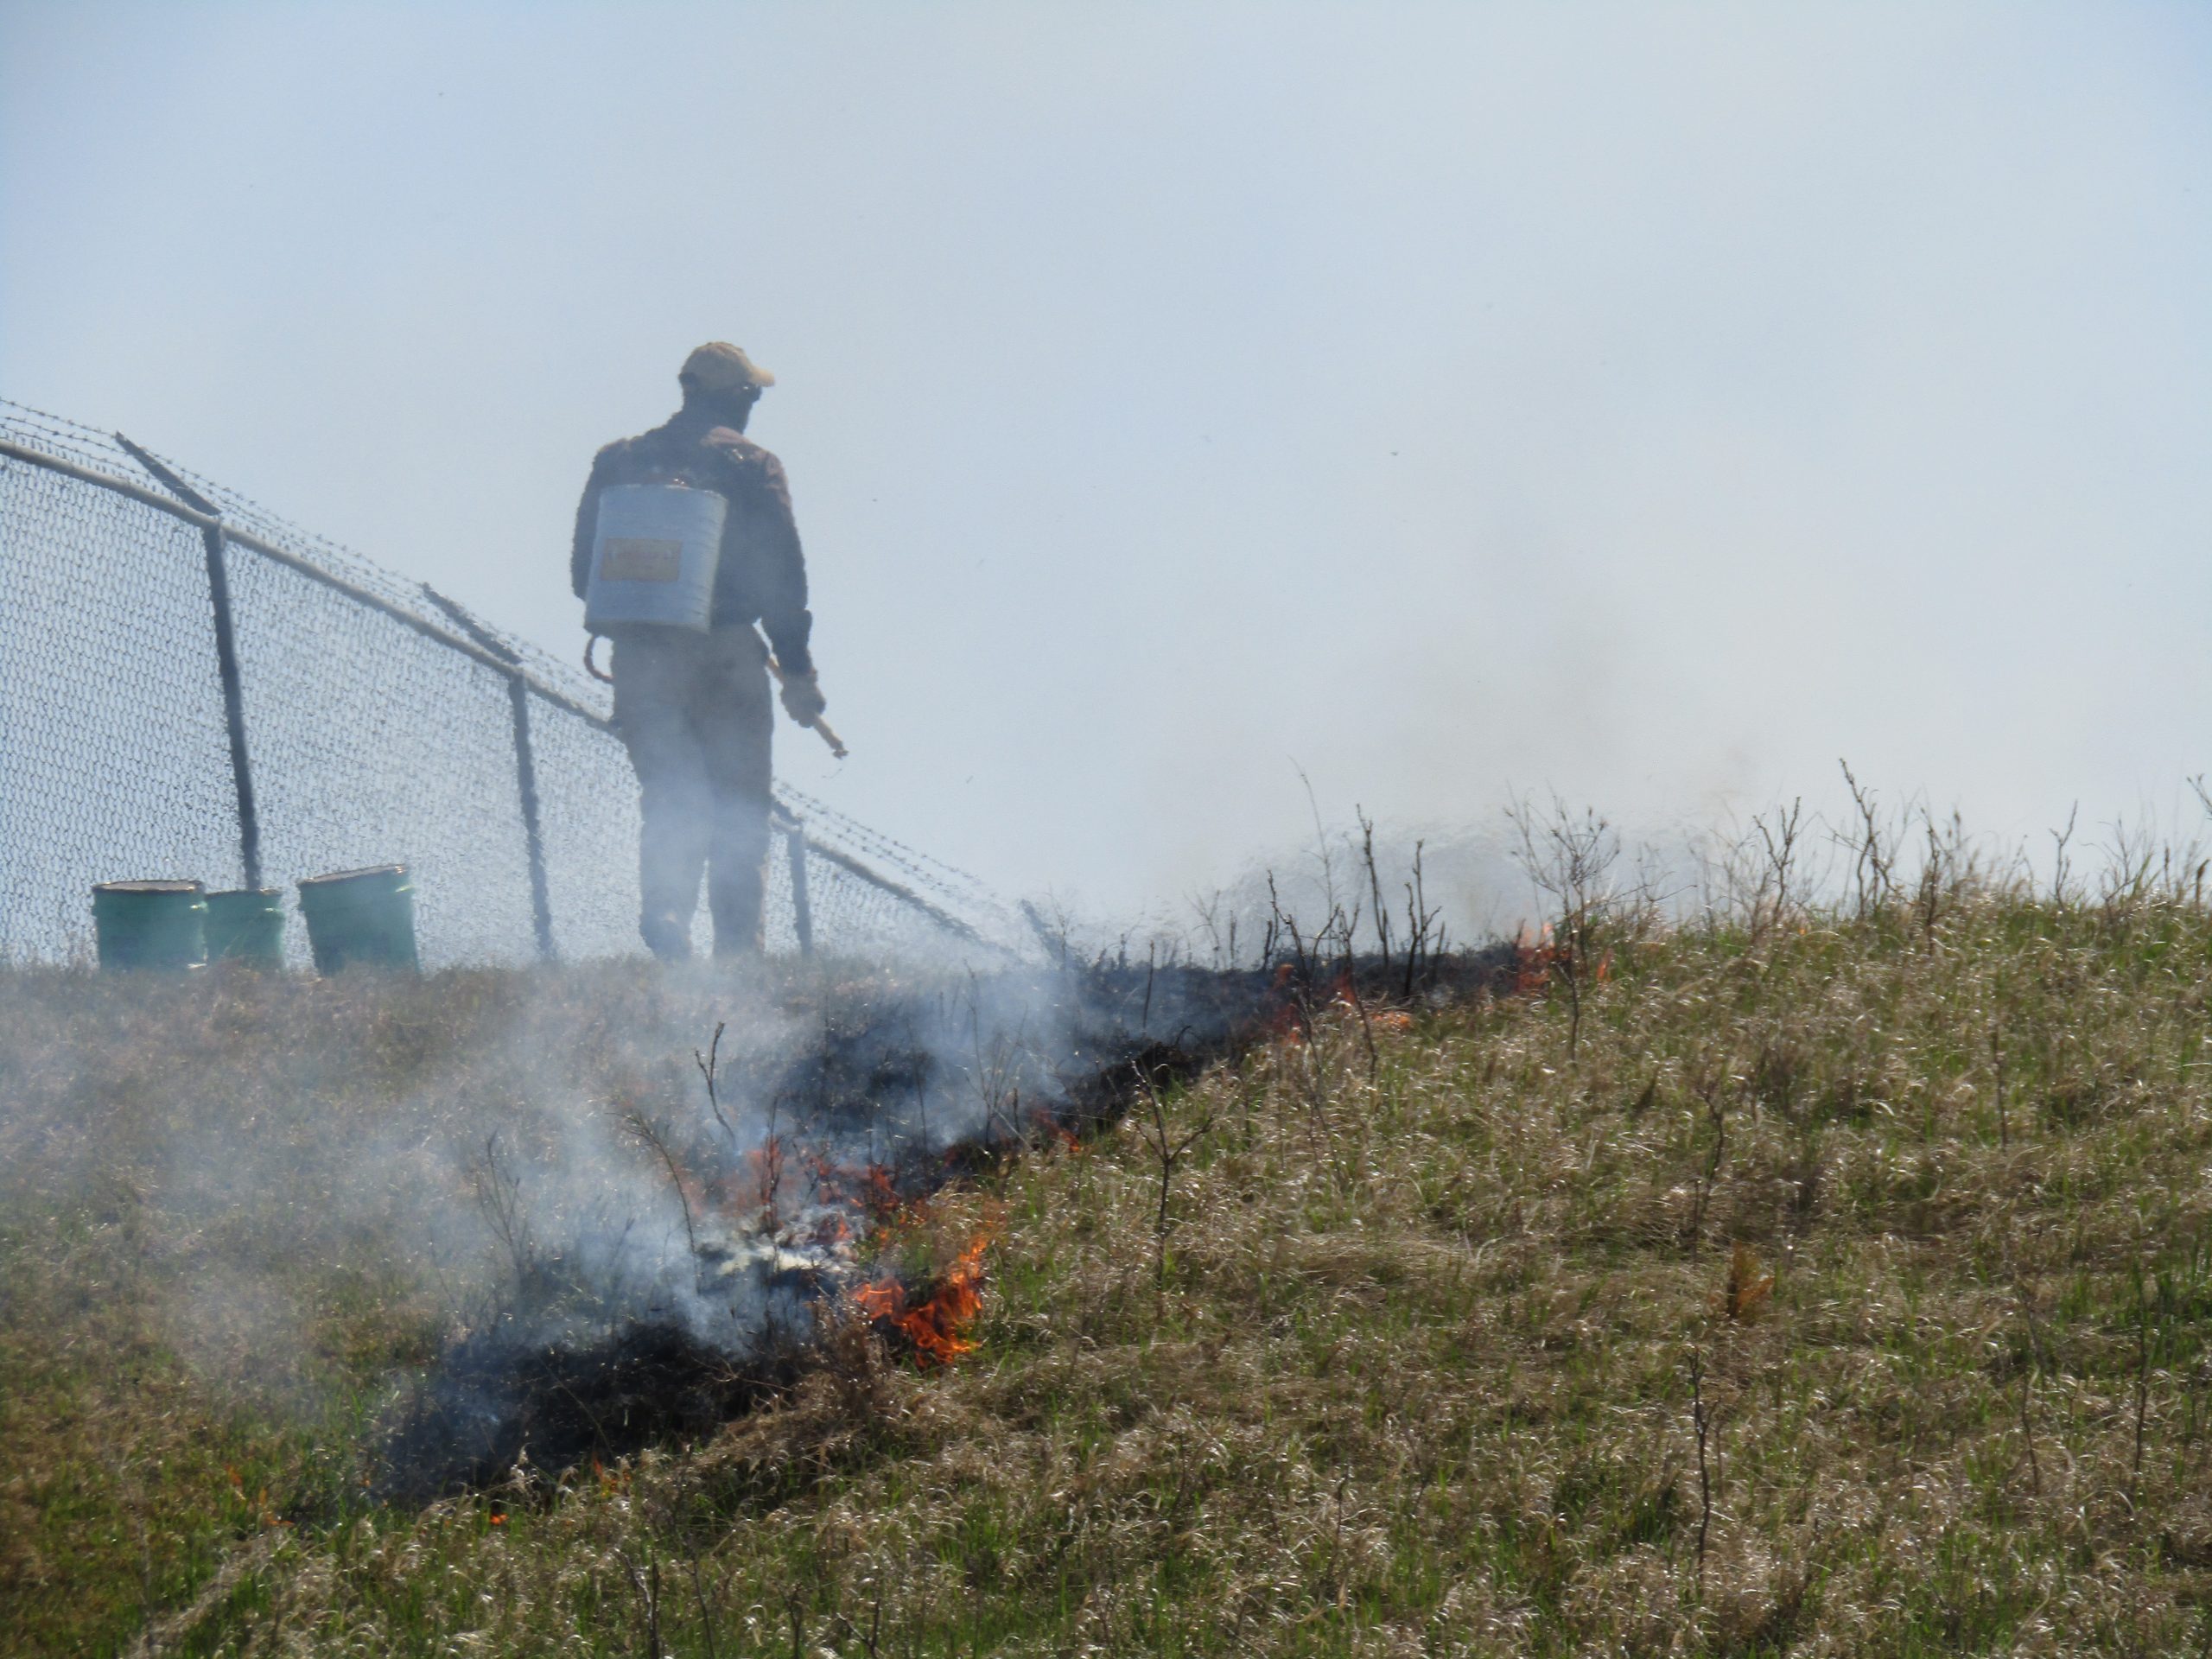
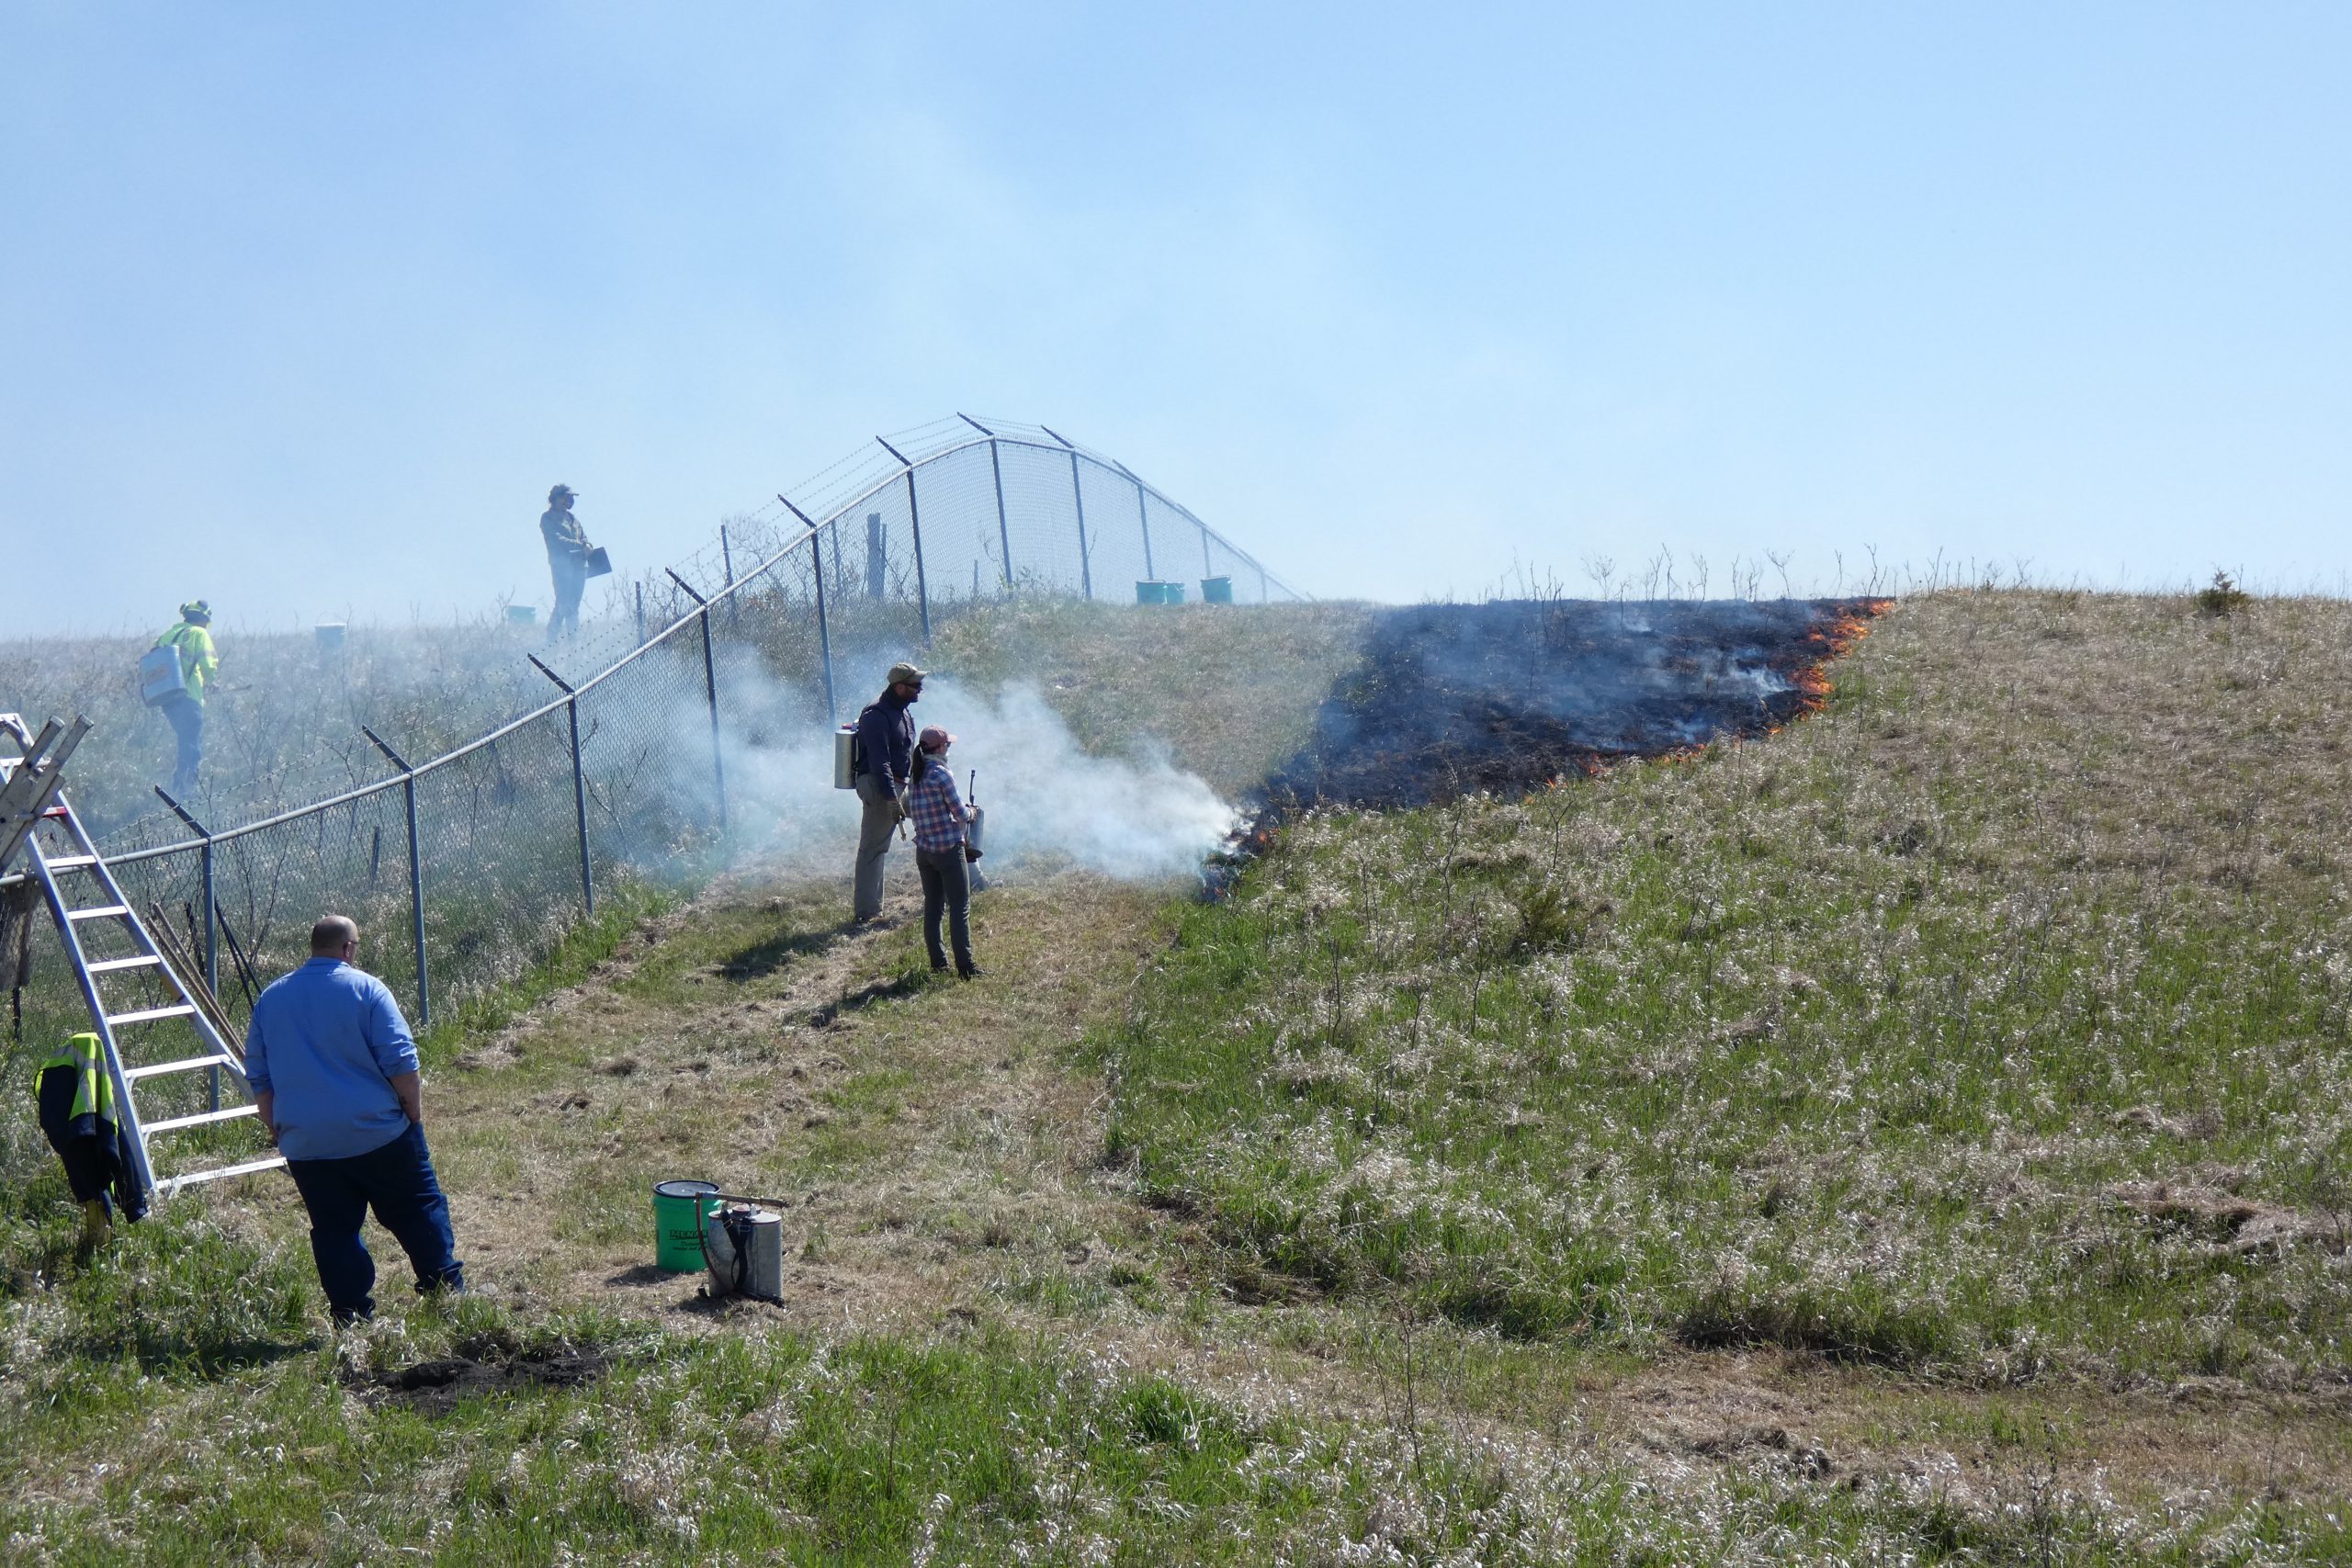
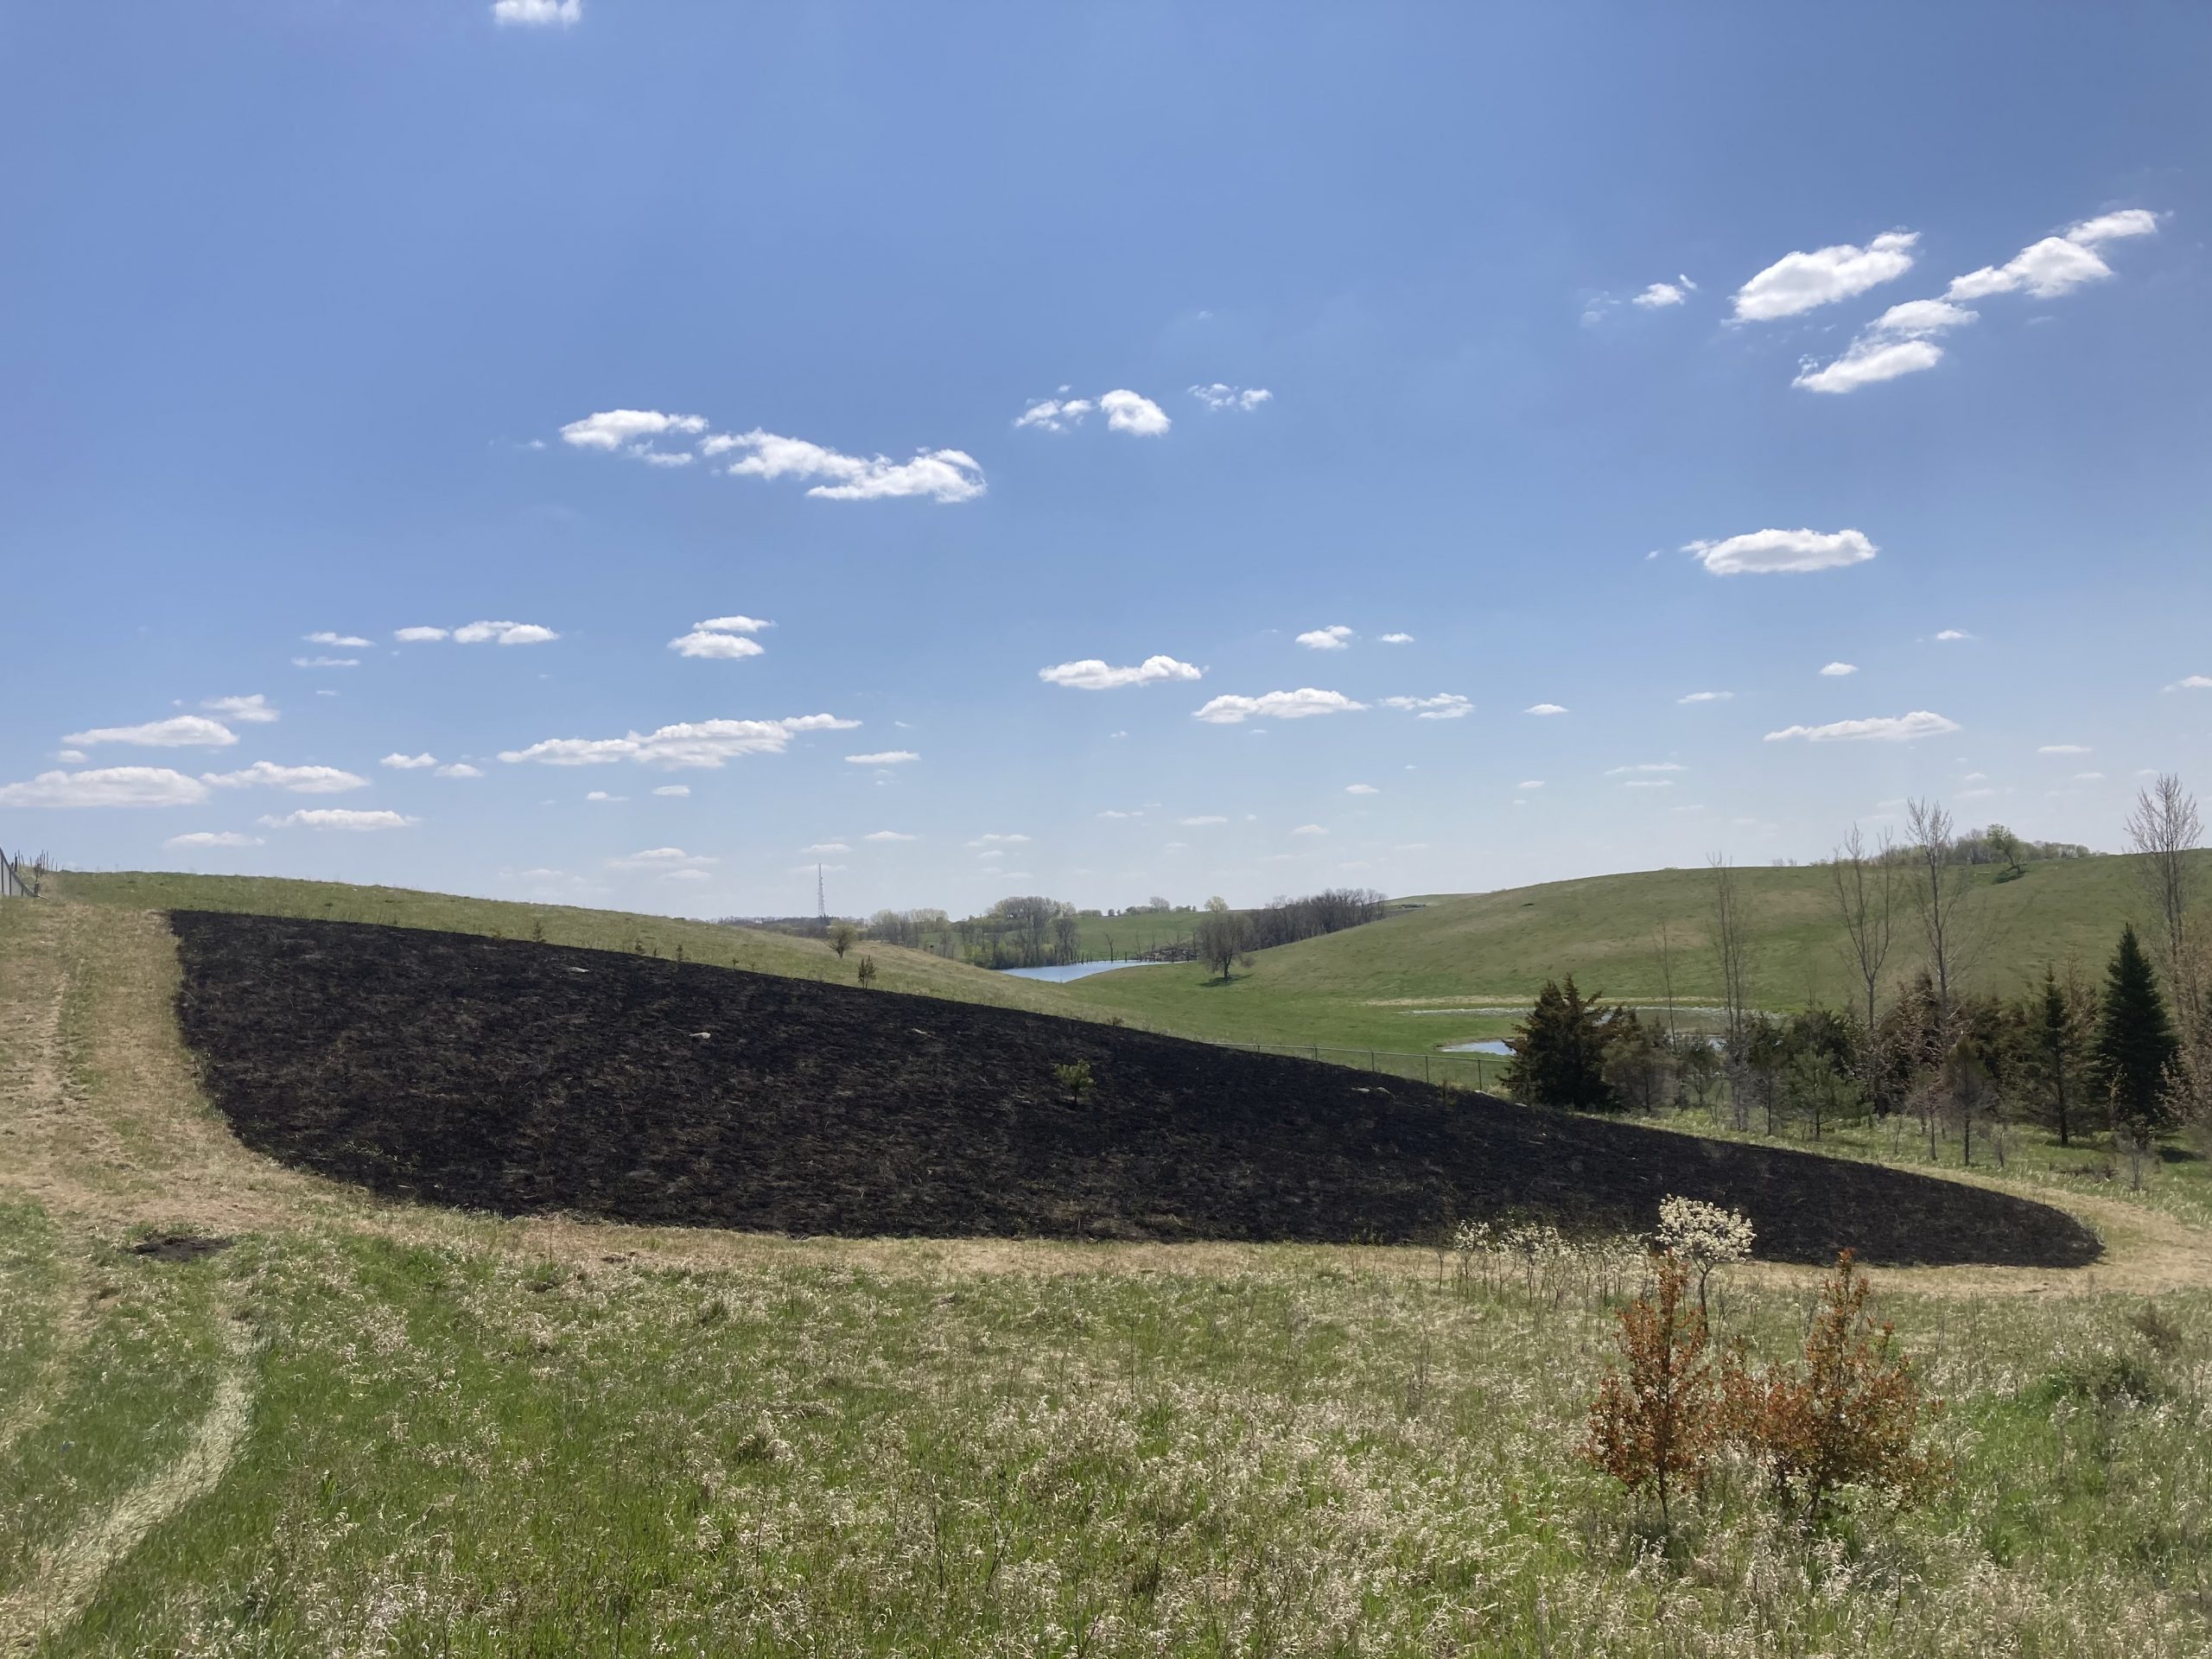
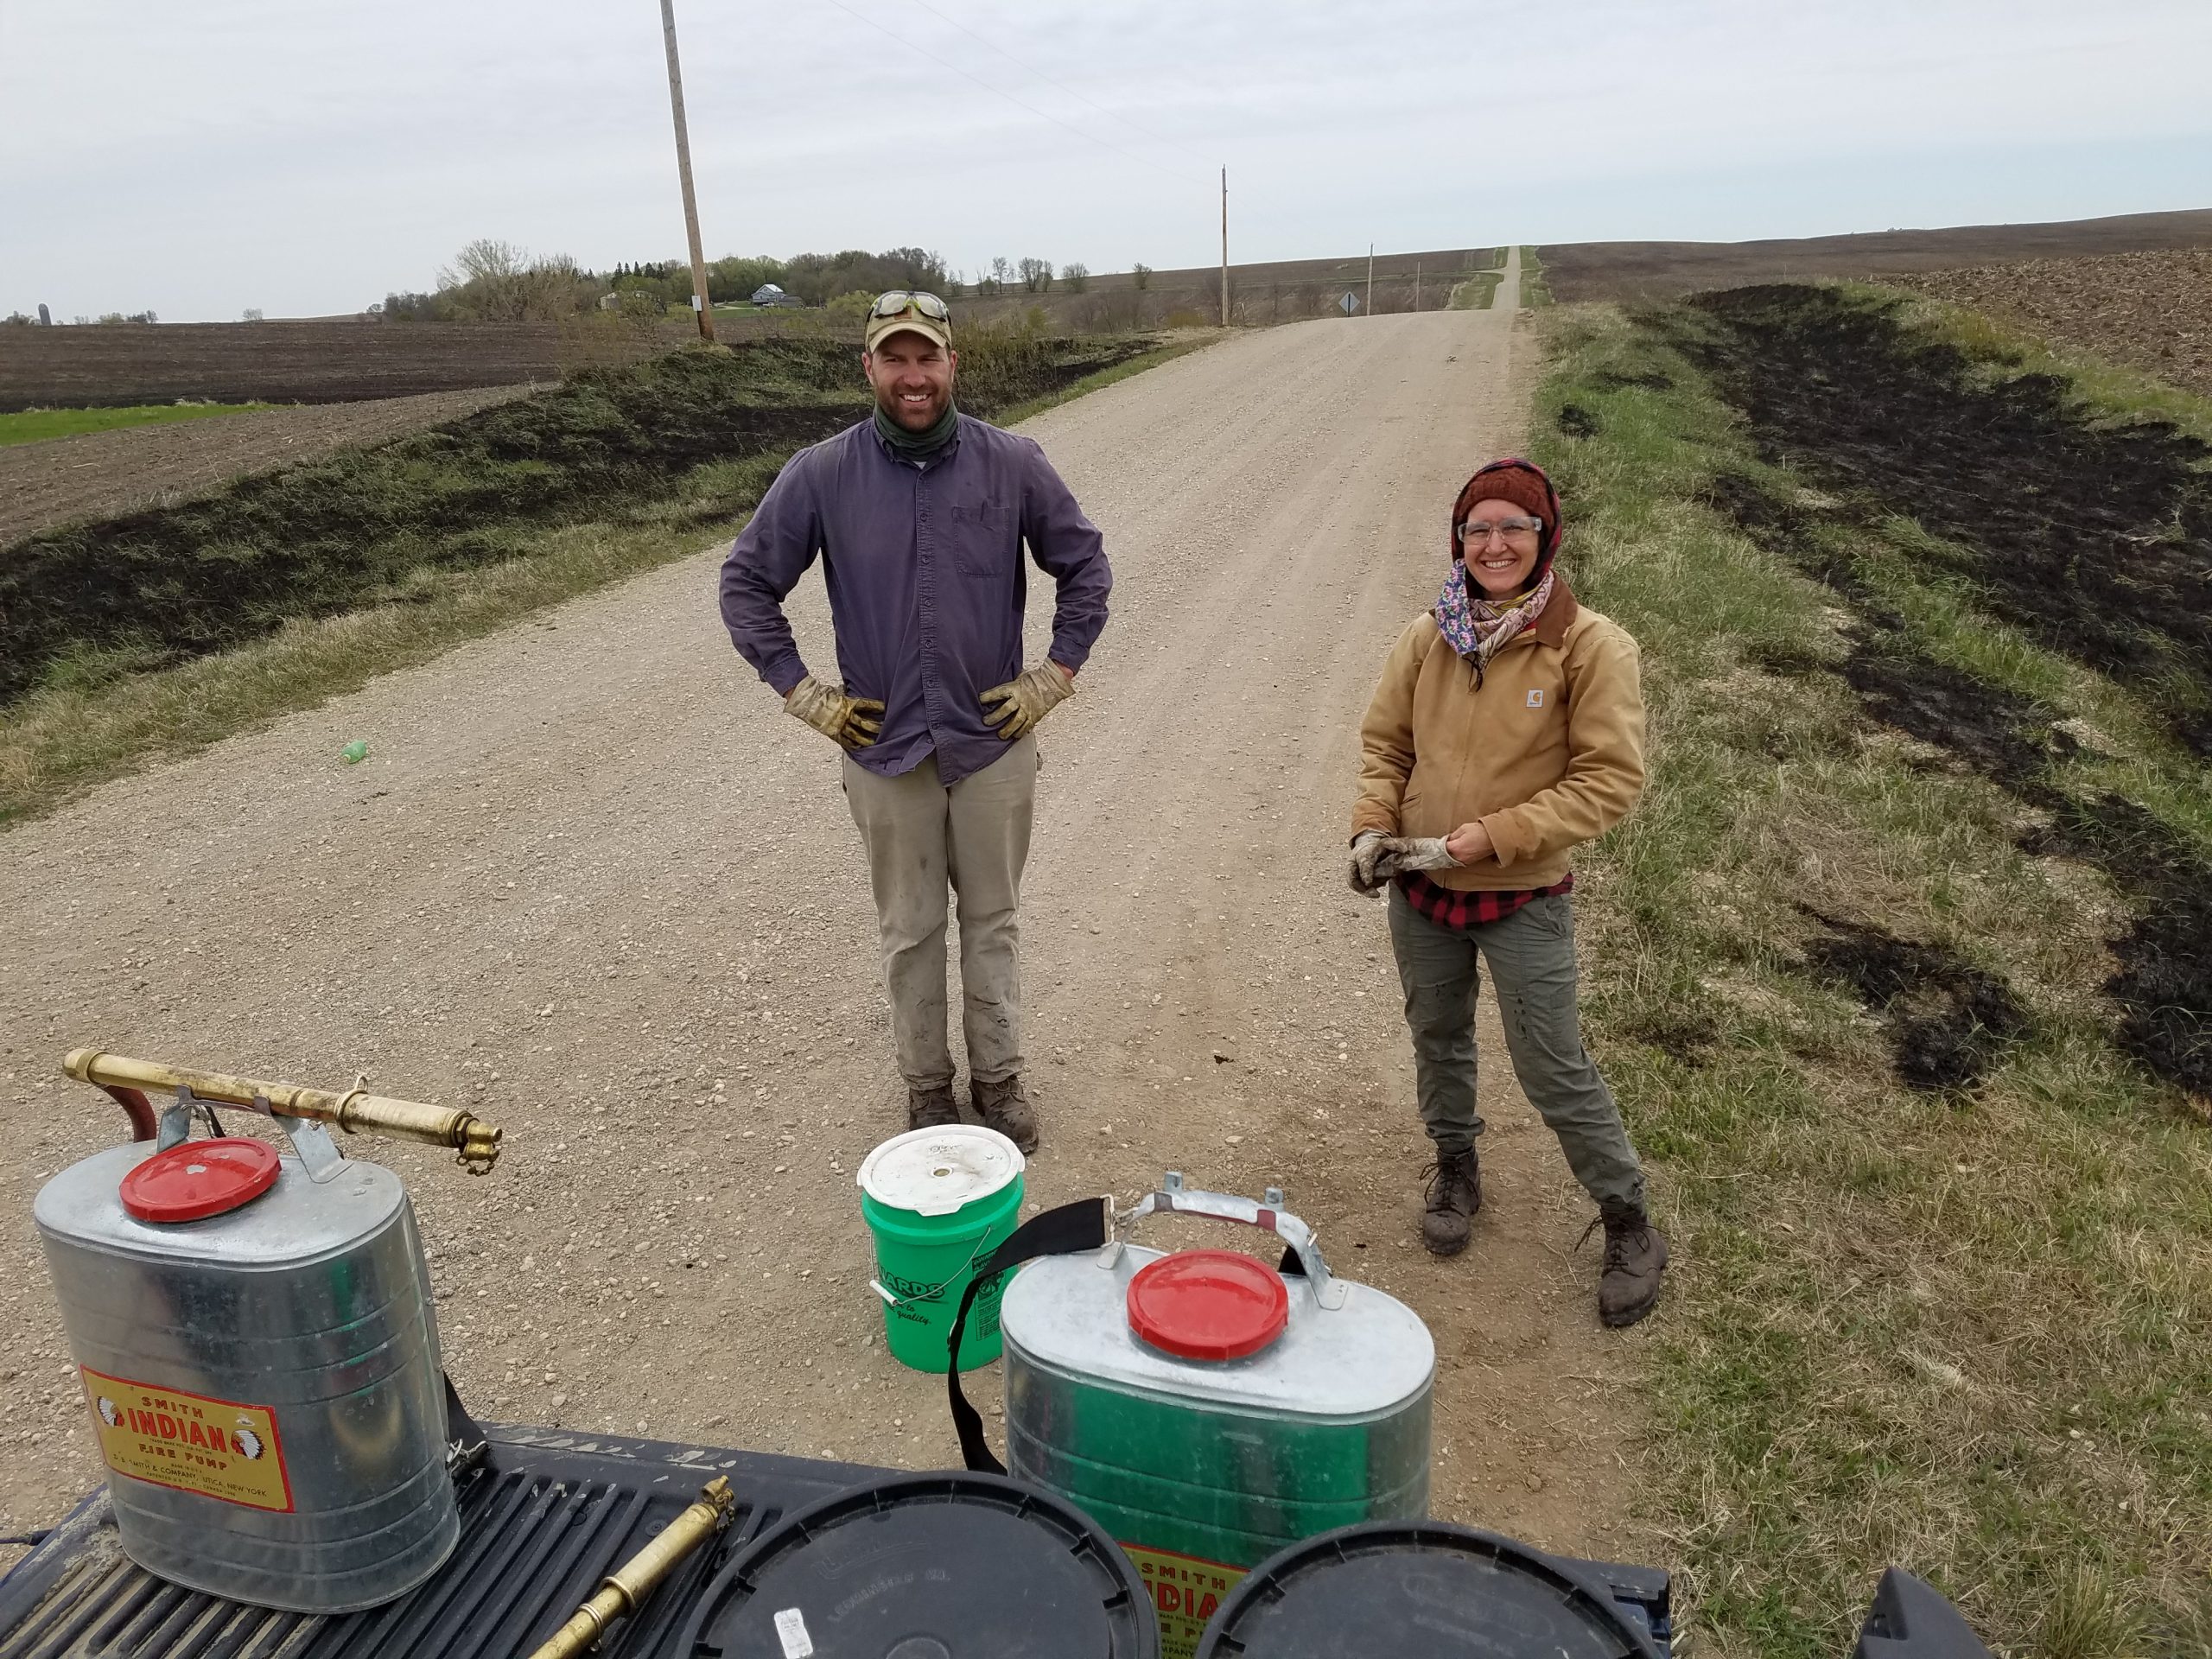
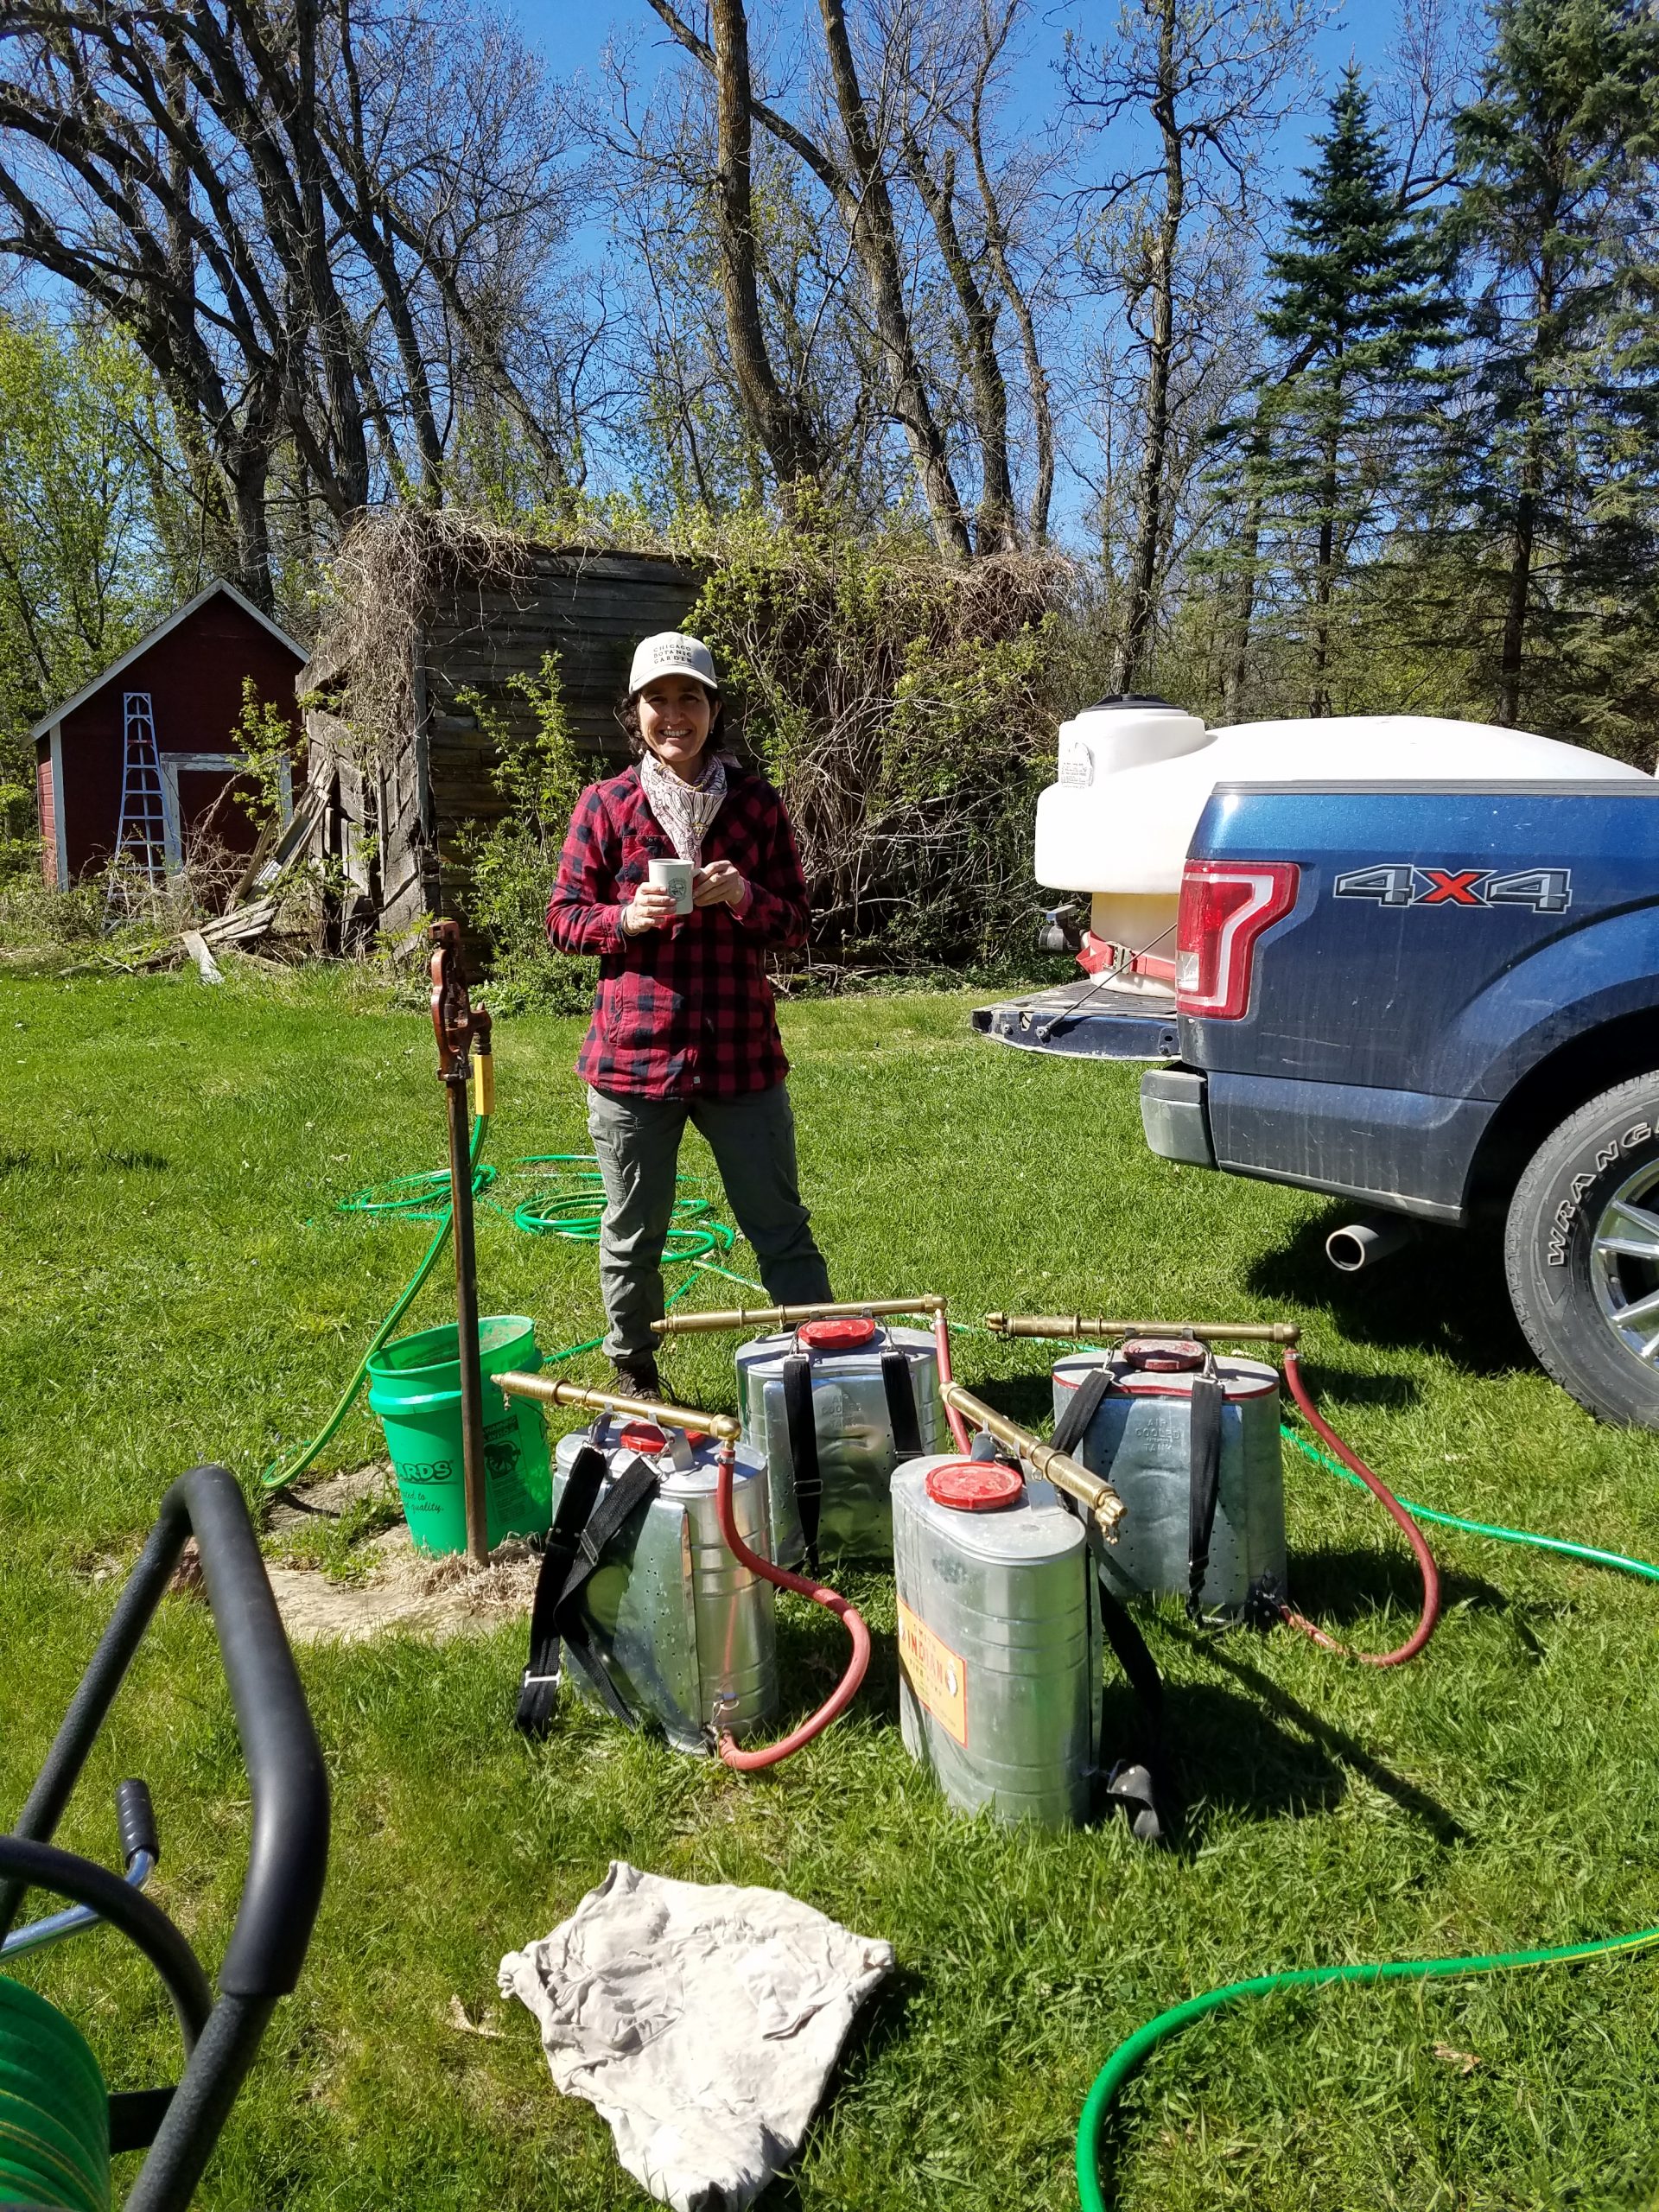
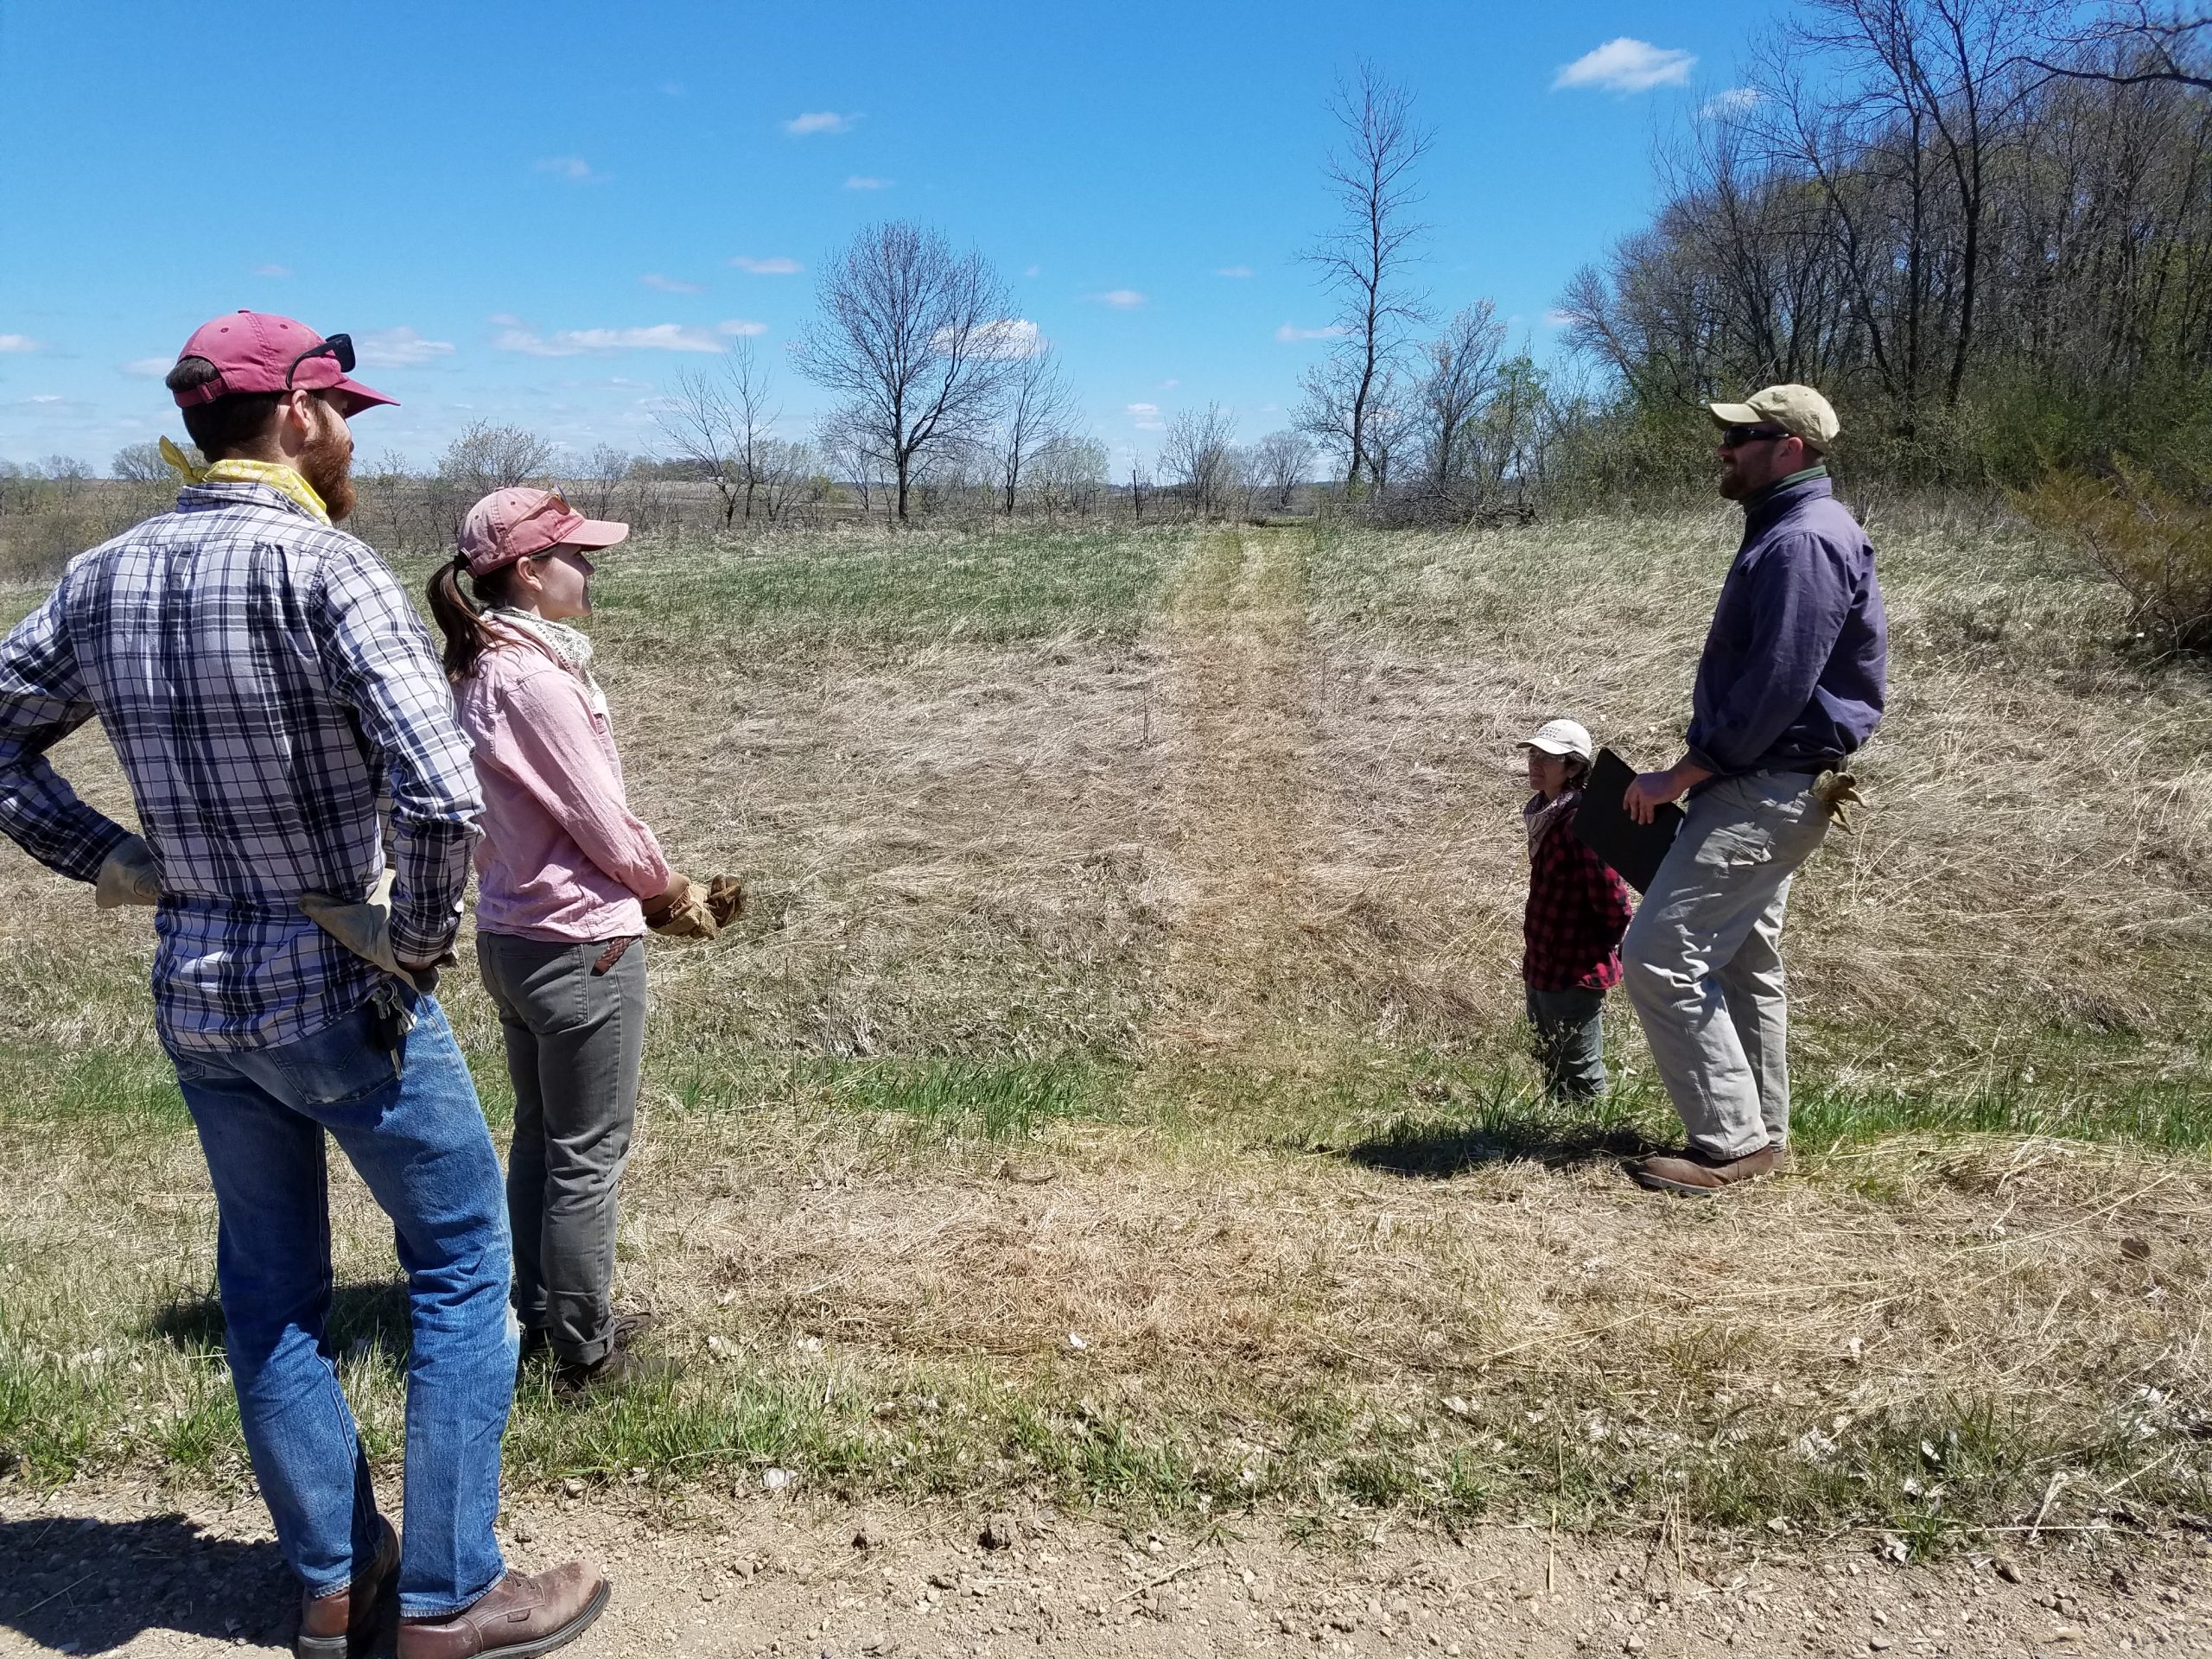
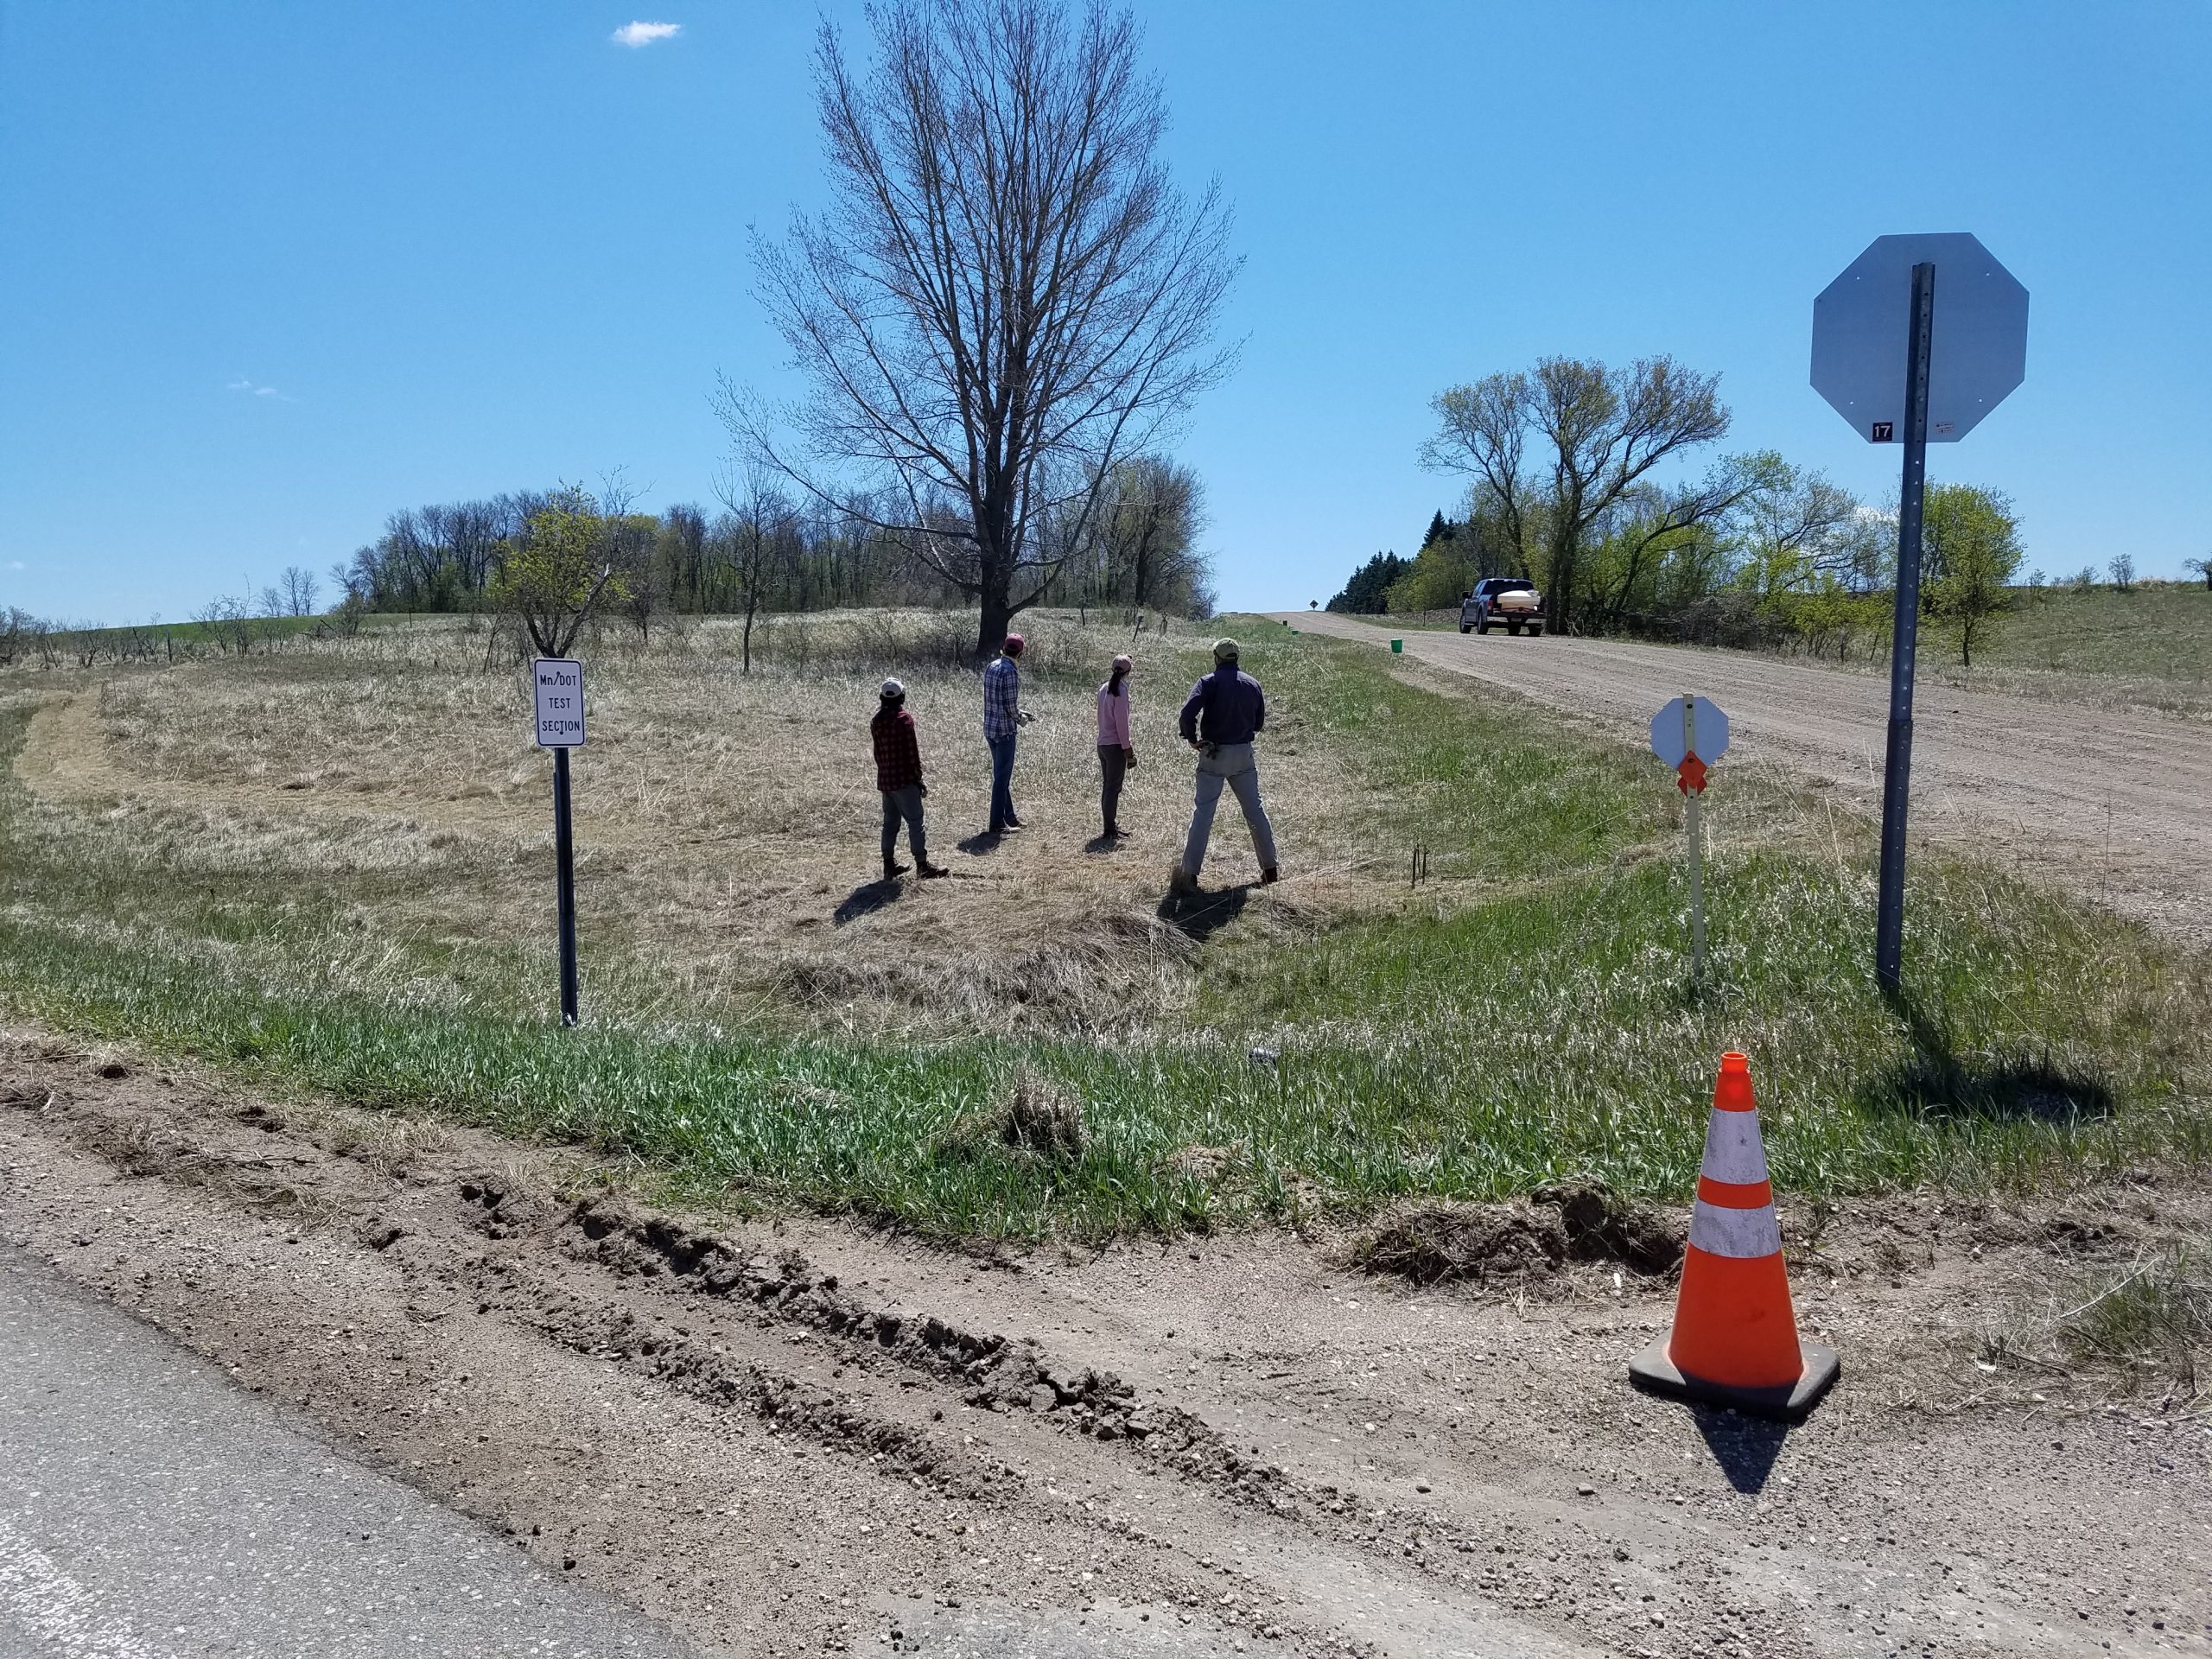
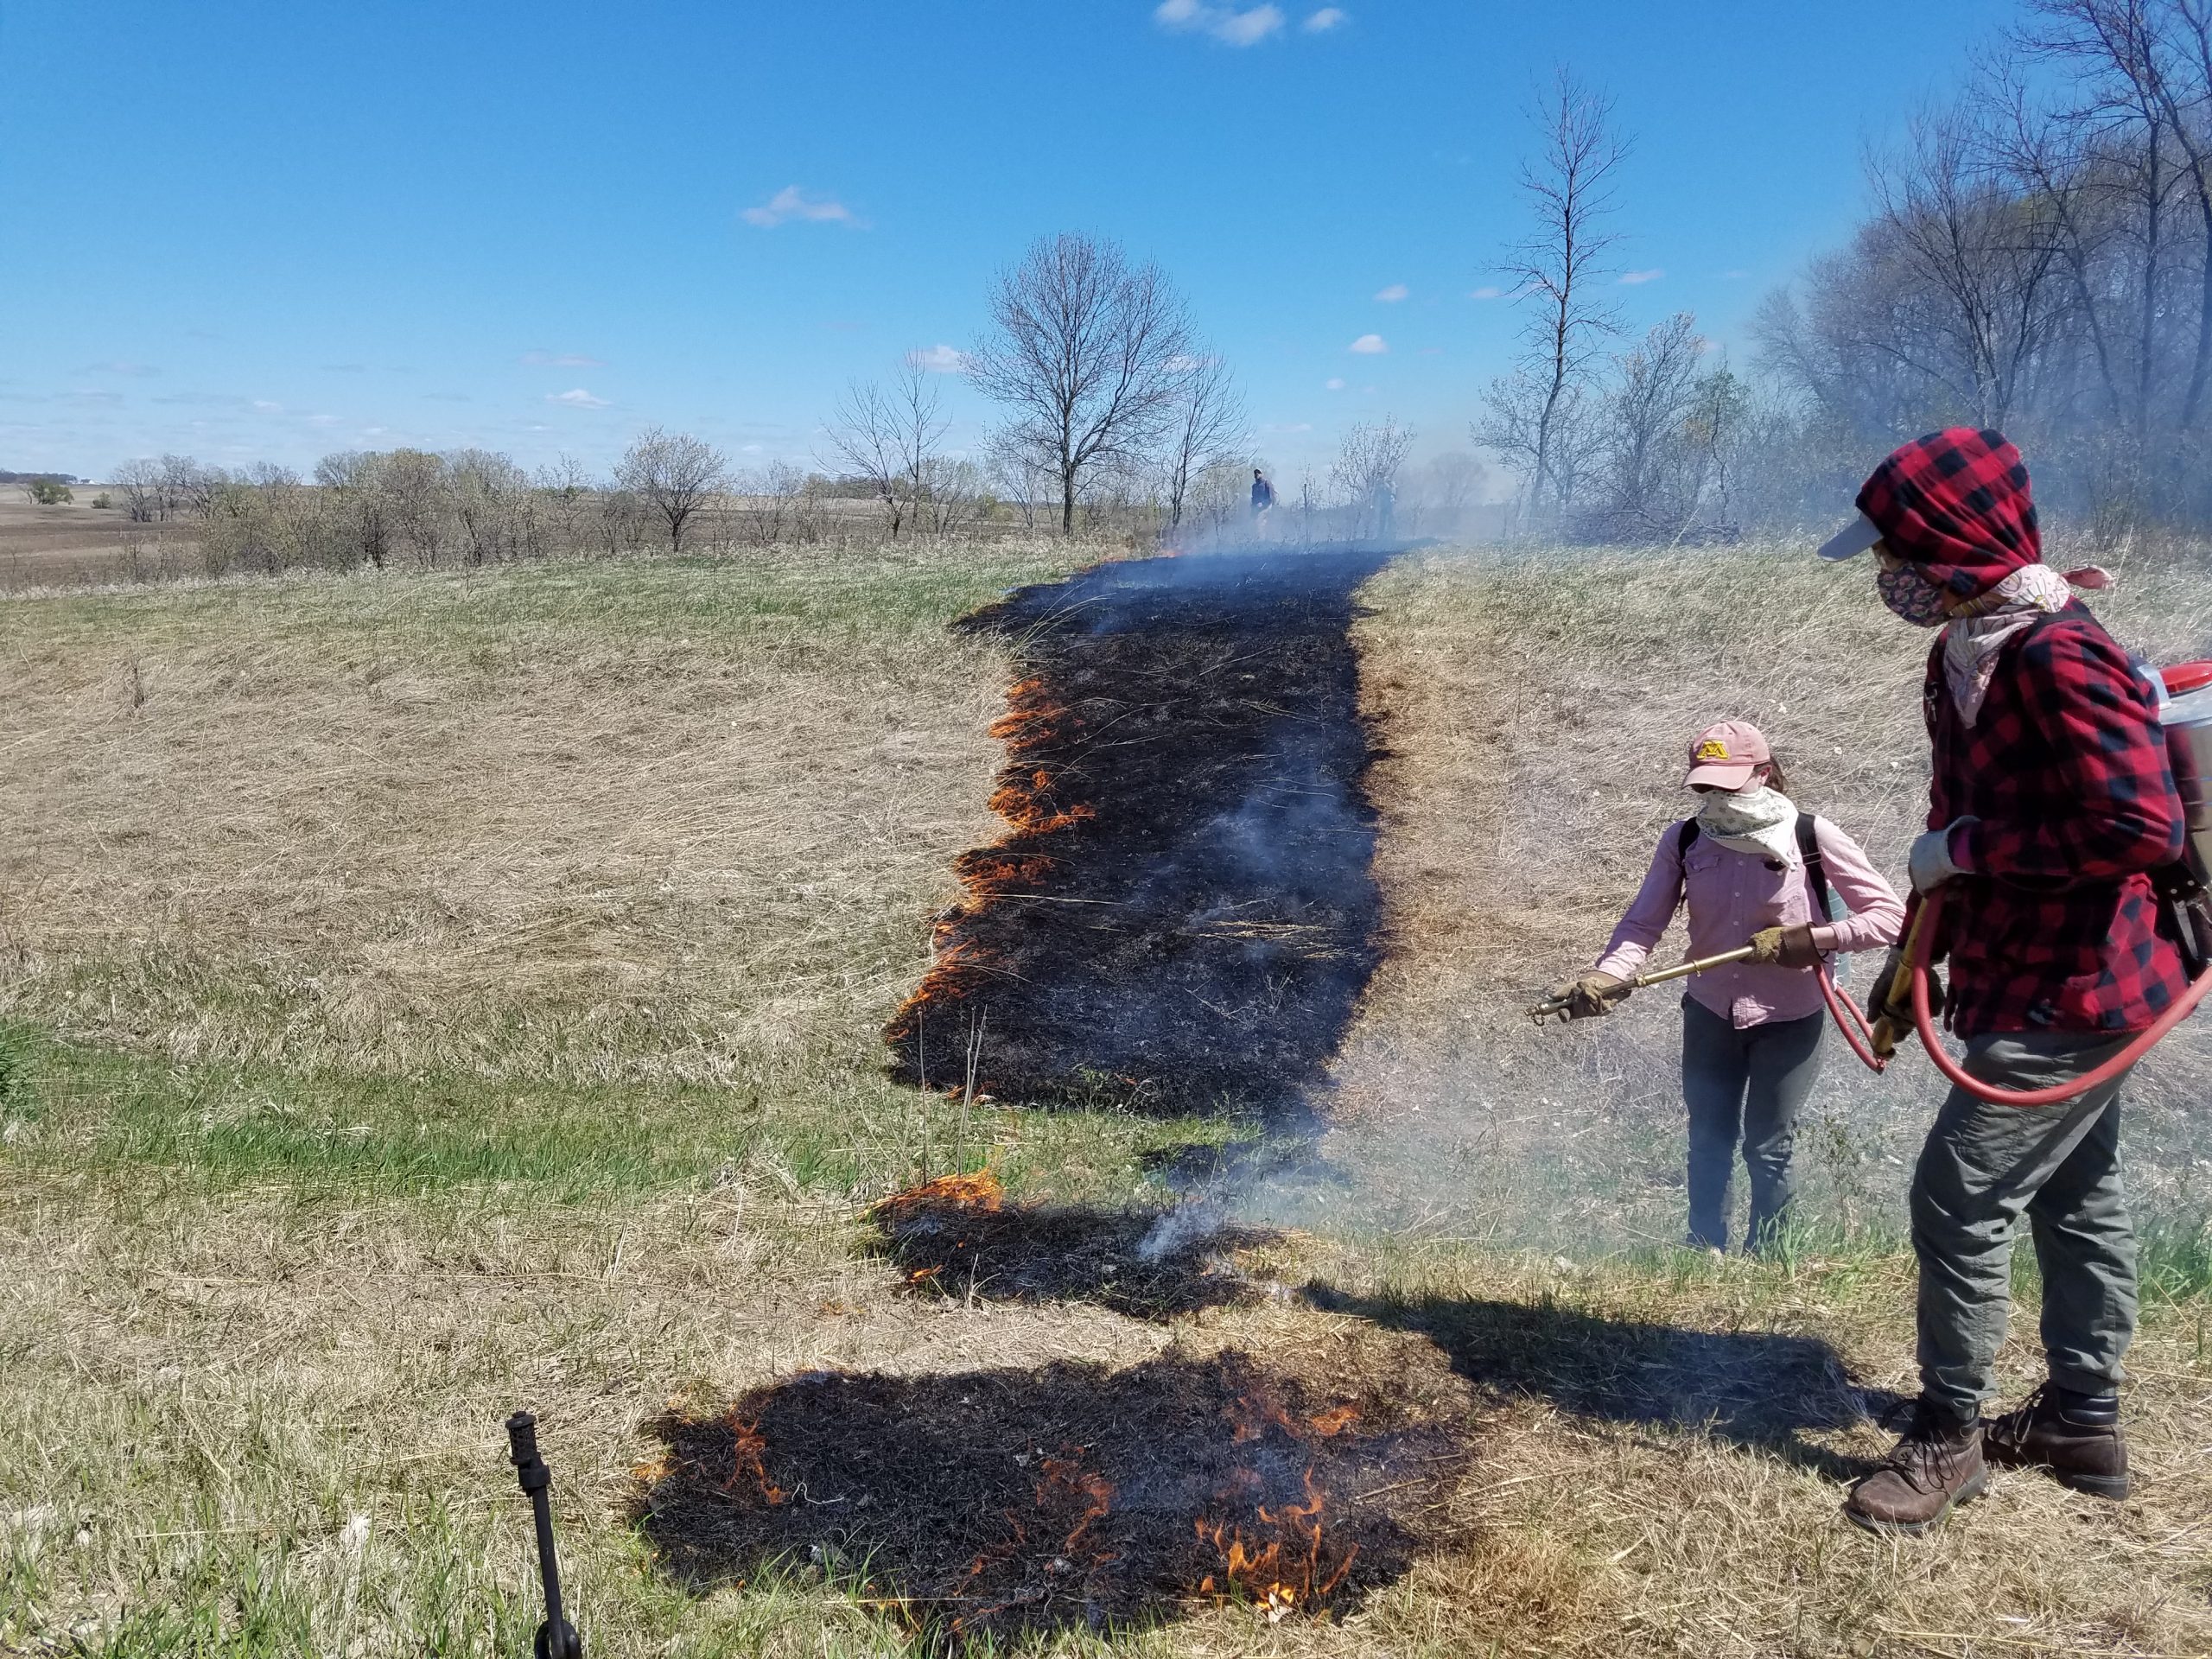
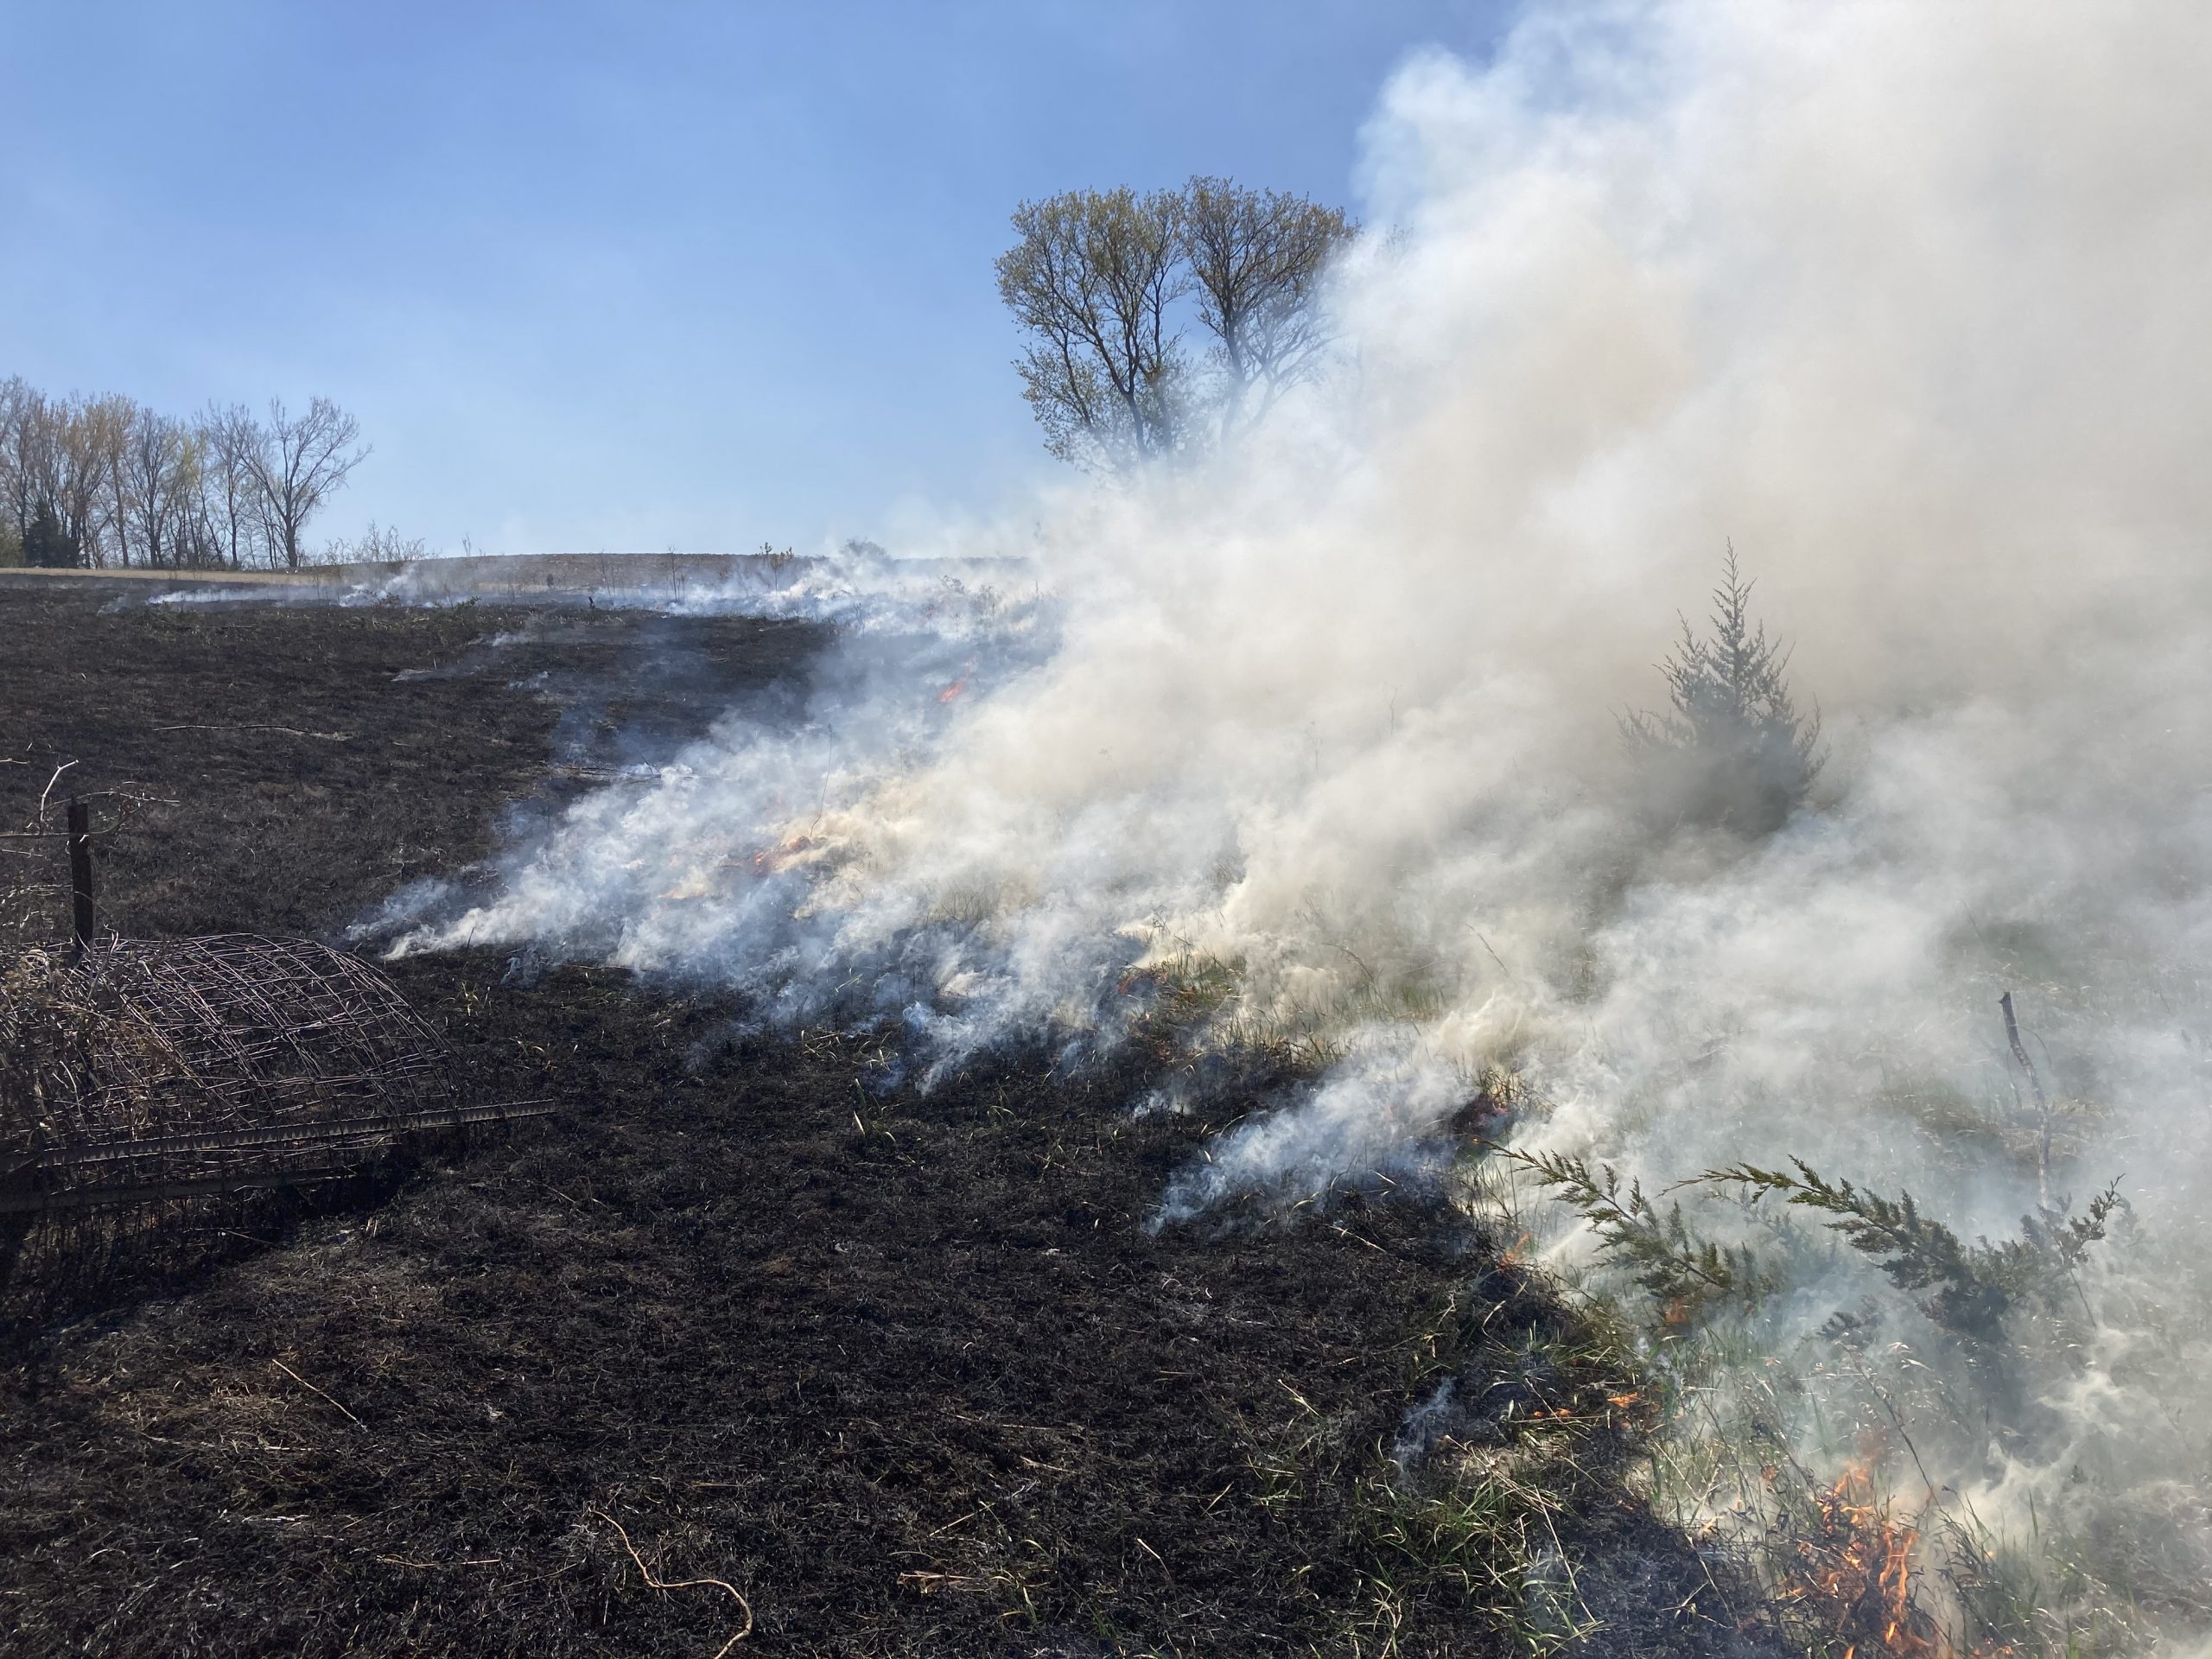
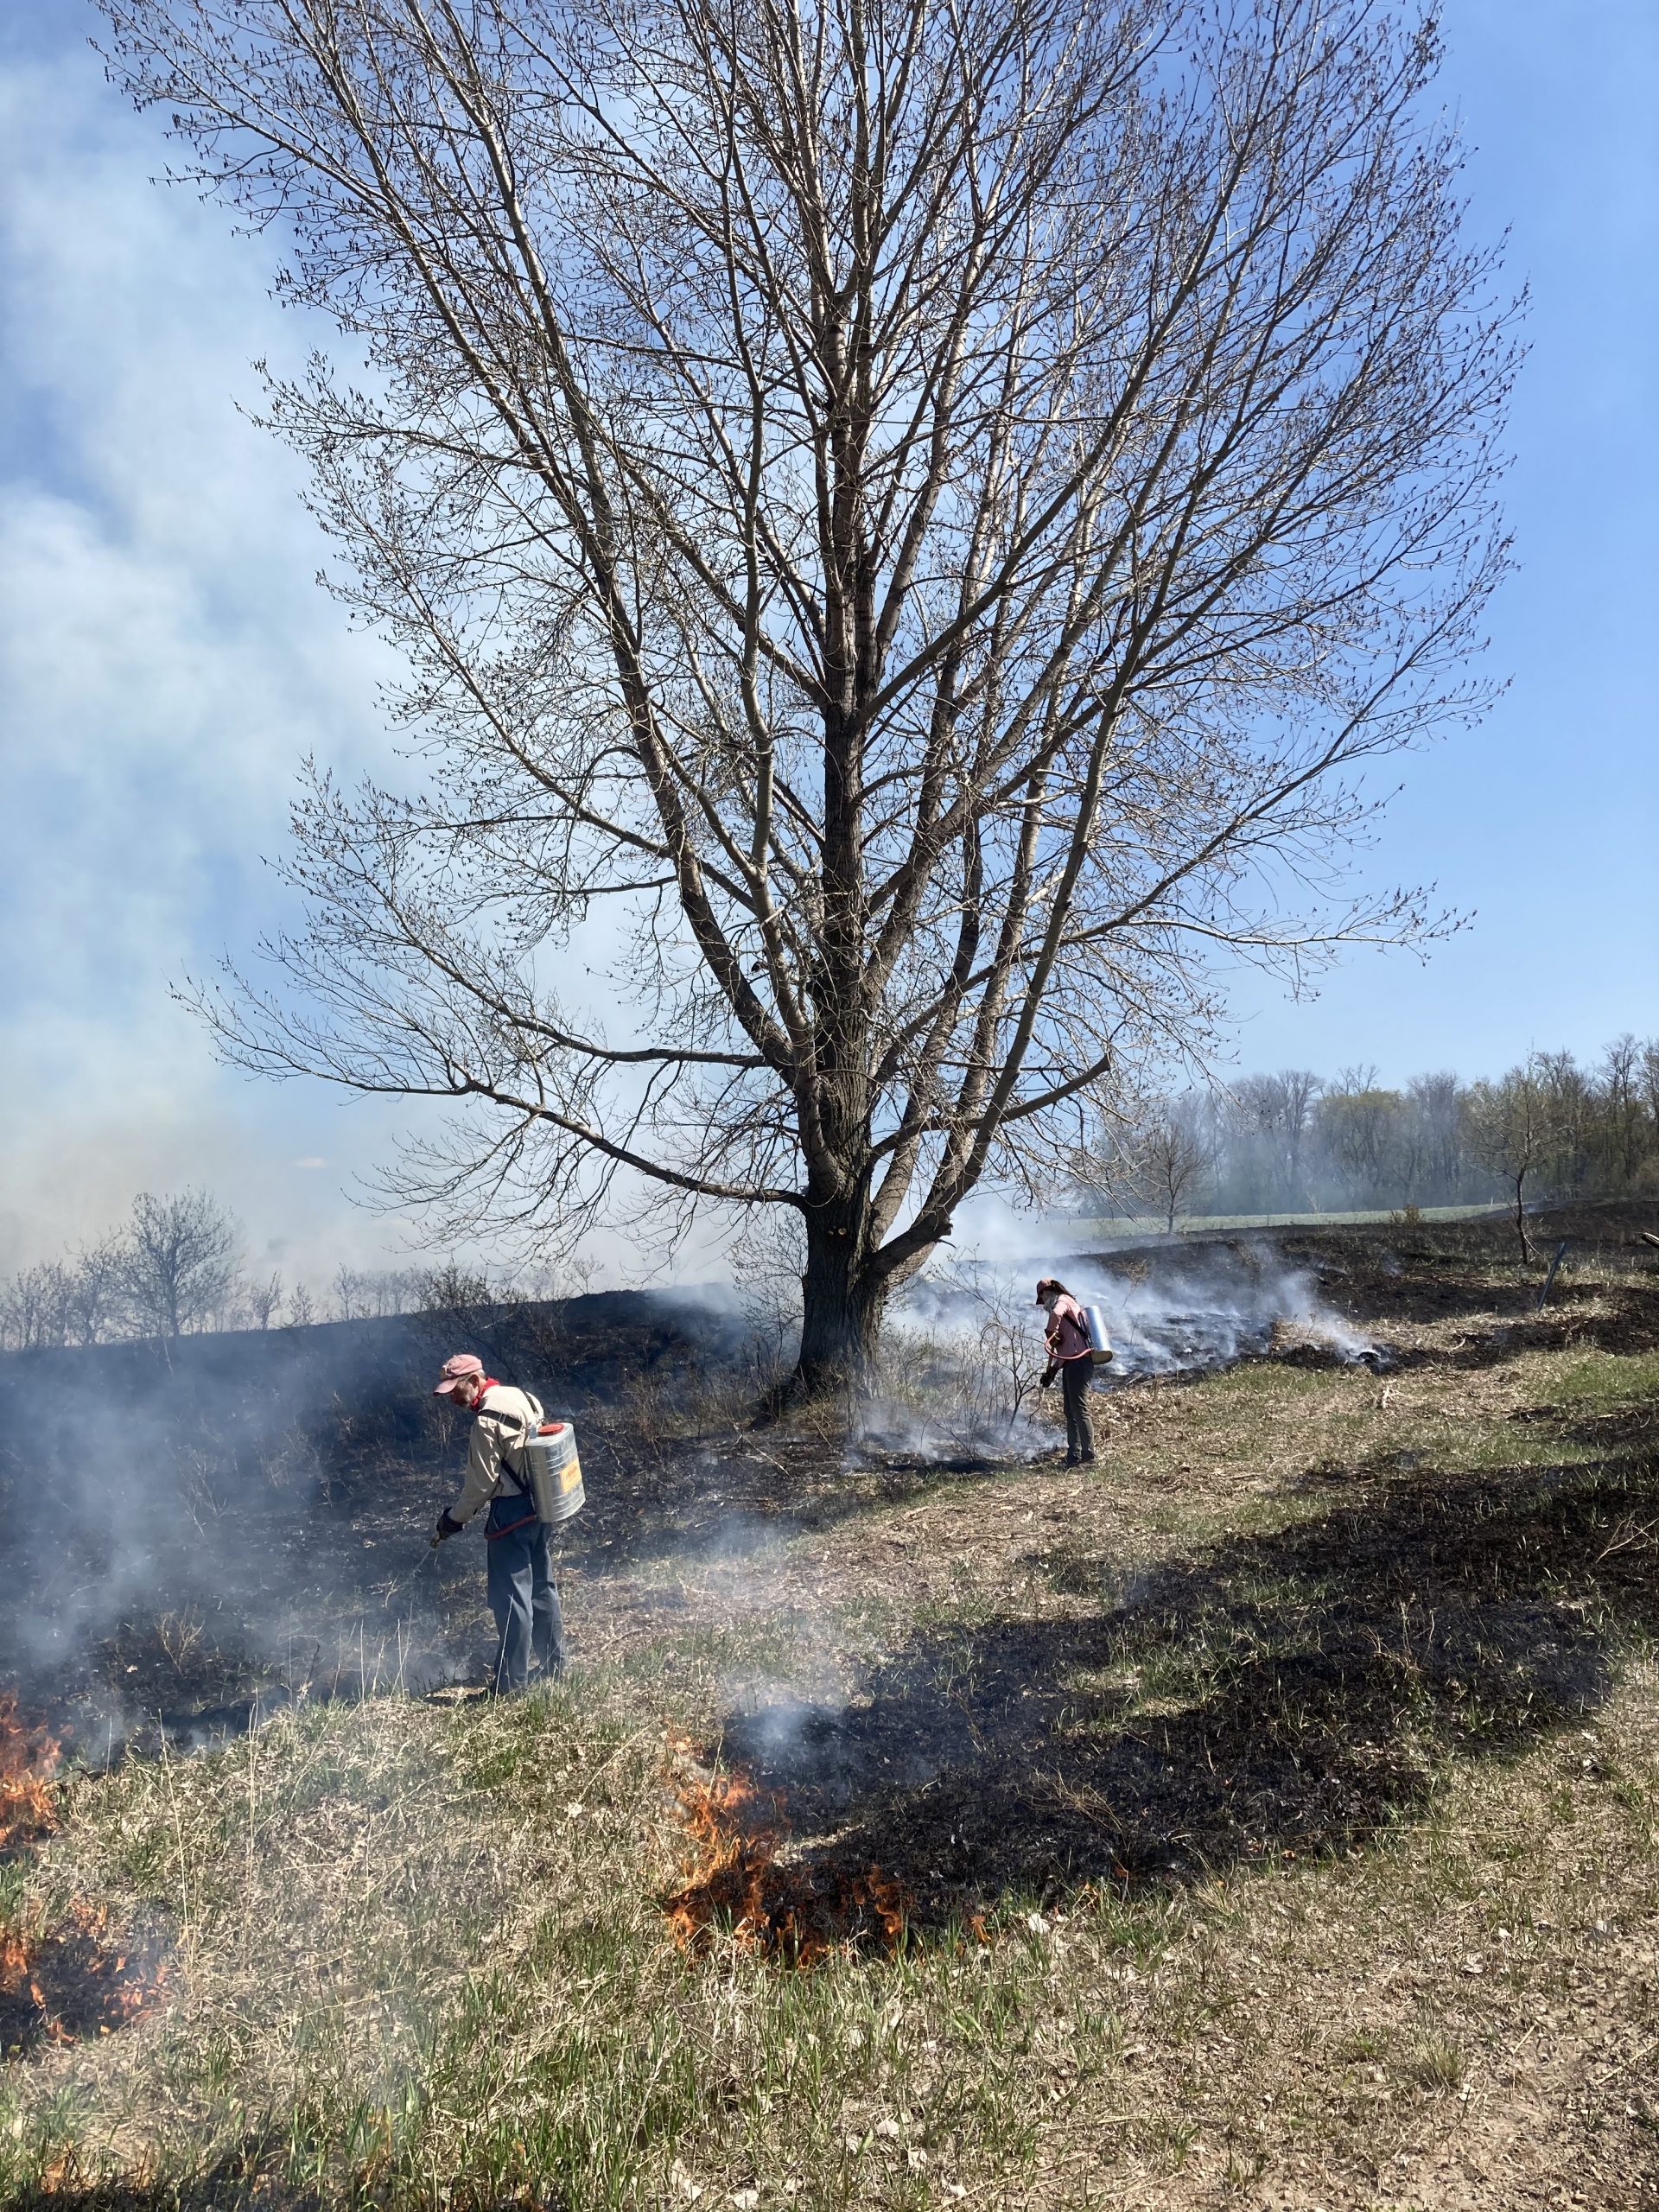
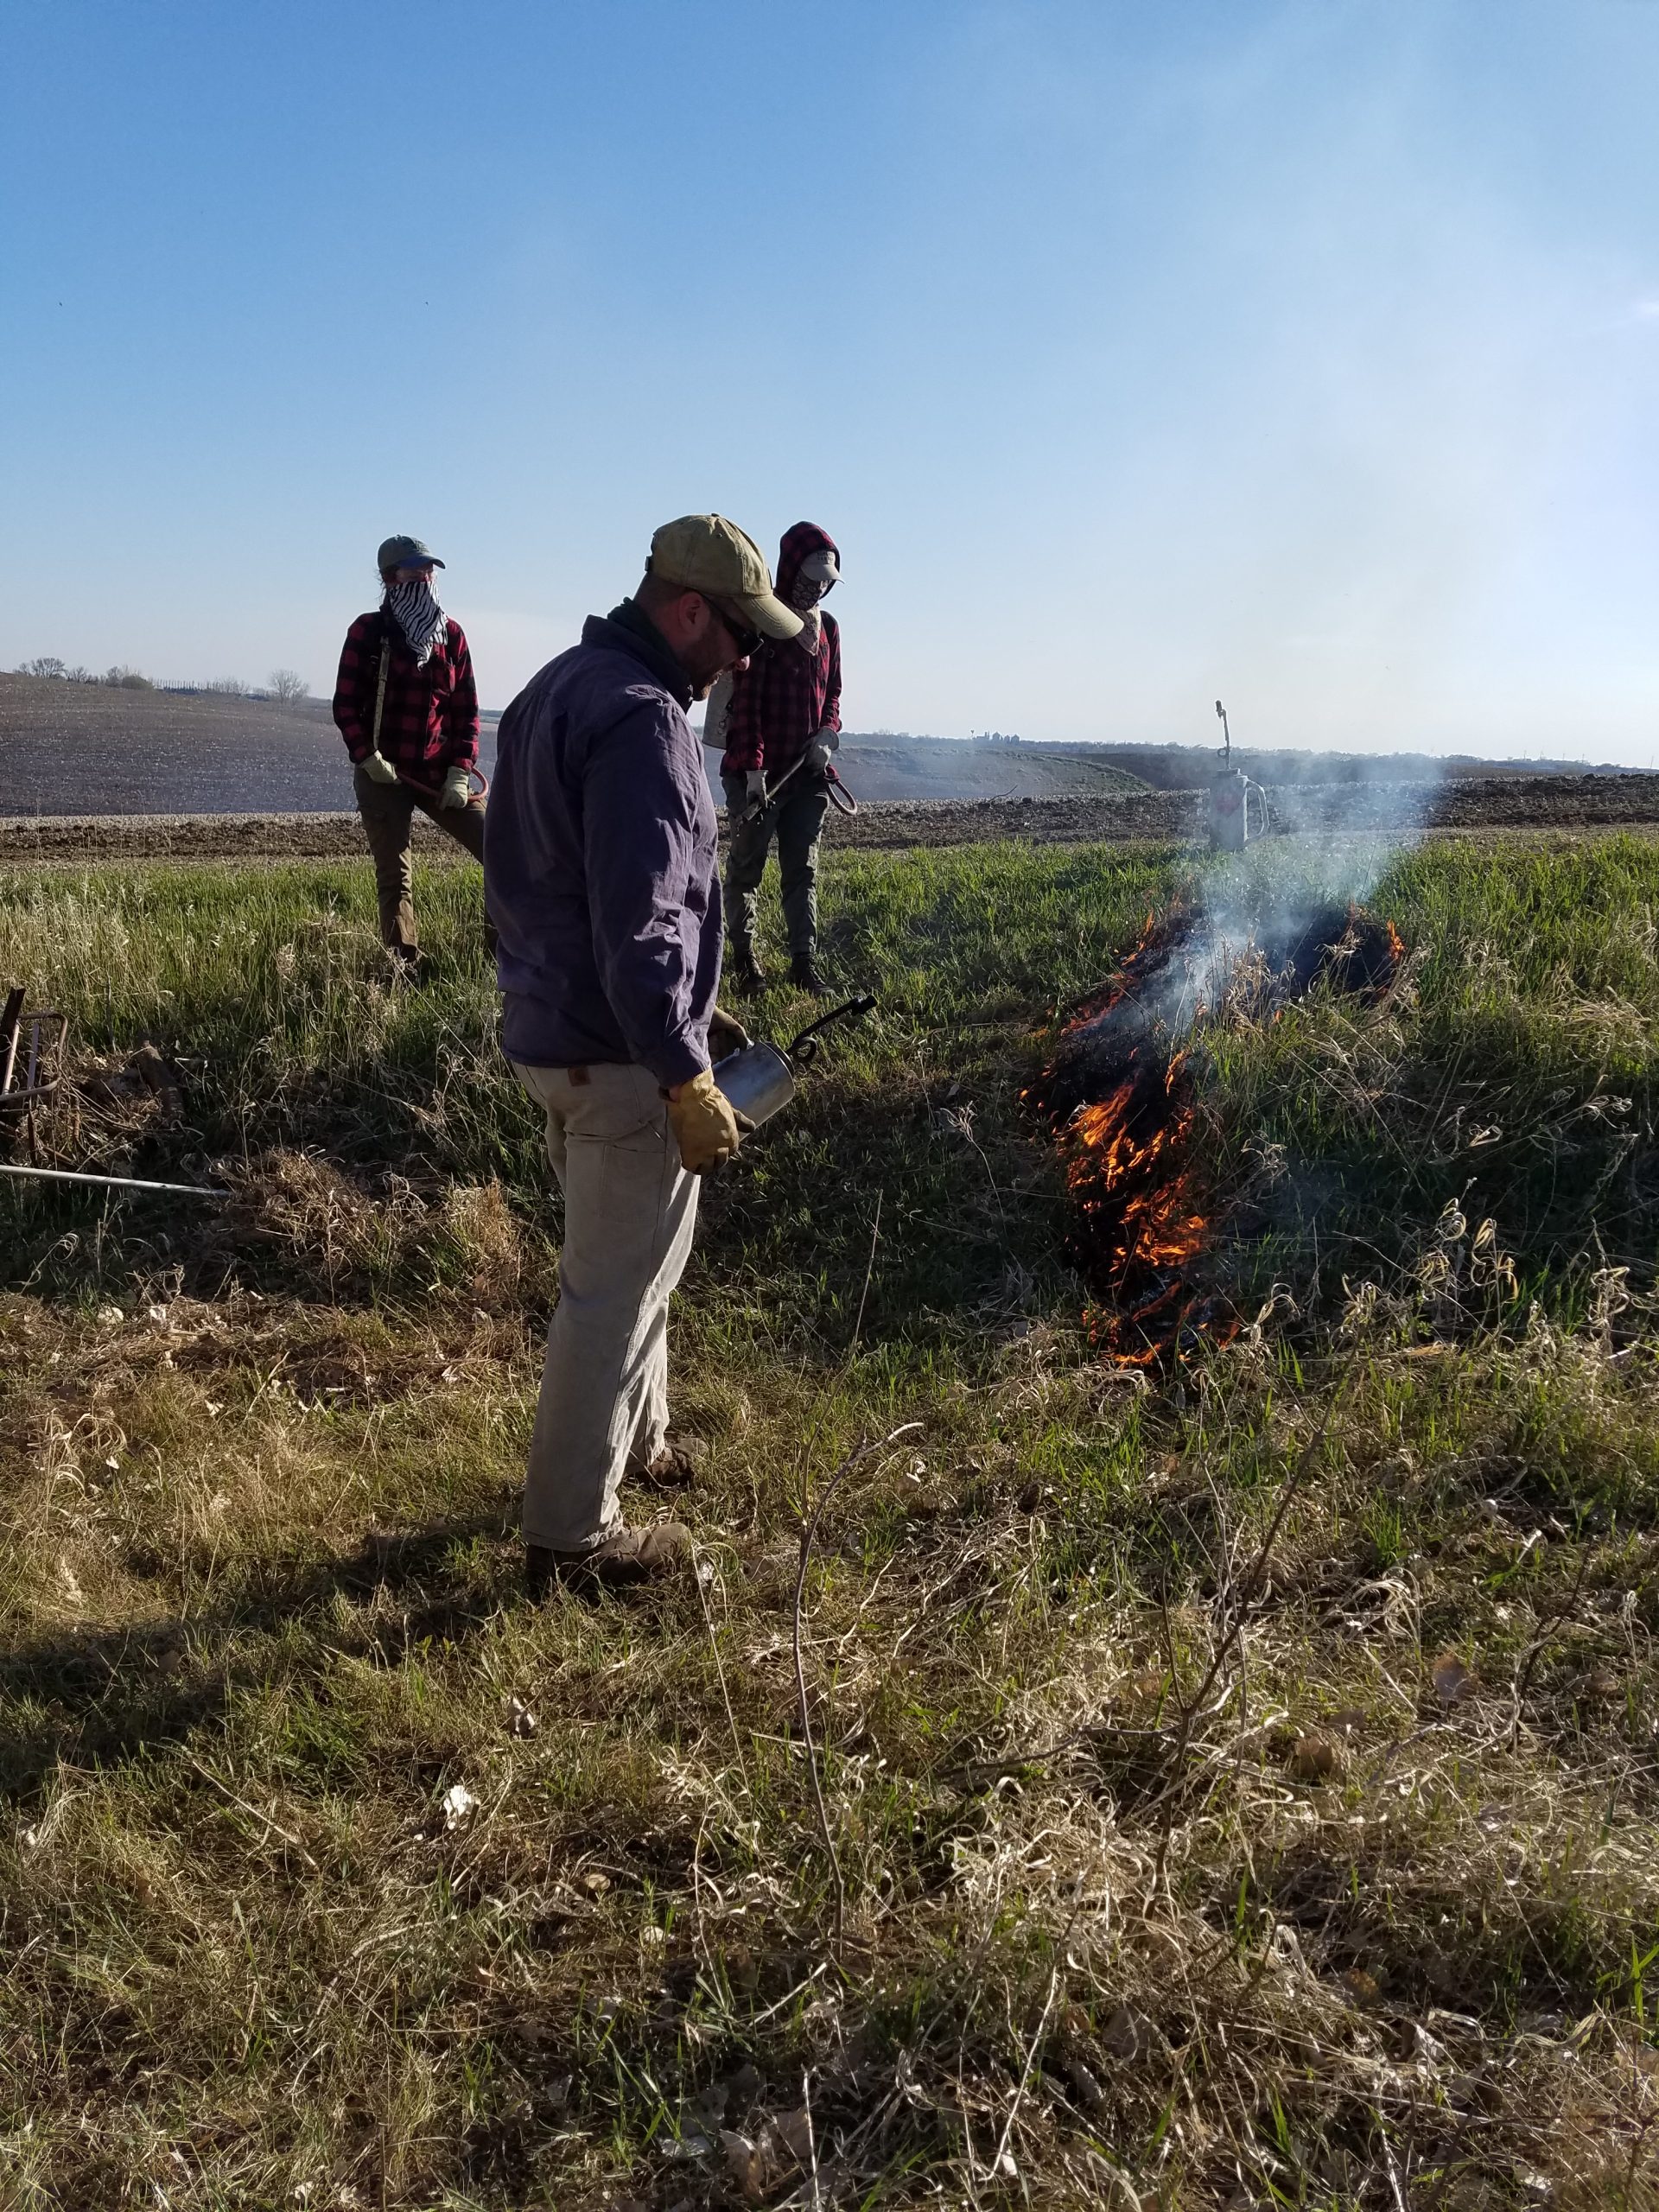
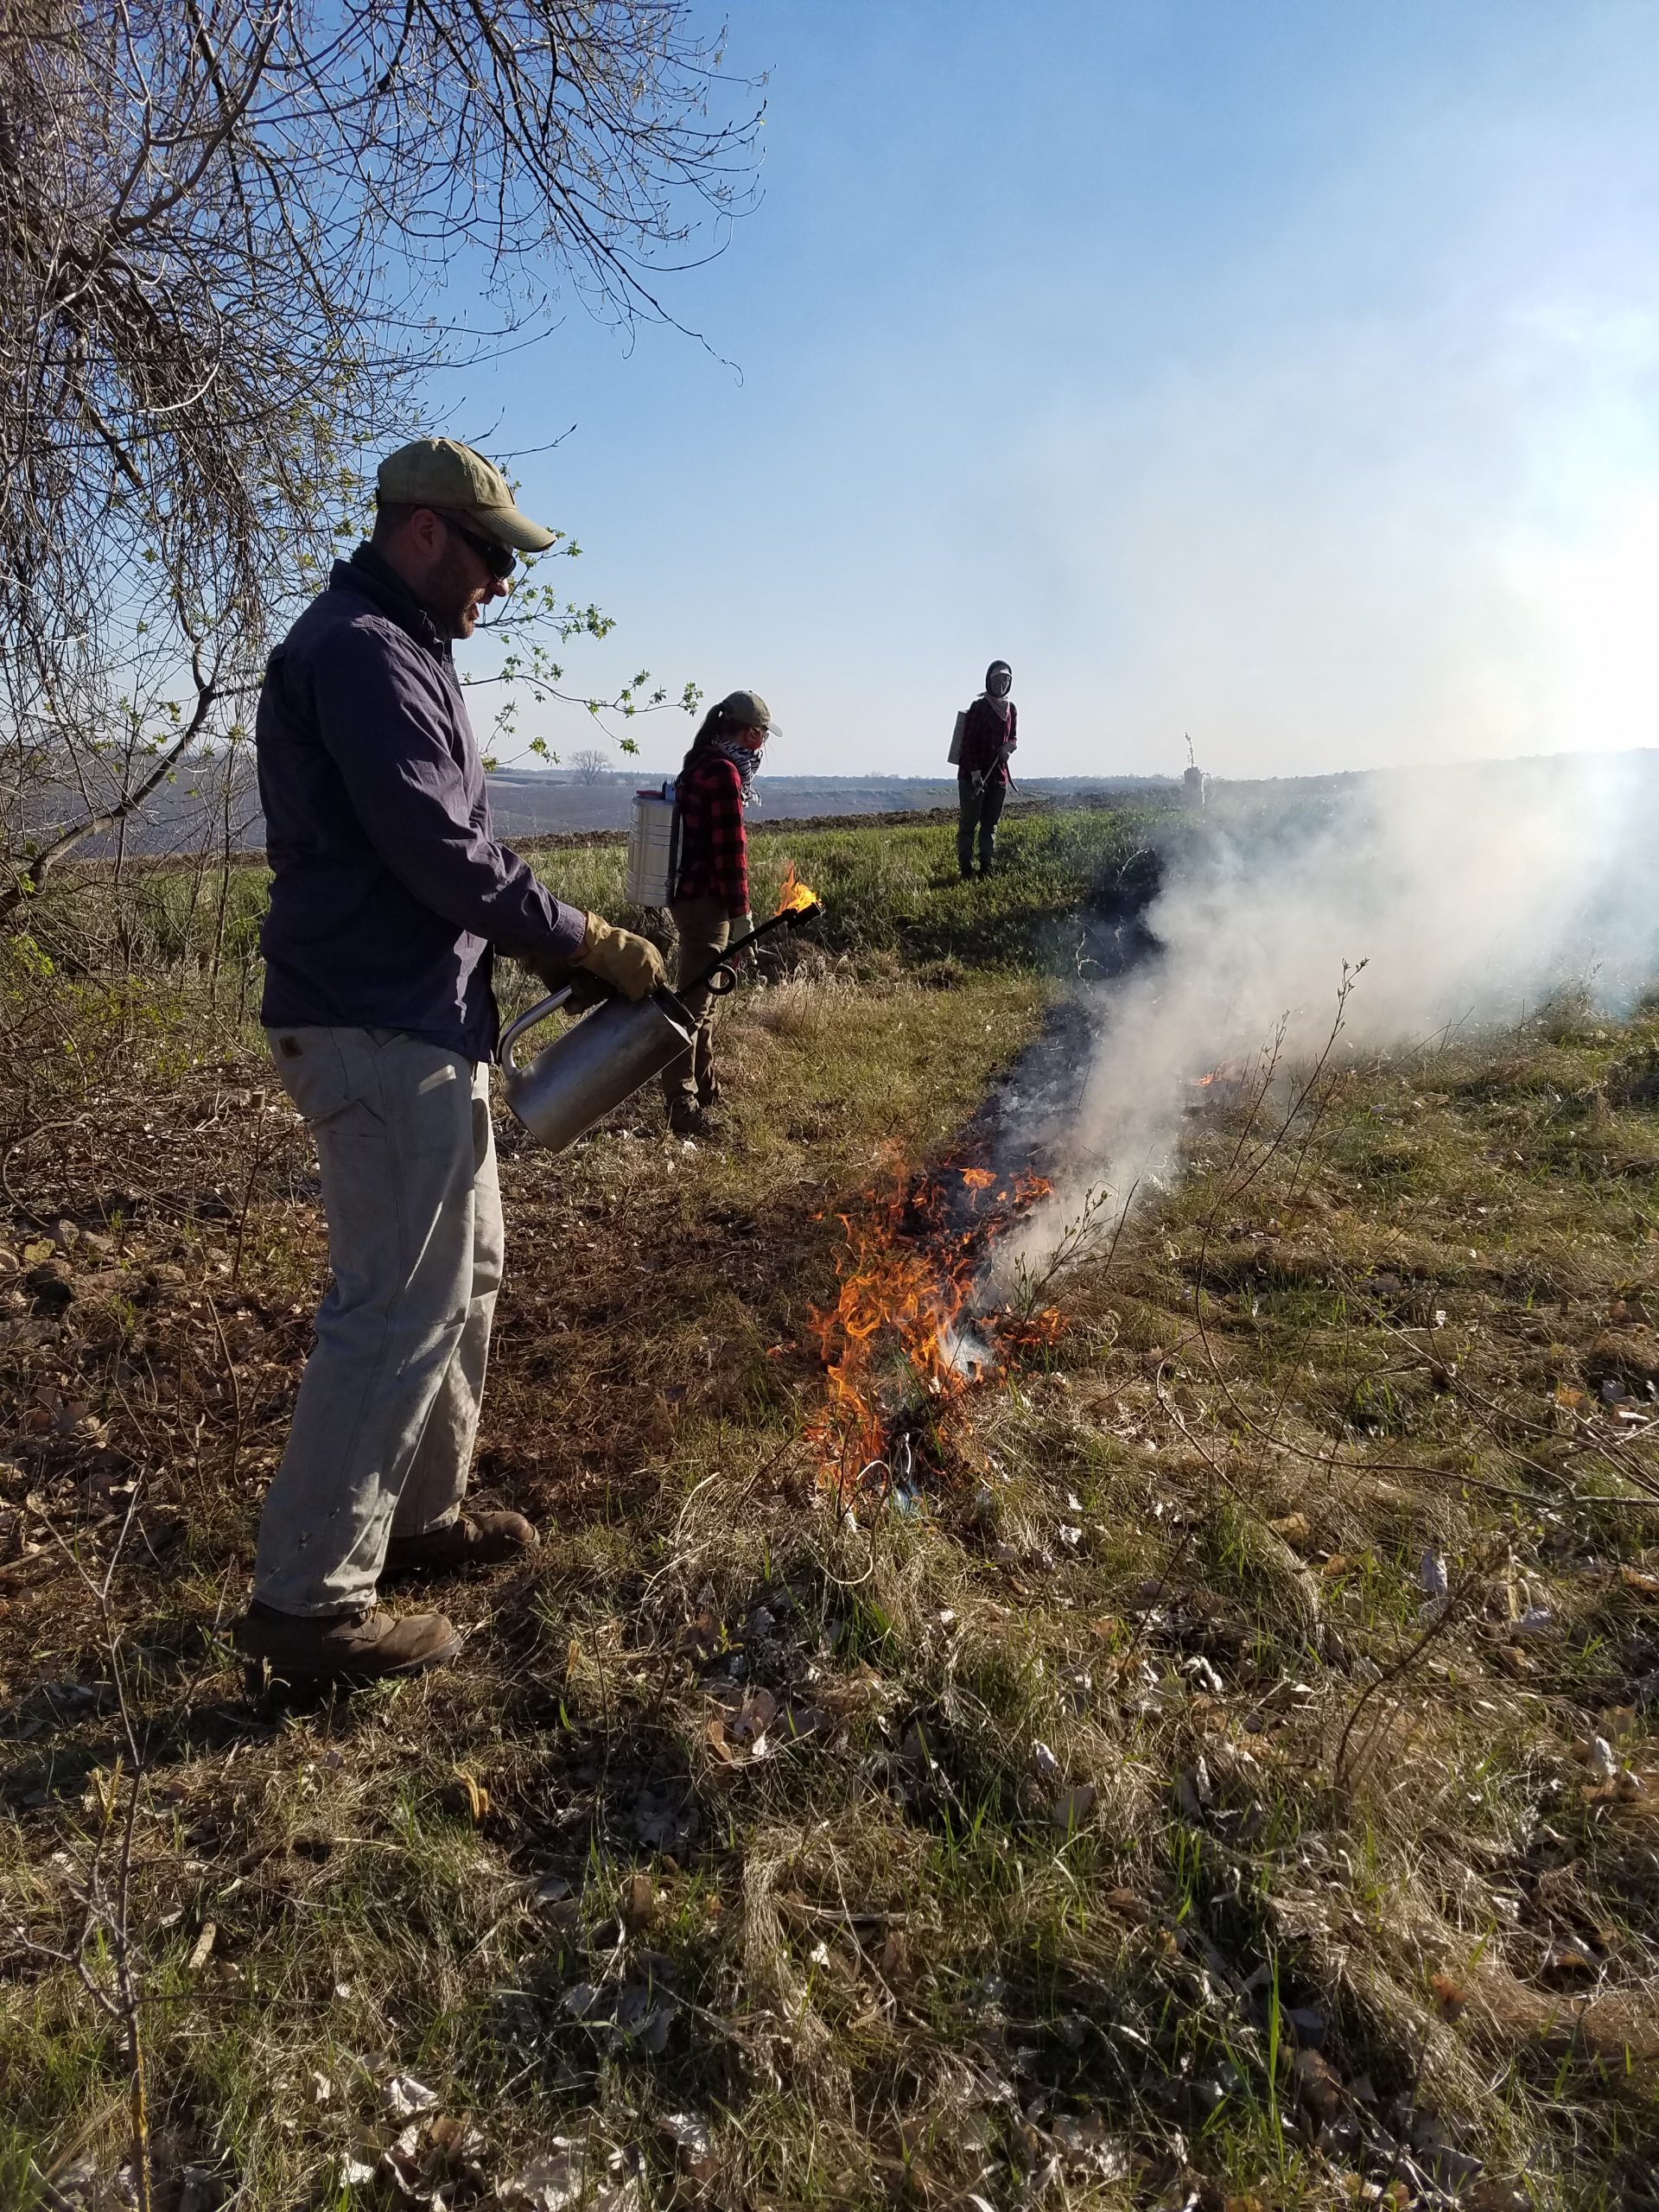
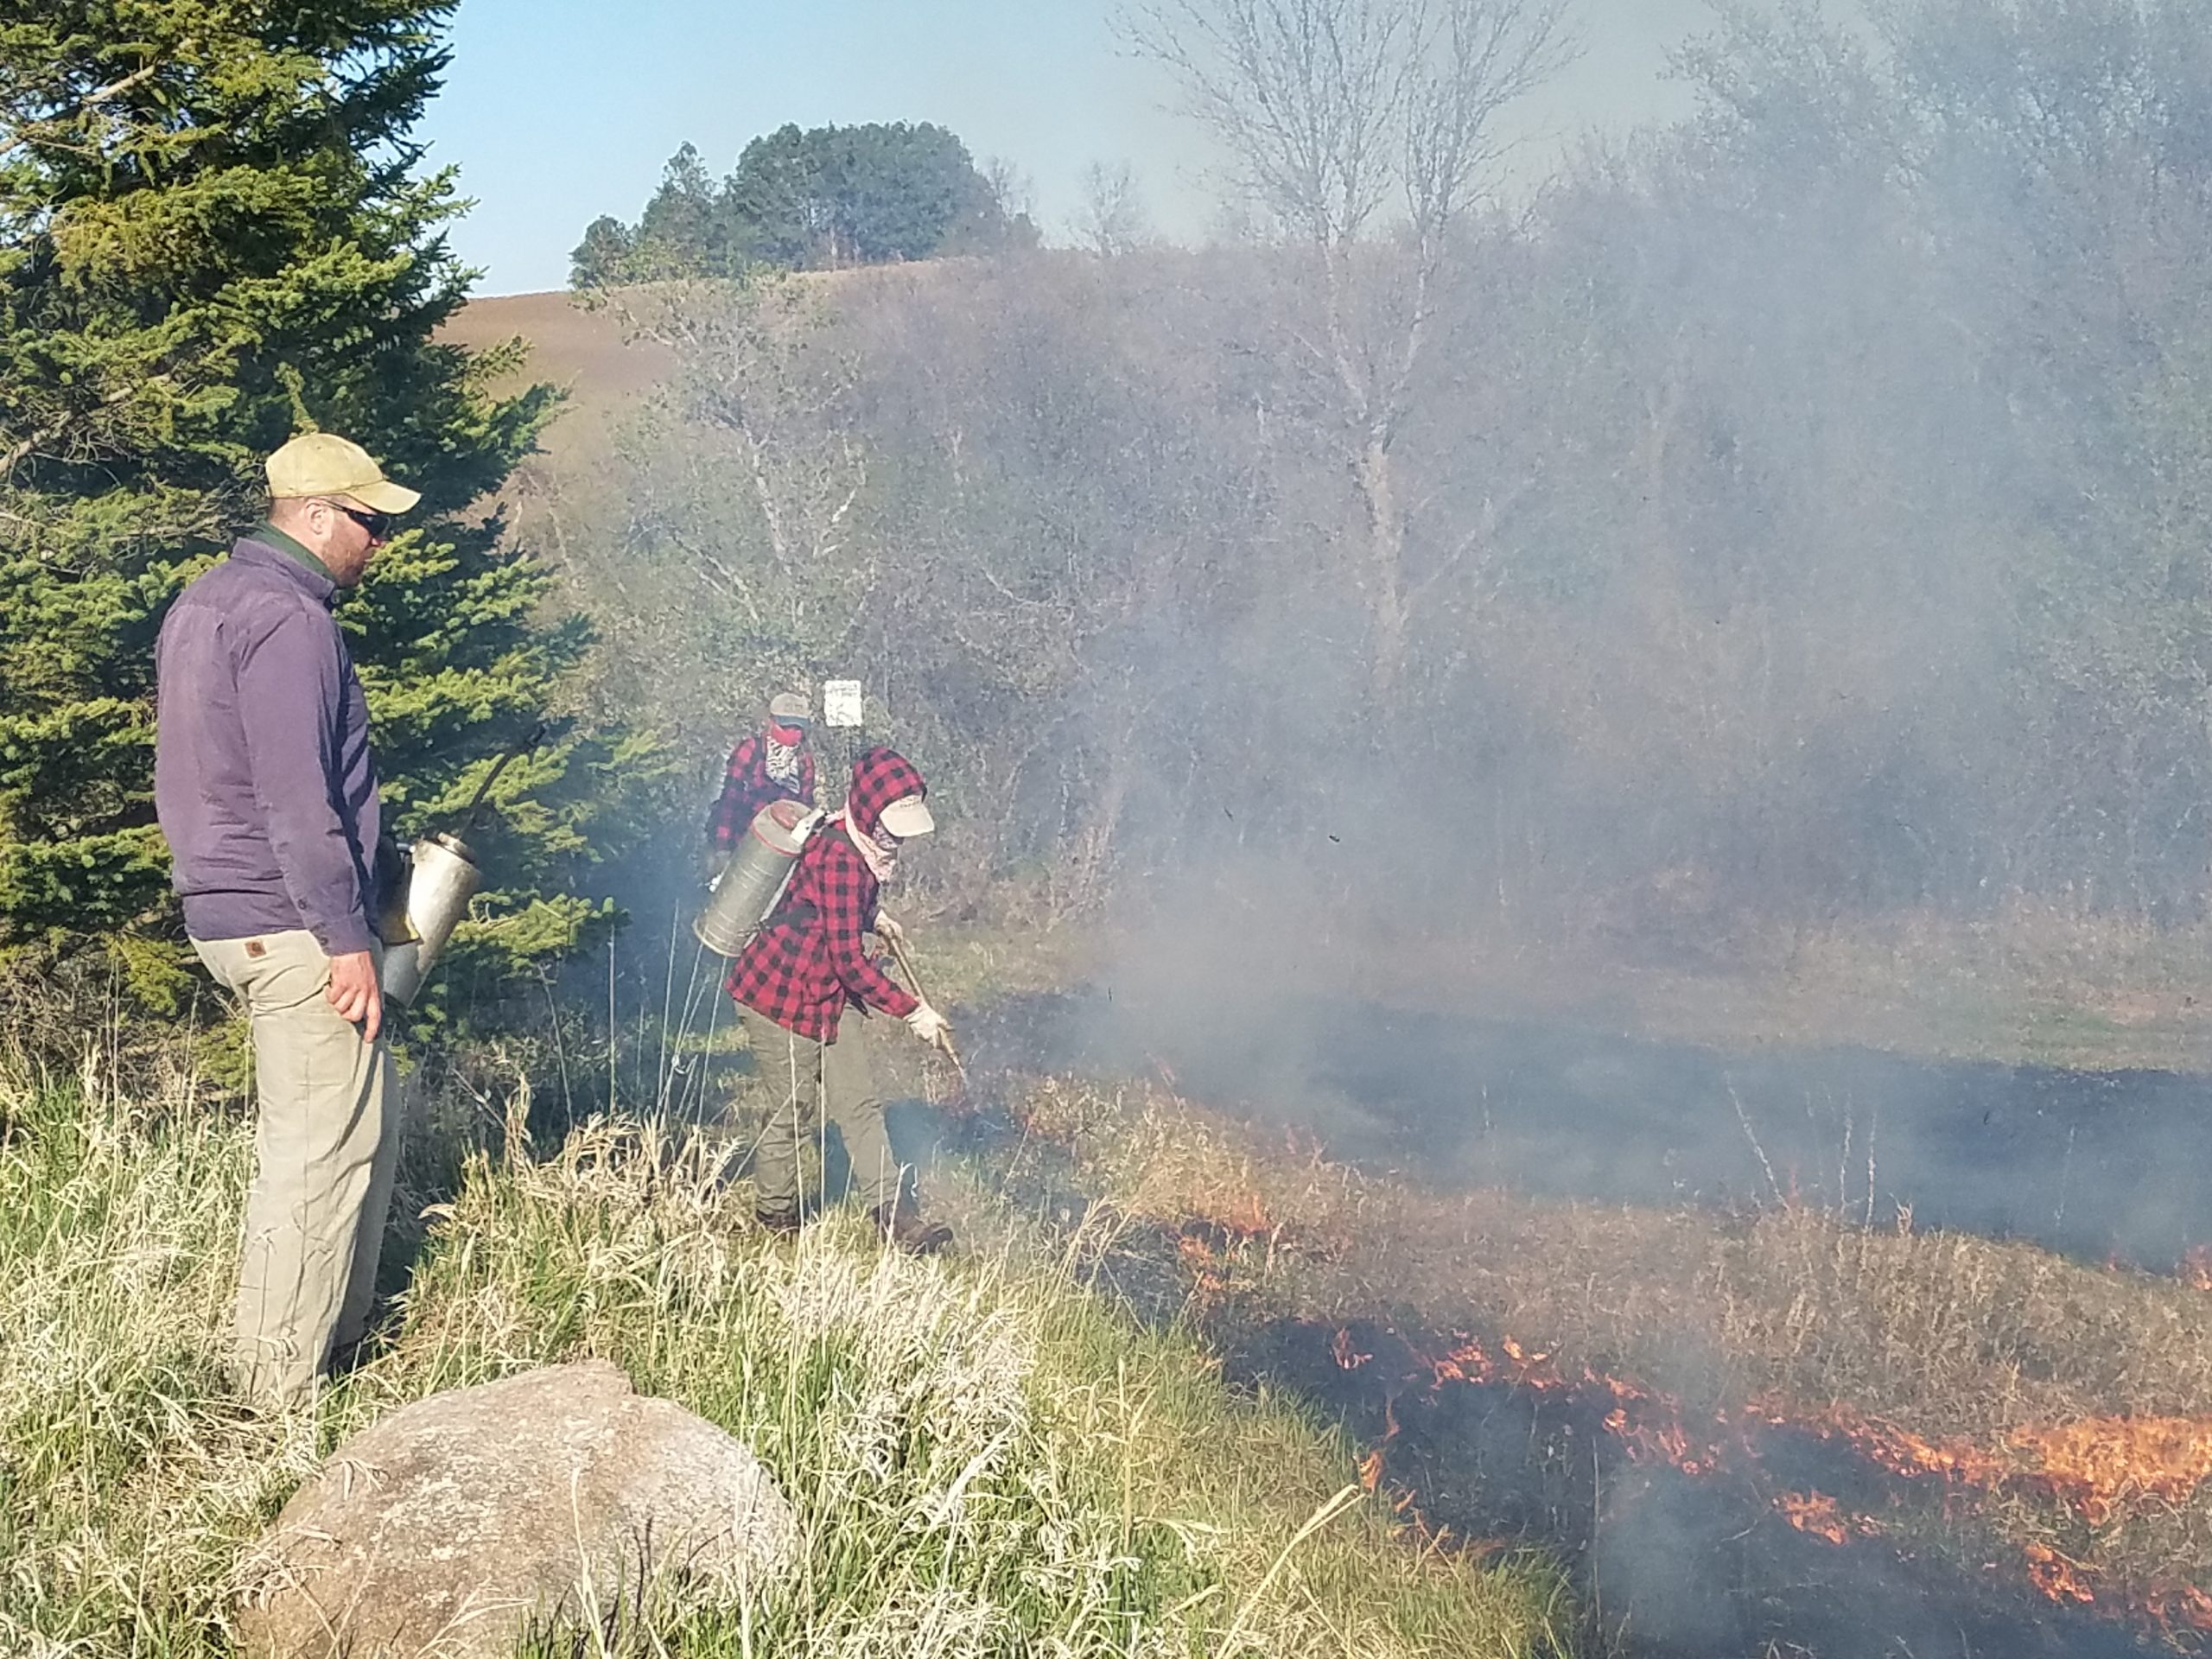
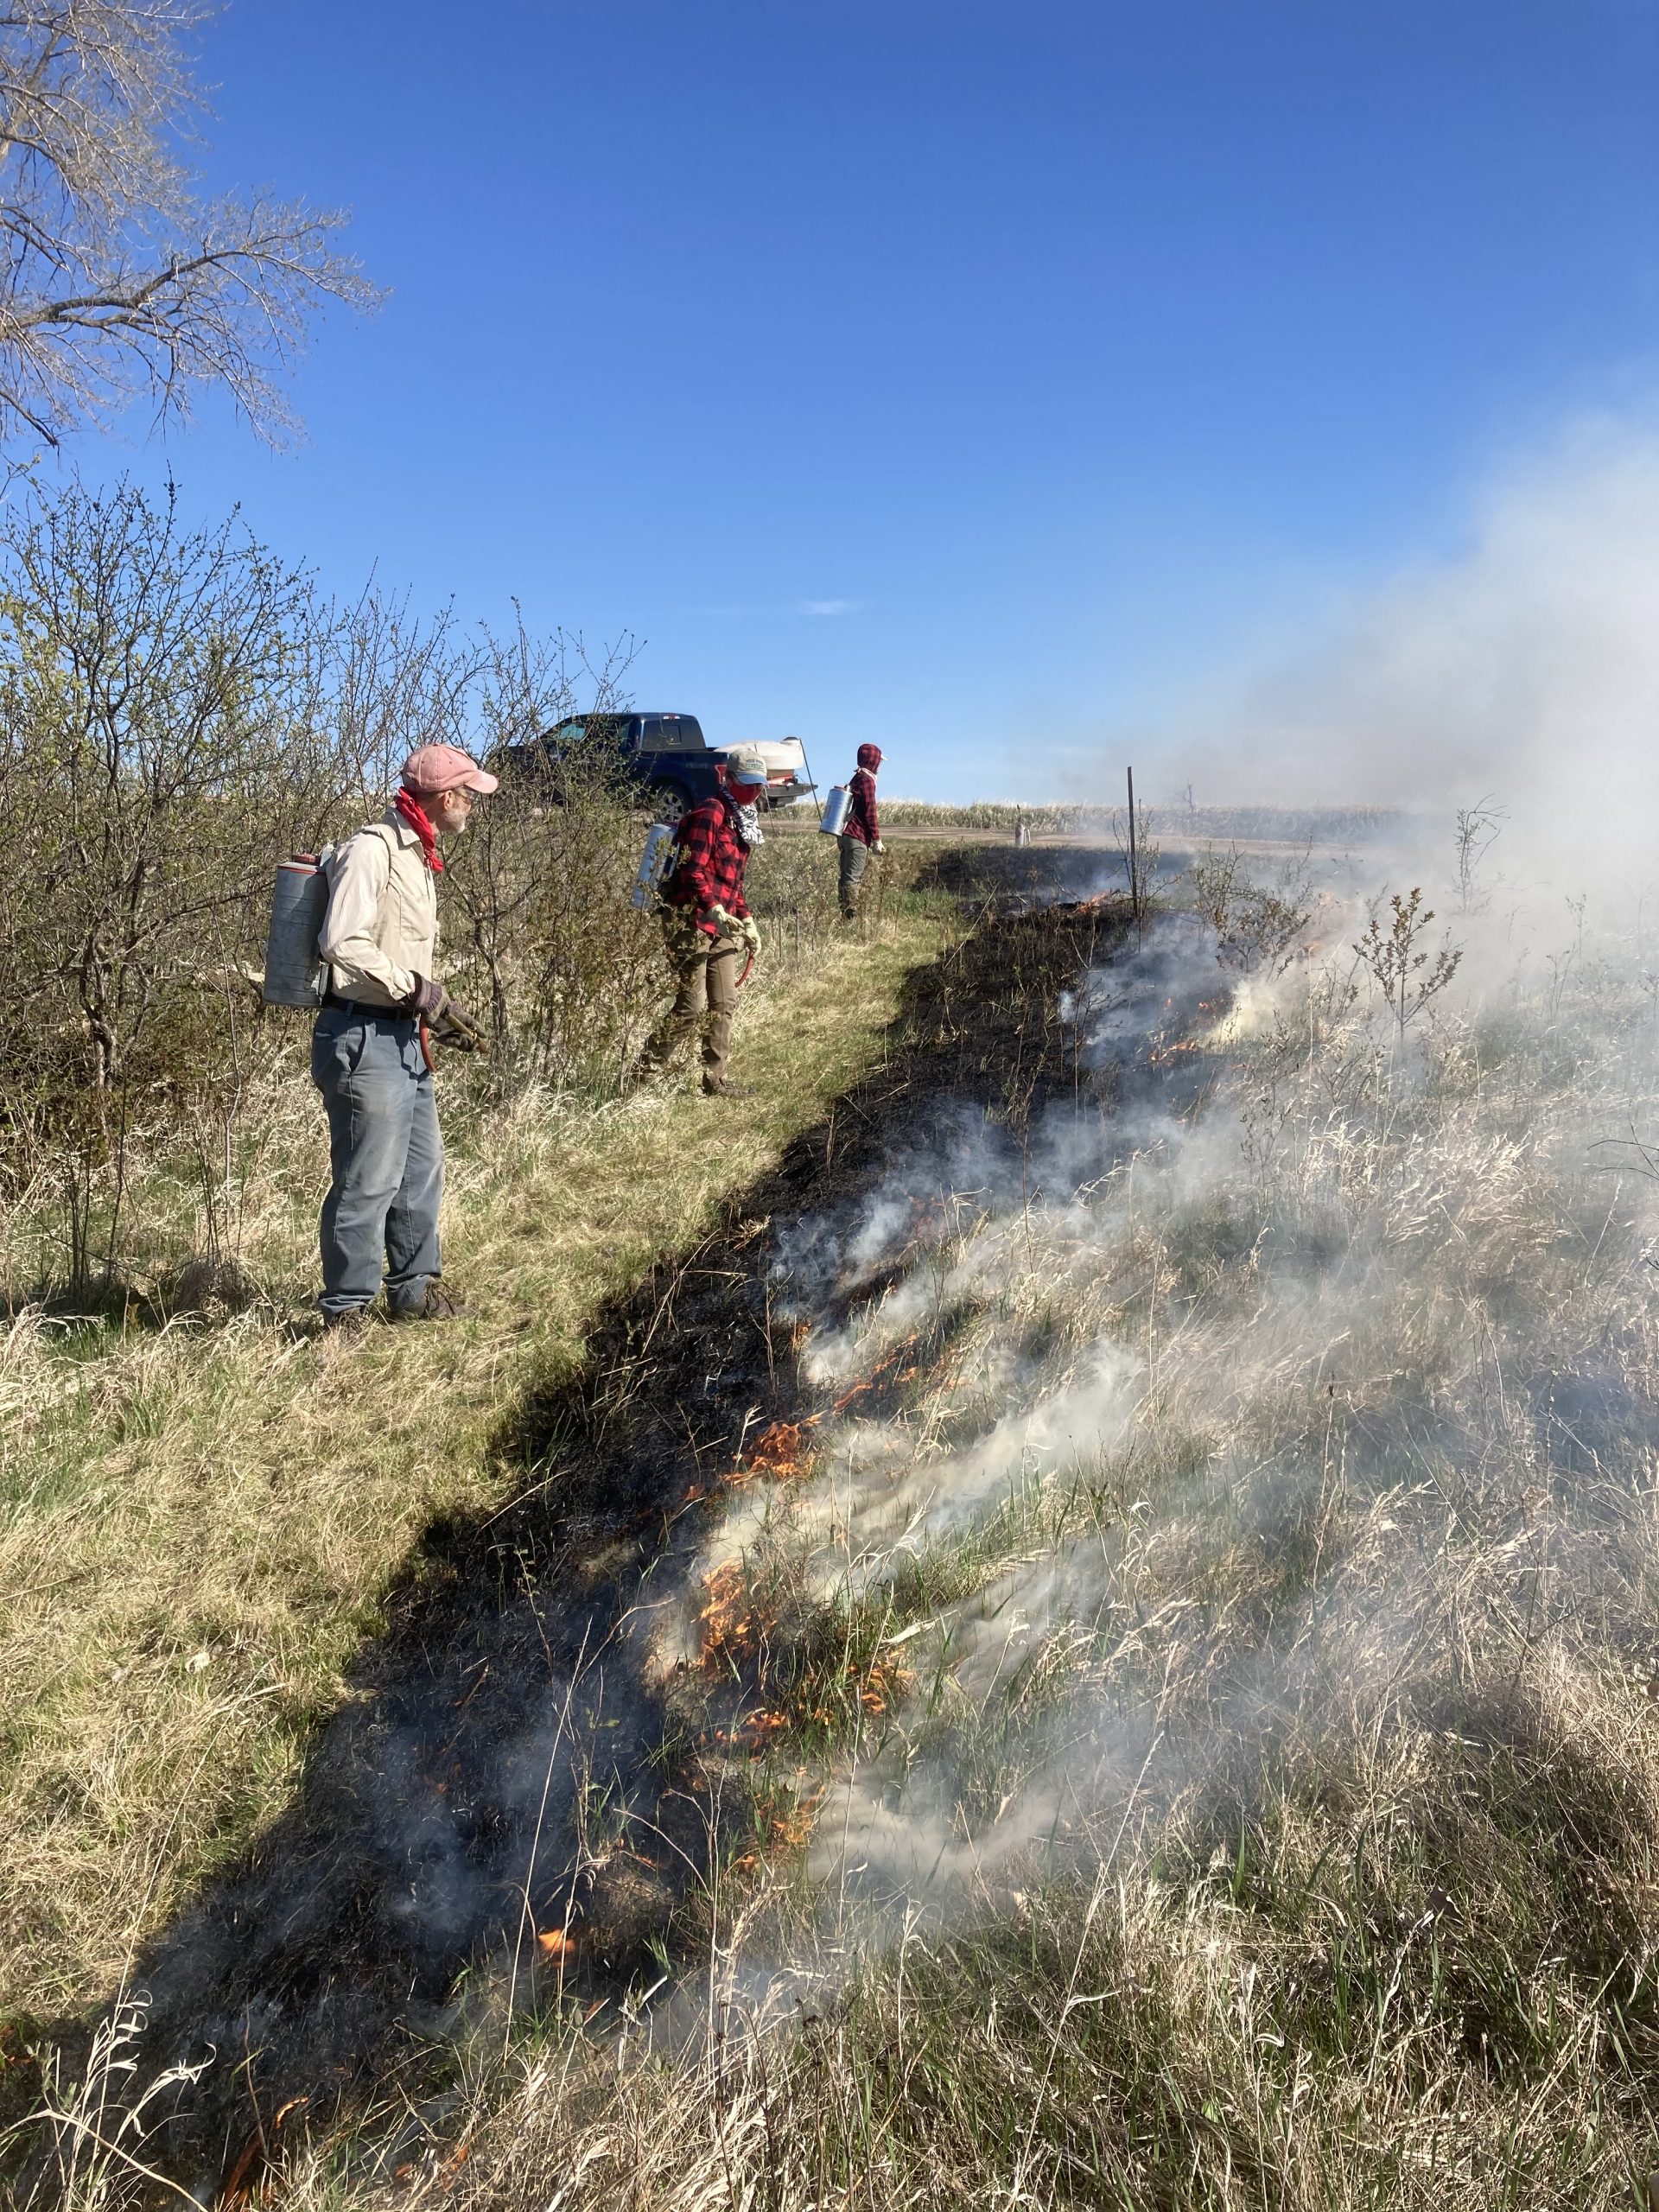
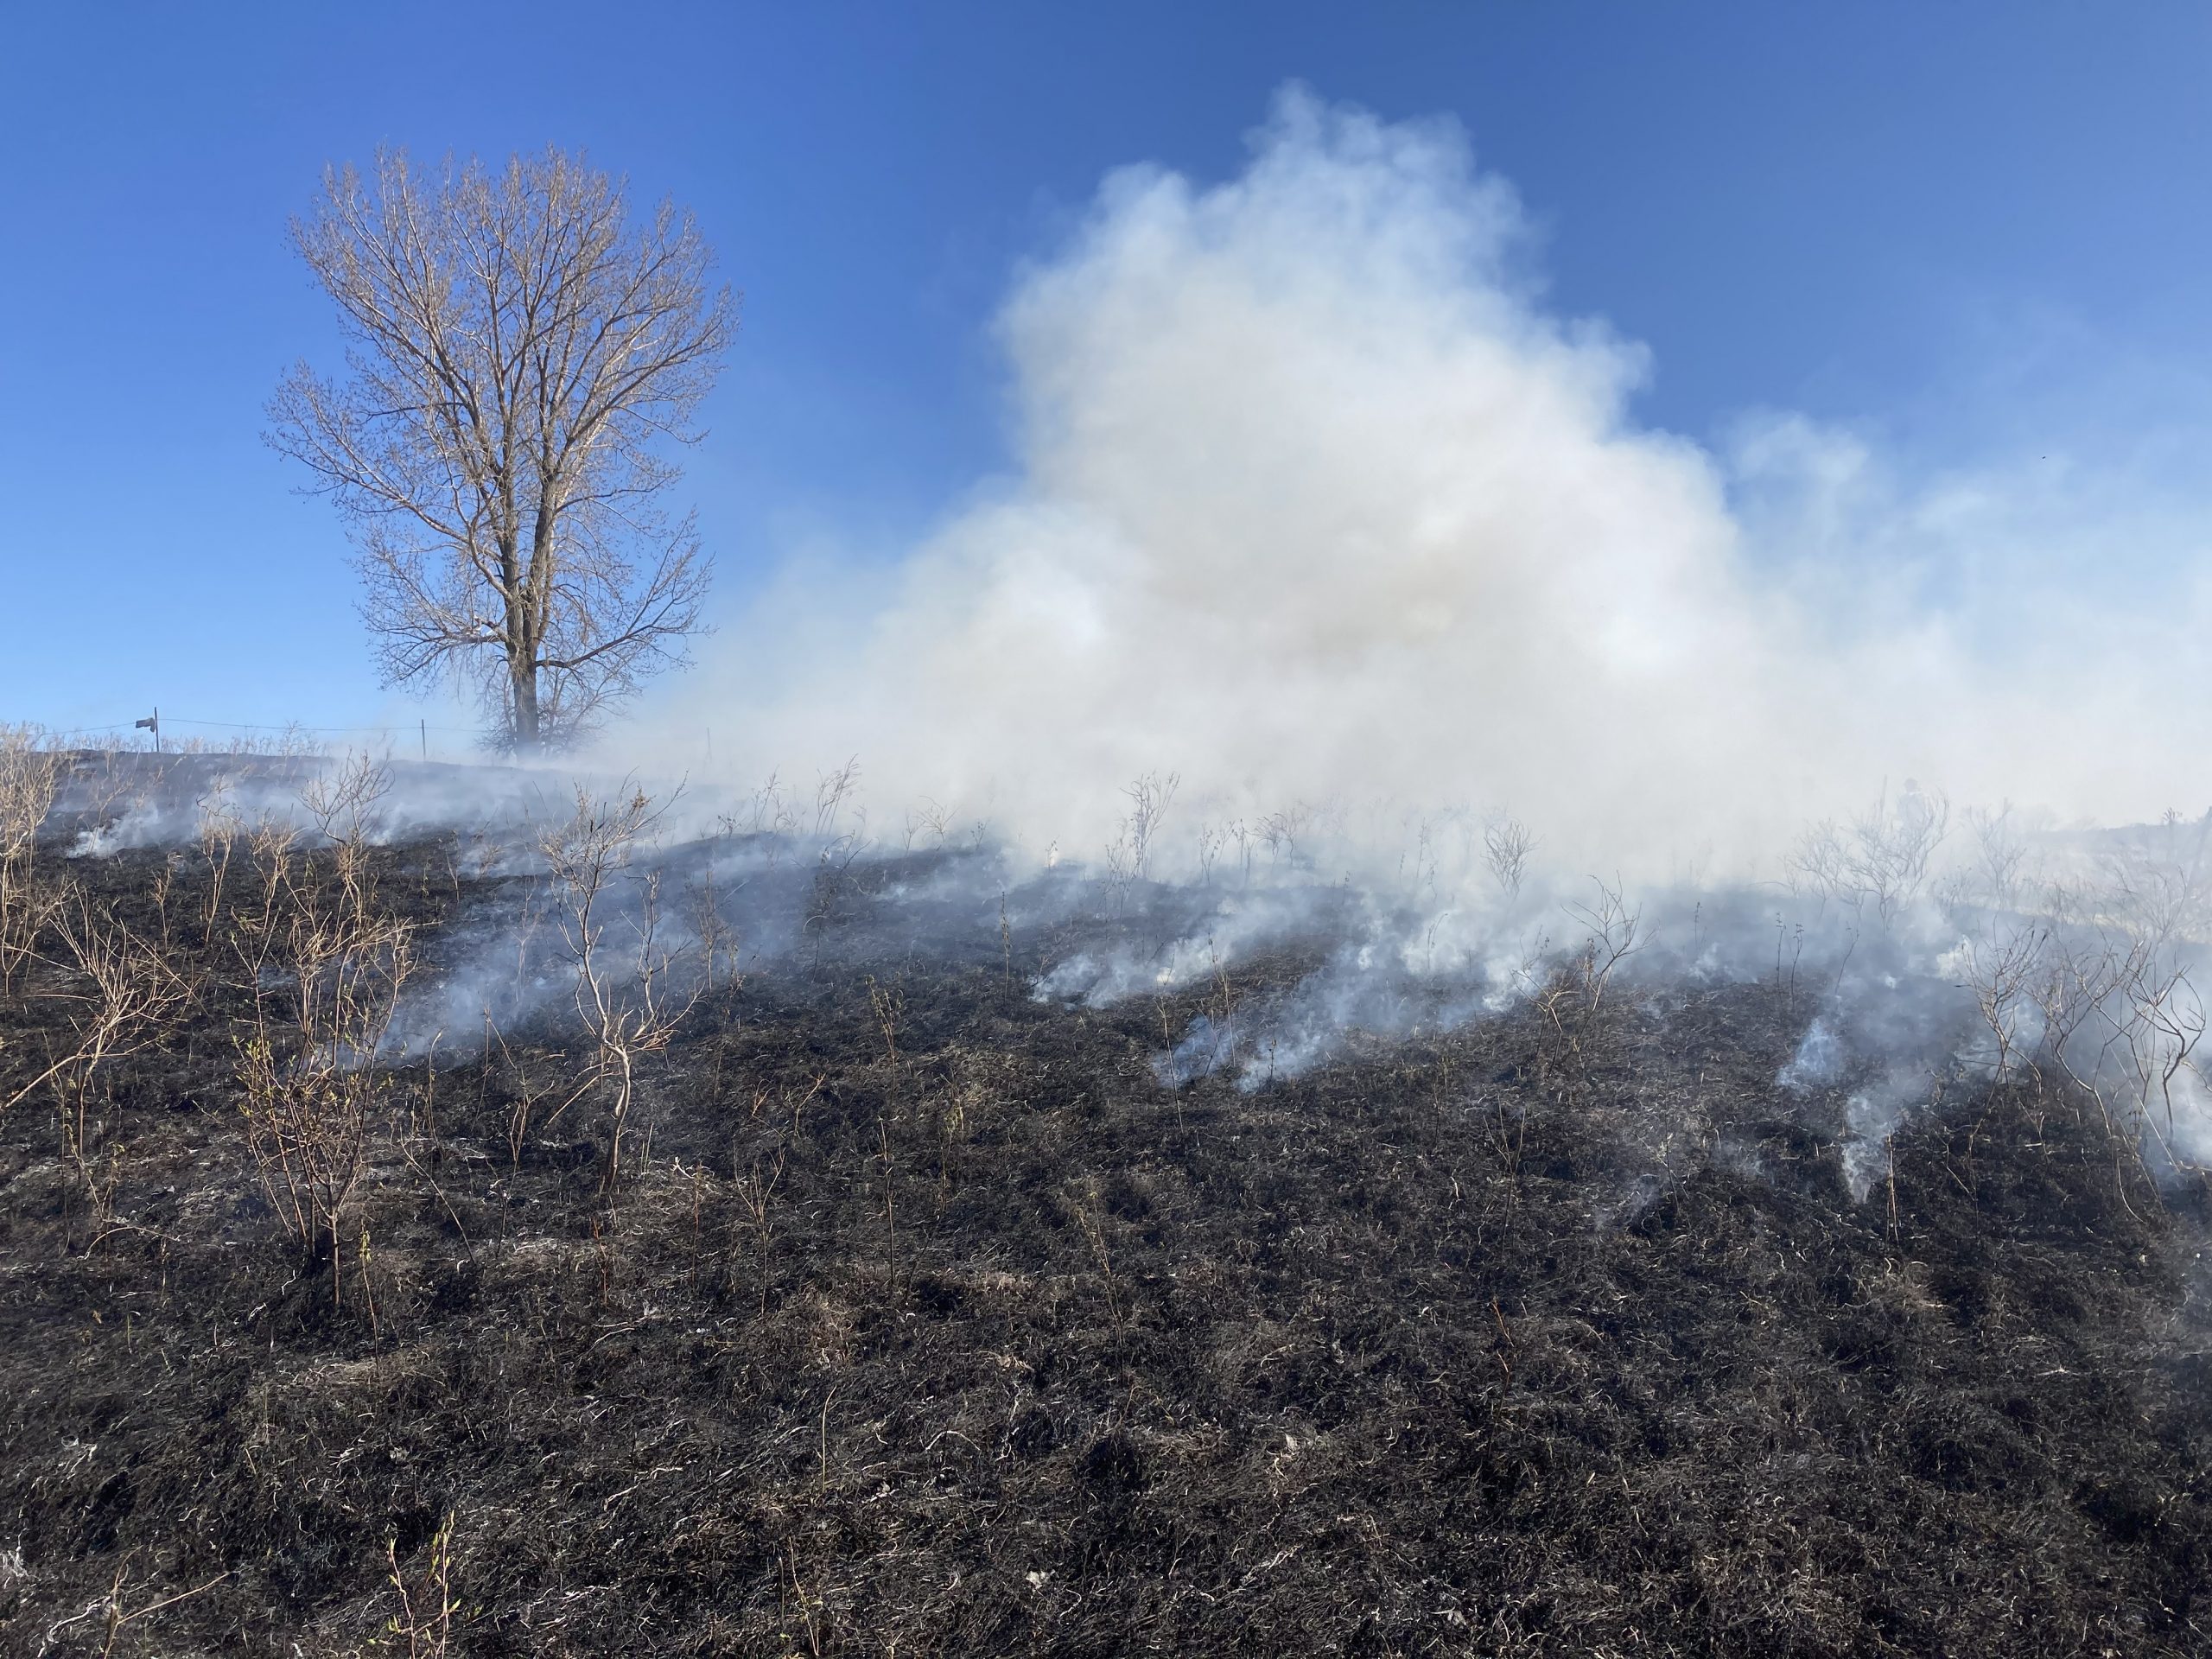
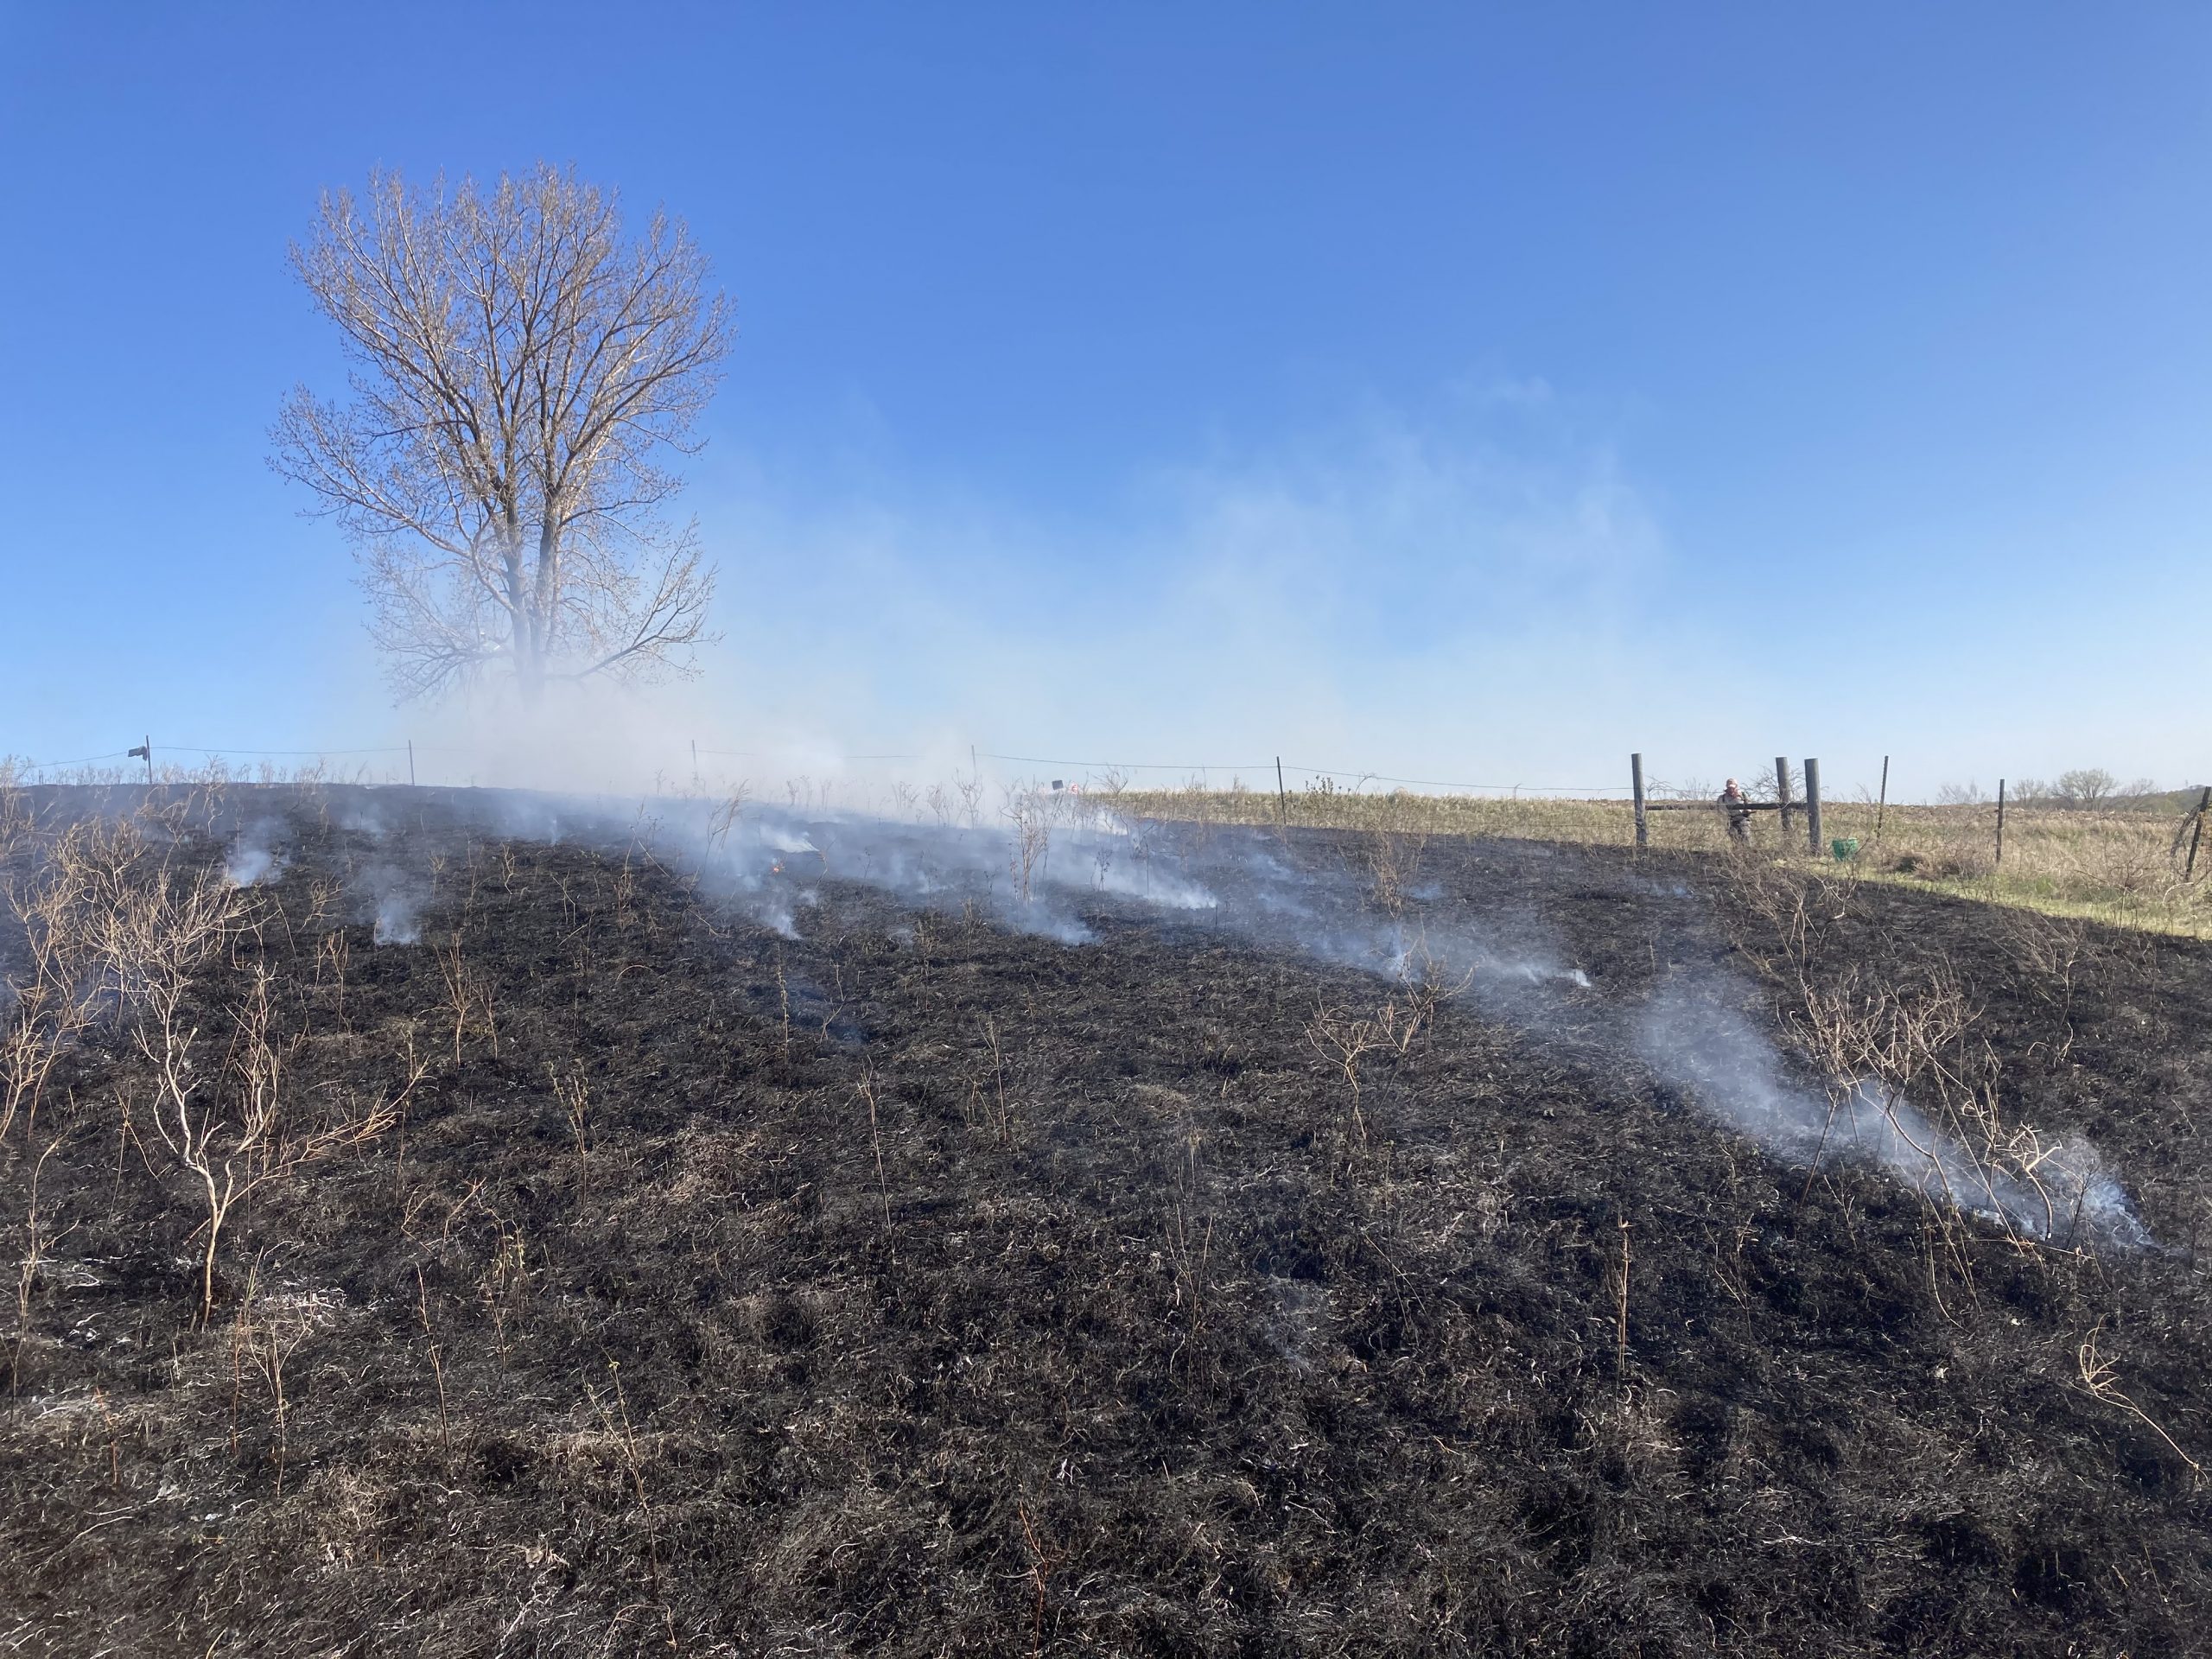
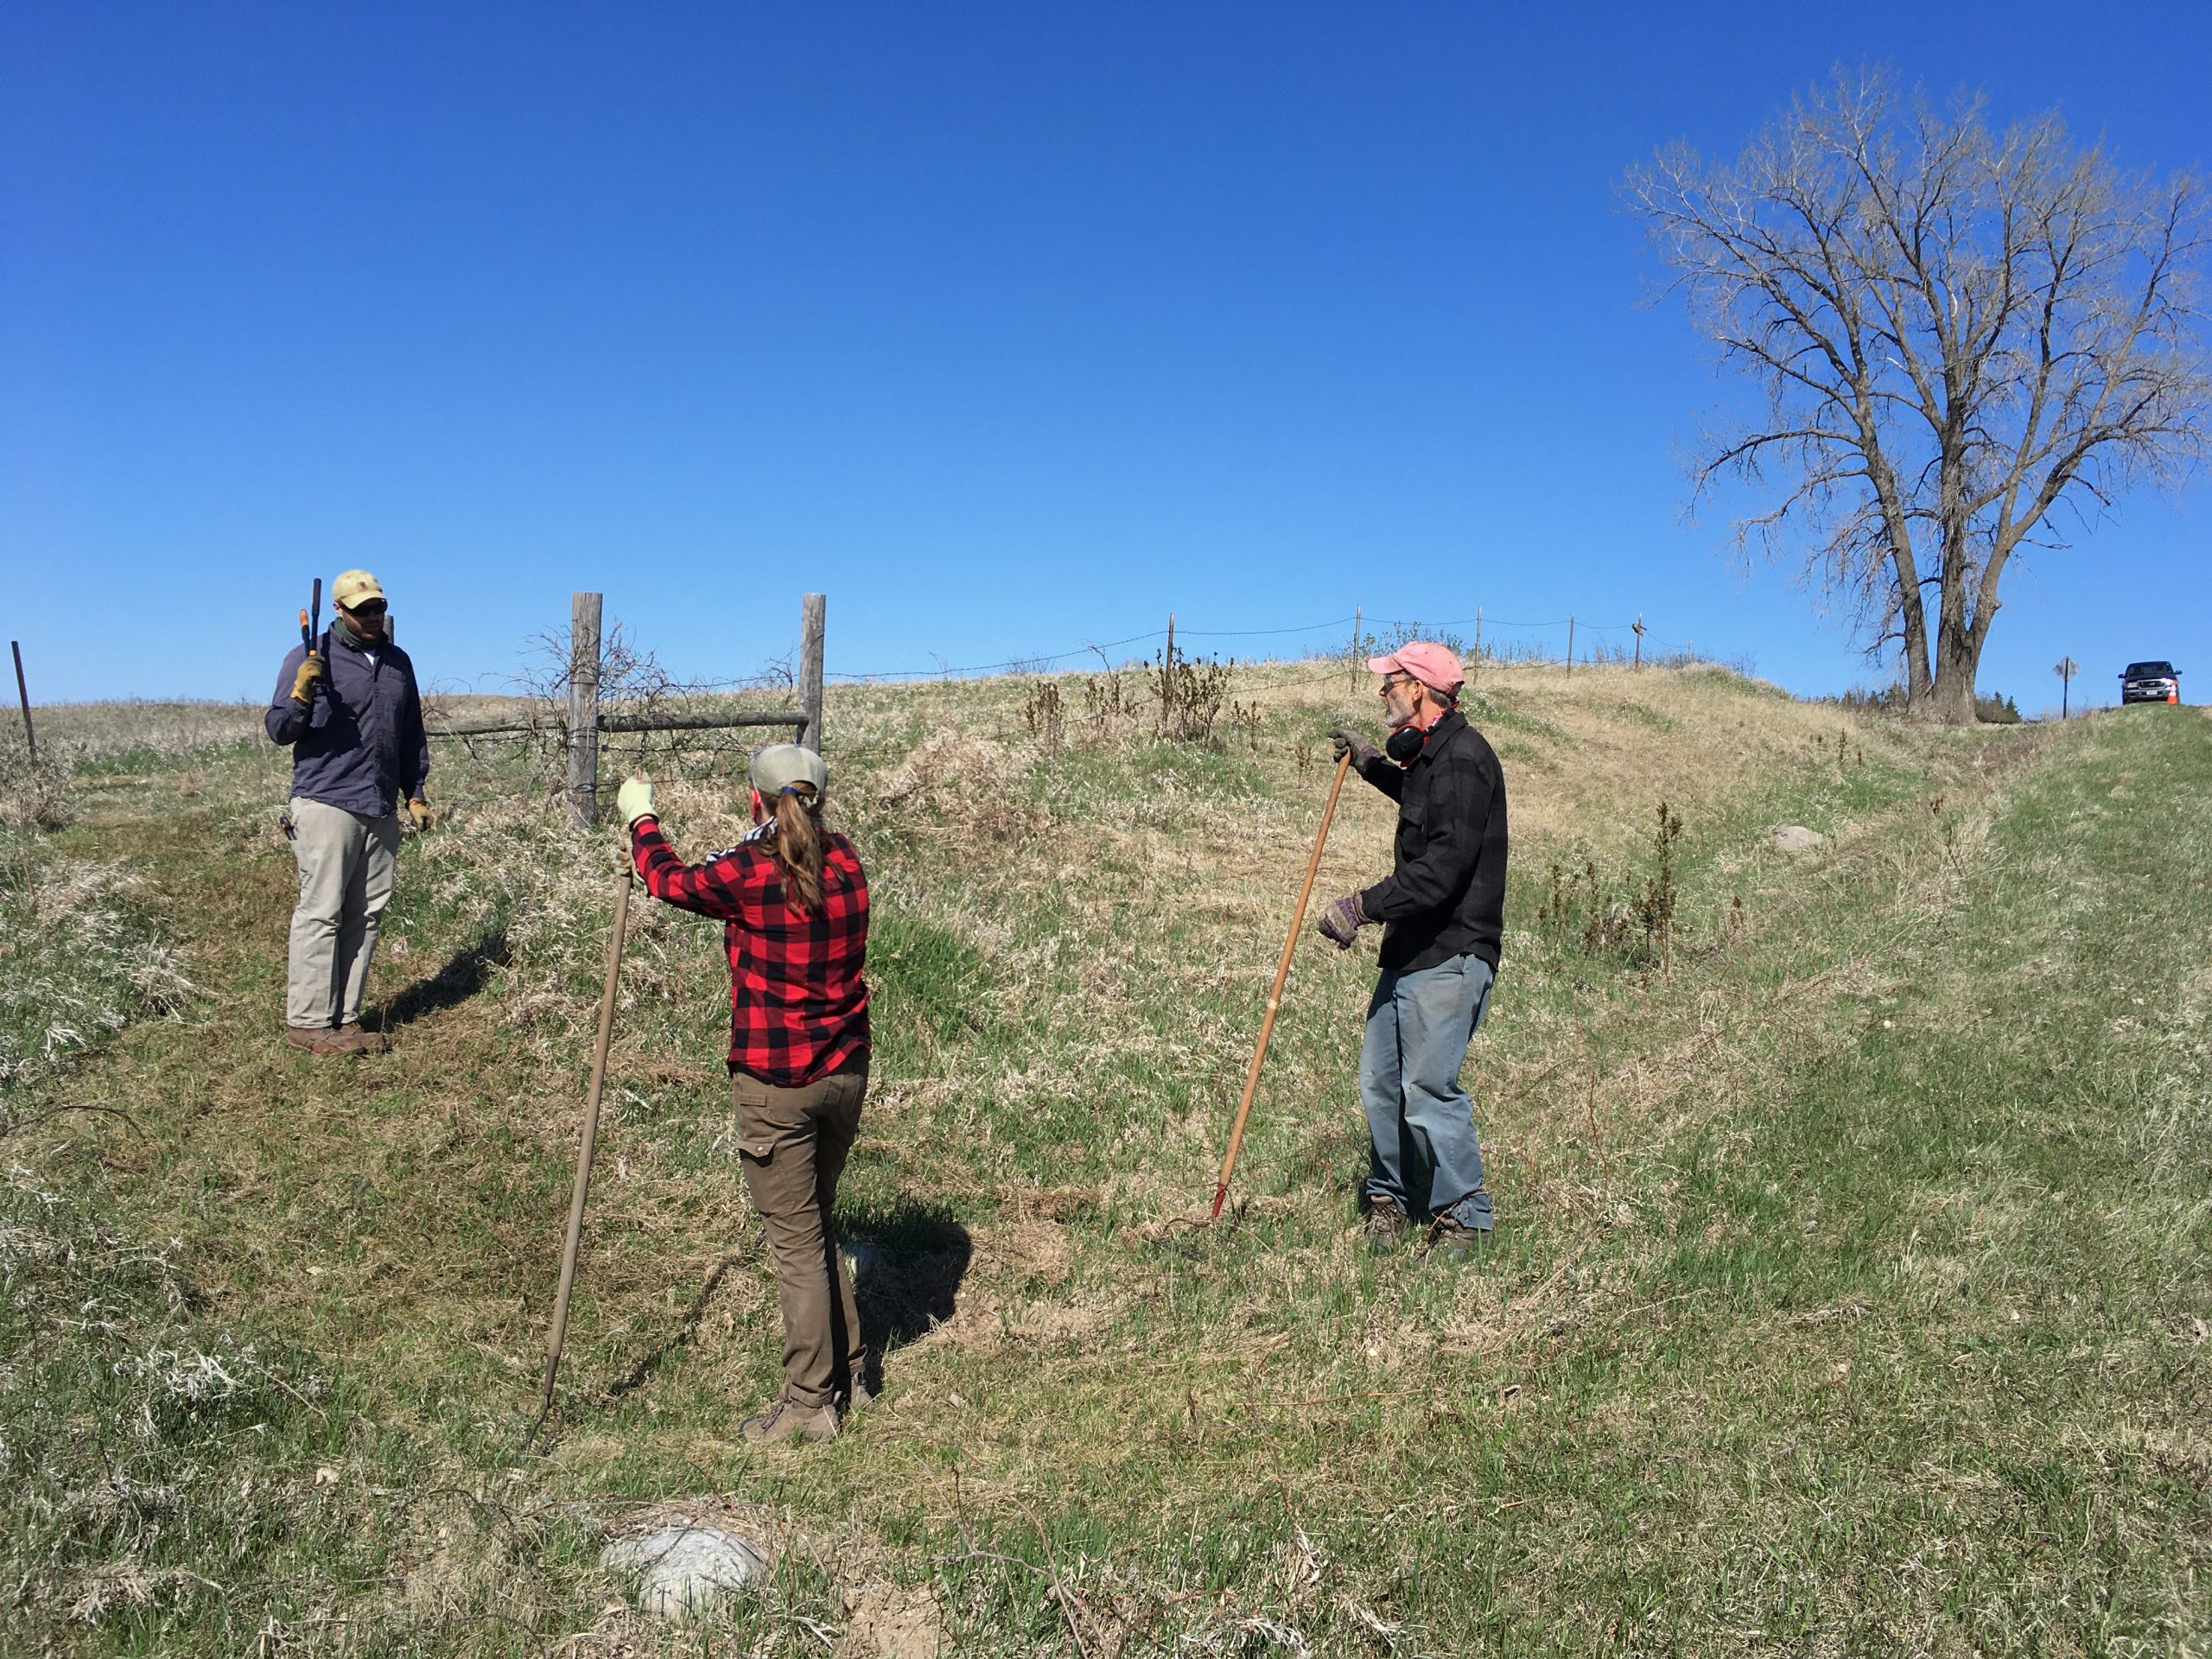
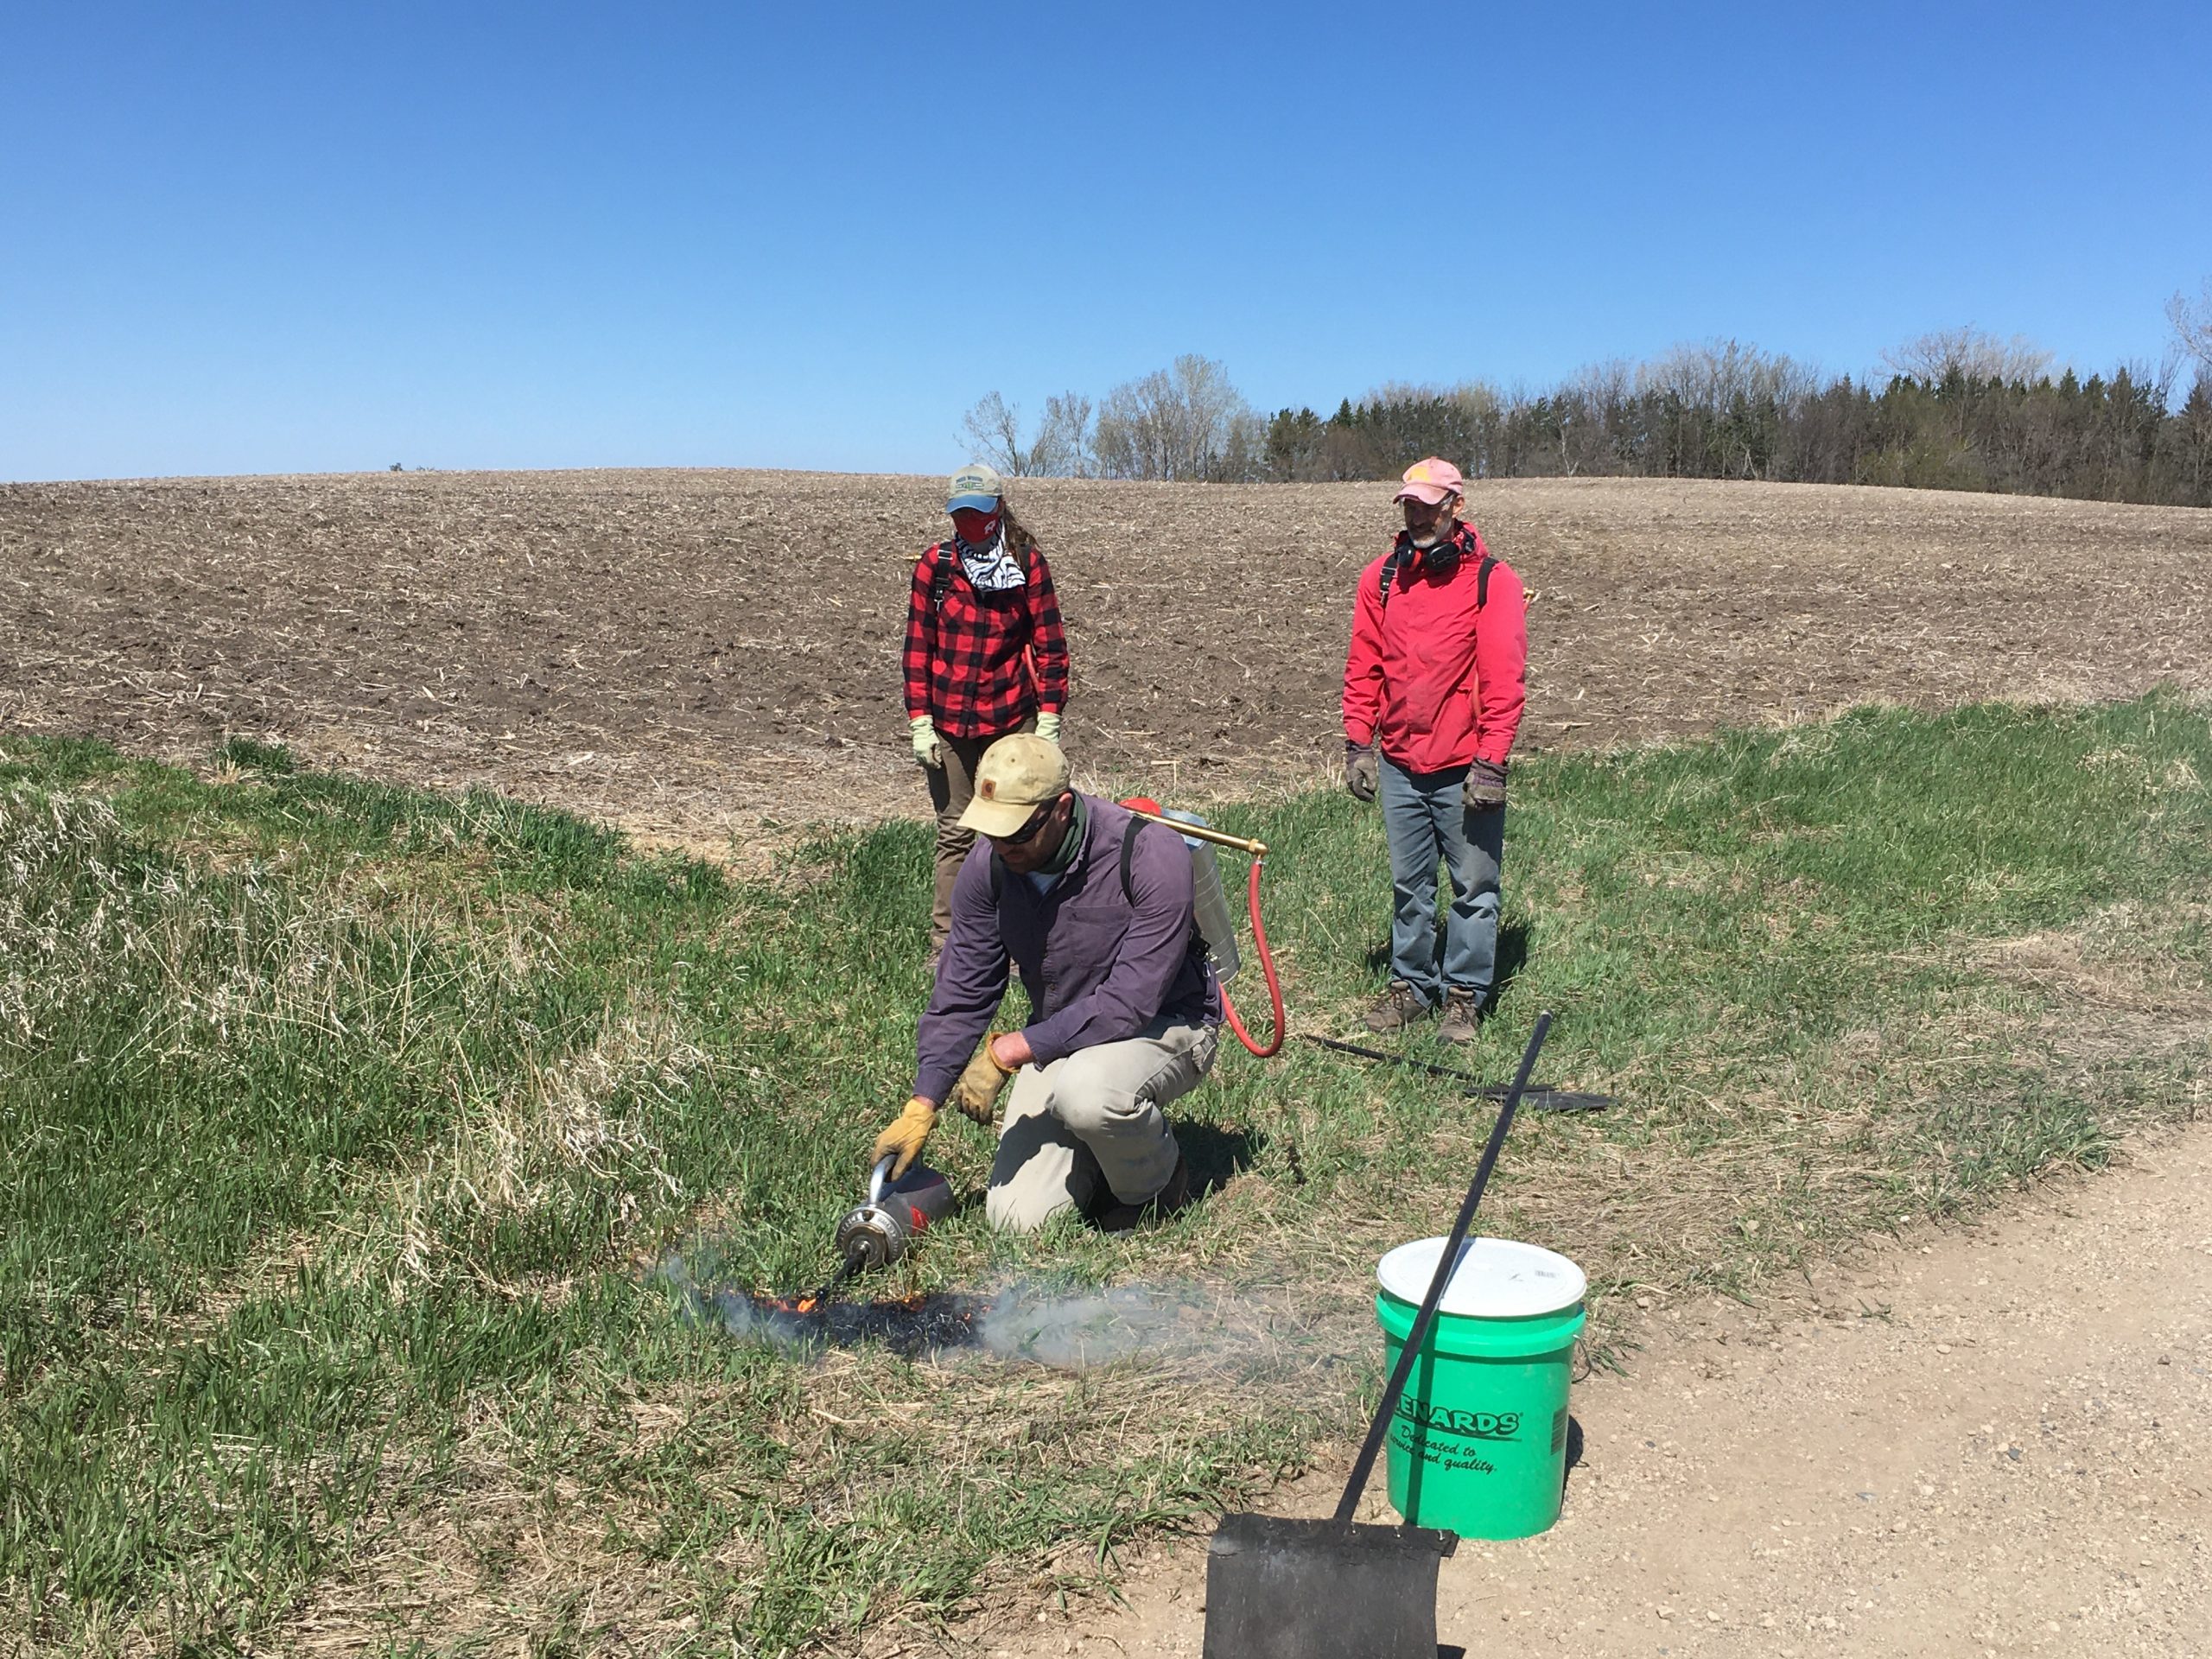
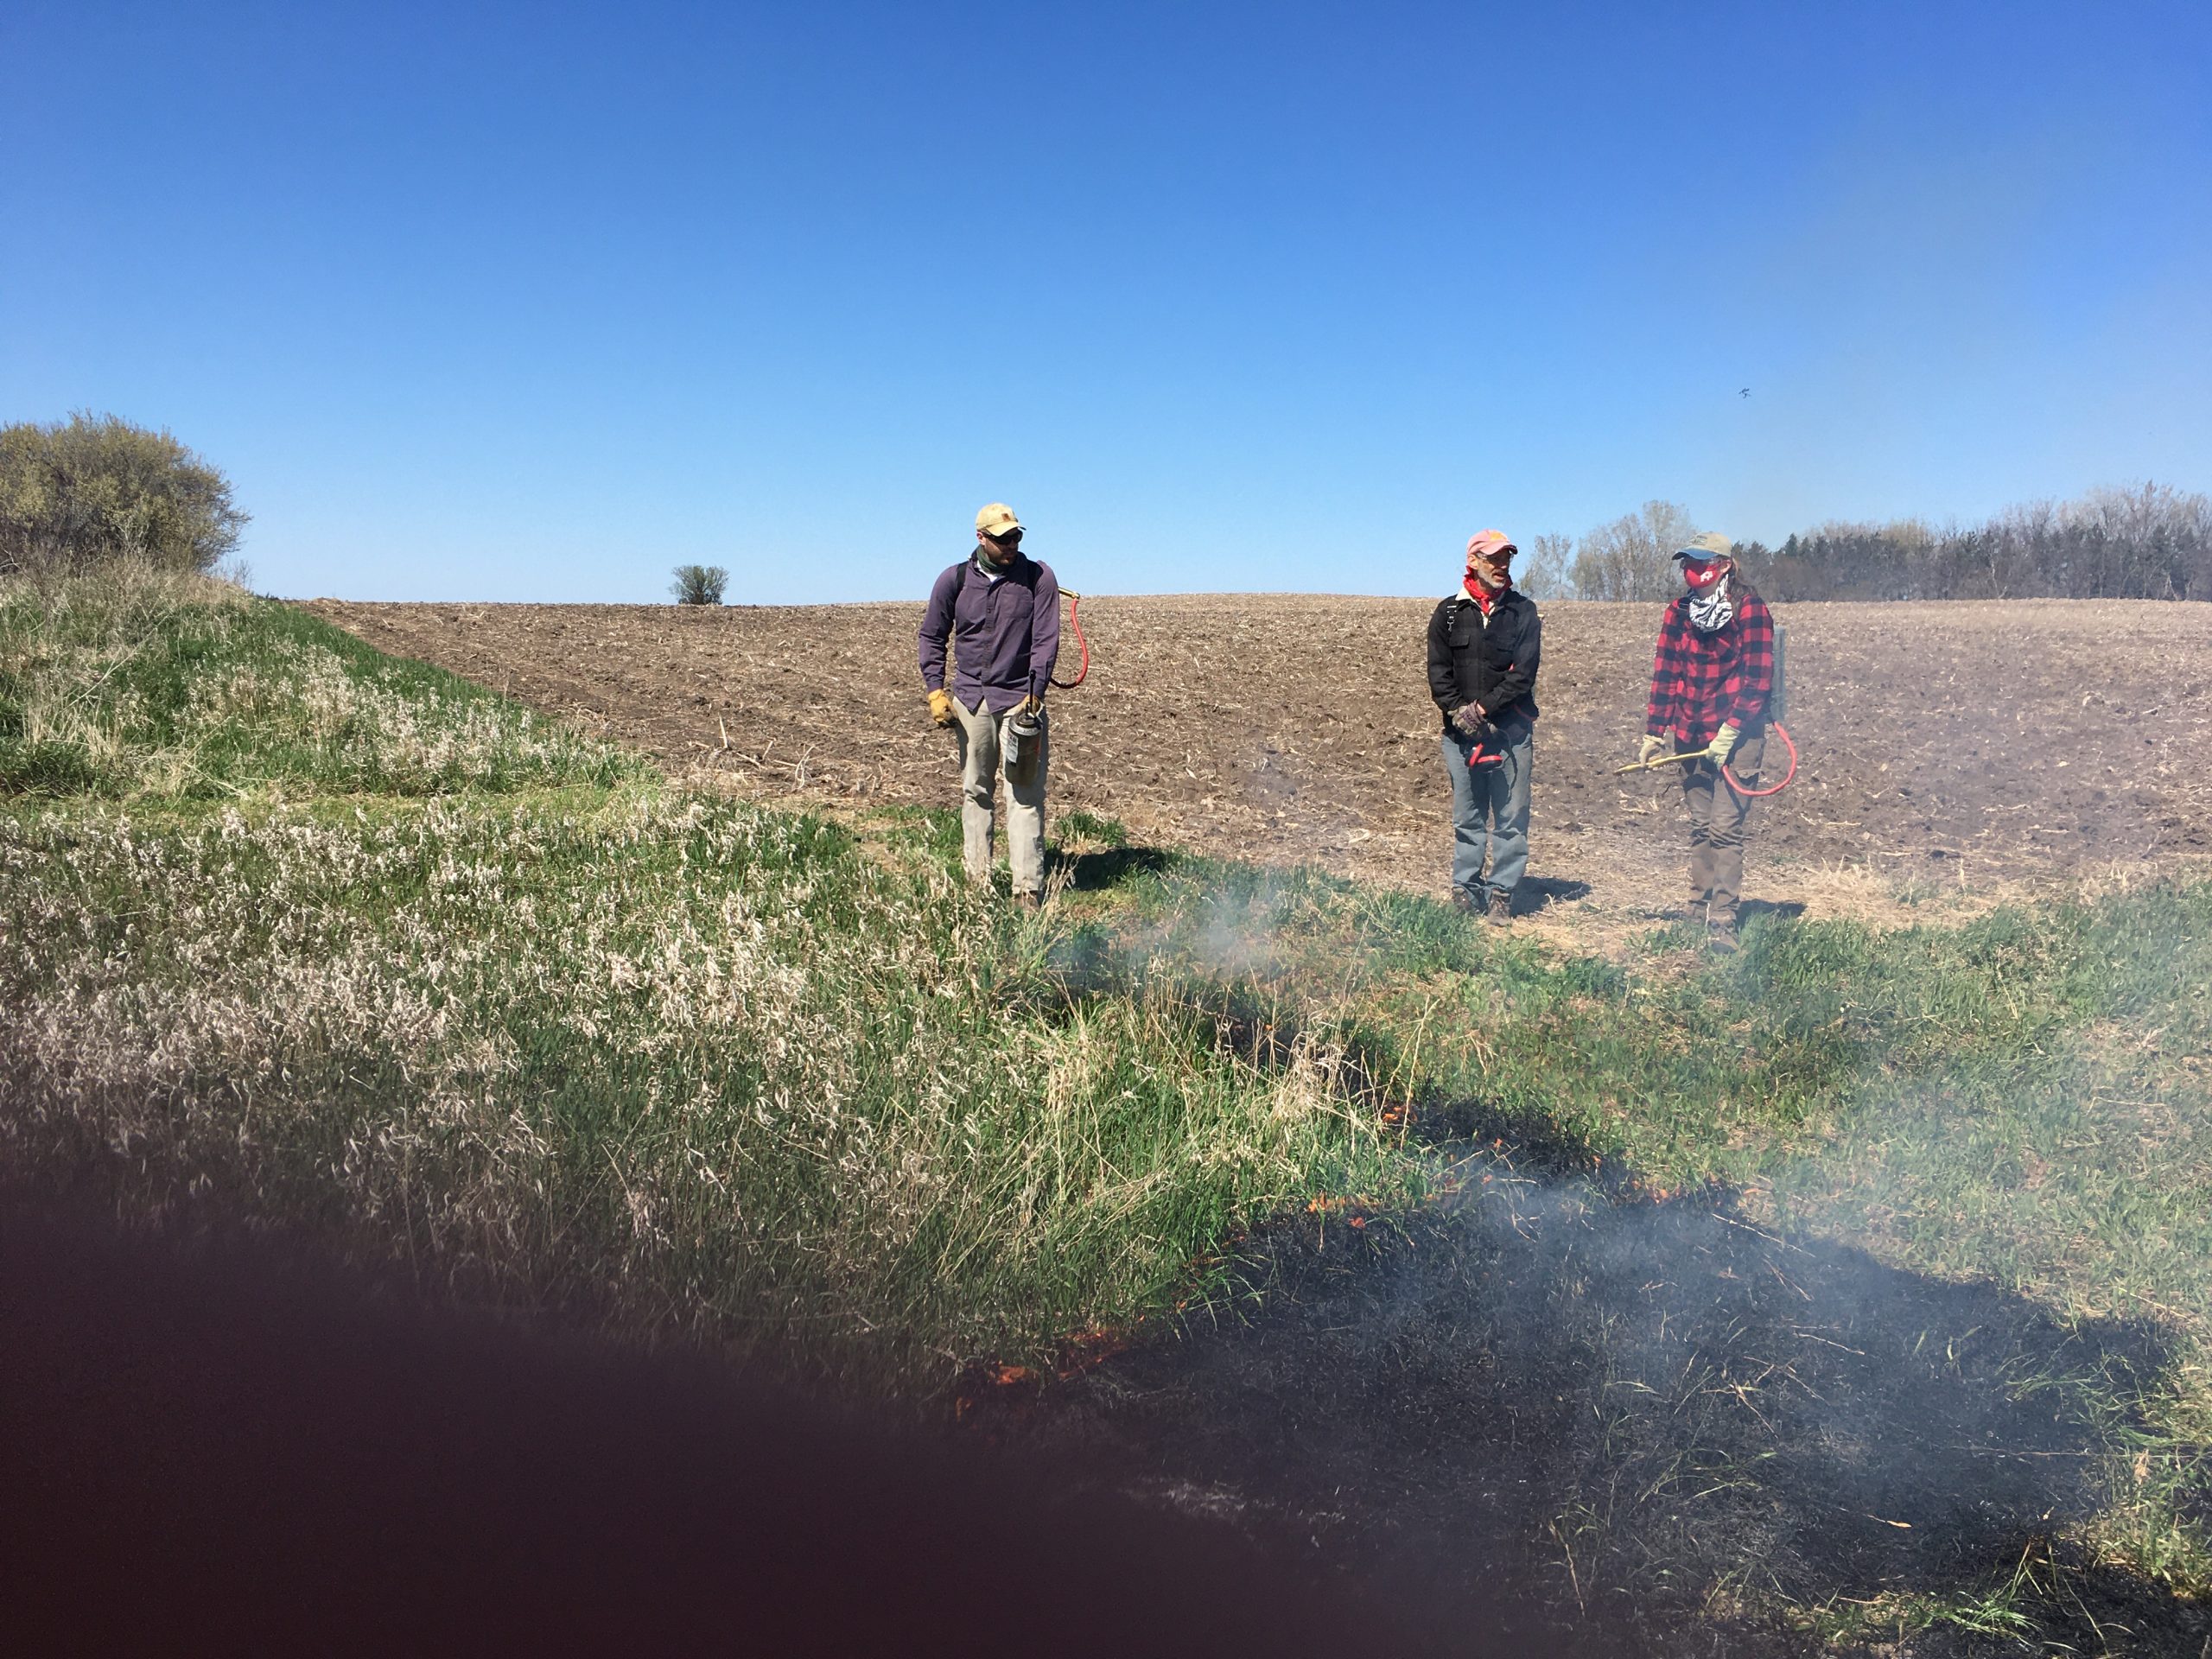
After a week of predominantly north winds, the weather gave us the south winds we needed to complete our remaining burns. We eyed Wednesday (May 12) for our most technically challenging burn of the season: landfill east. This gorgeous prairie hill is owned by Pope/Douglas Solid Waste Management. After meeting with Steve Vrchota (Executive Director of PDSWM) and several staff members to talk about our goals and logistics, Steve gave us permission to conduct a prescribed burn. He also generously offered PDSWM personnel to help cut fire breaks and conduct the burn. On May 12, Stuart and I woke early to stage equipment and make other preparations for the prescribed burn. We decided to start this prescribed burn in the morning to begin before the relative humidity plummeted in the afternoon producing volatile and potentially dangerous conditions for burning landfill east.
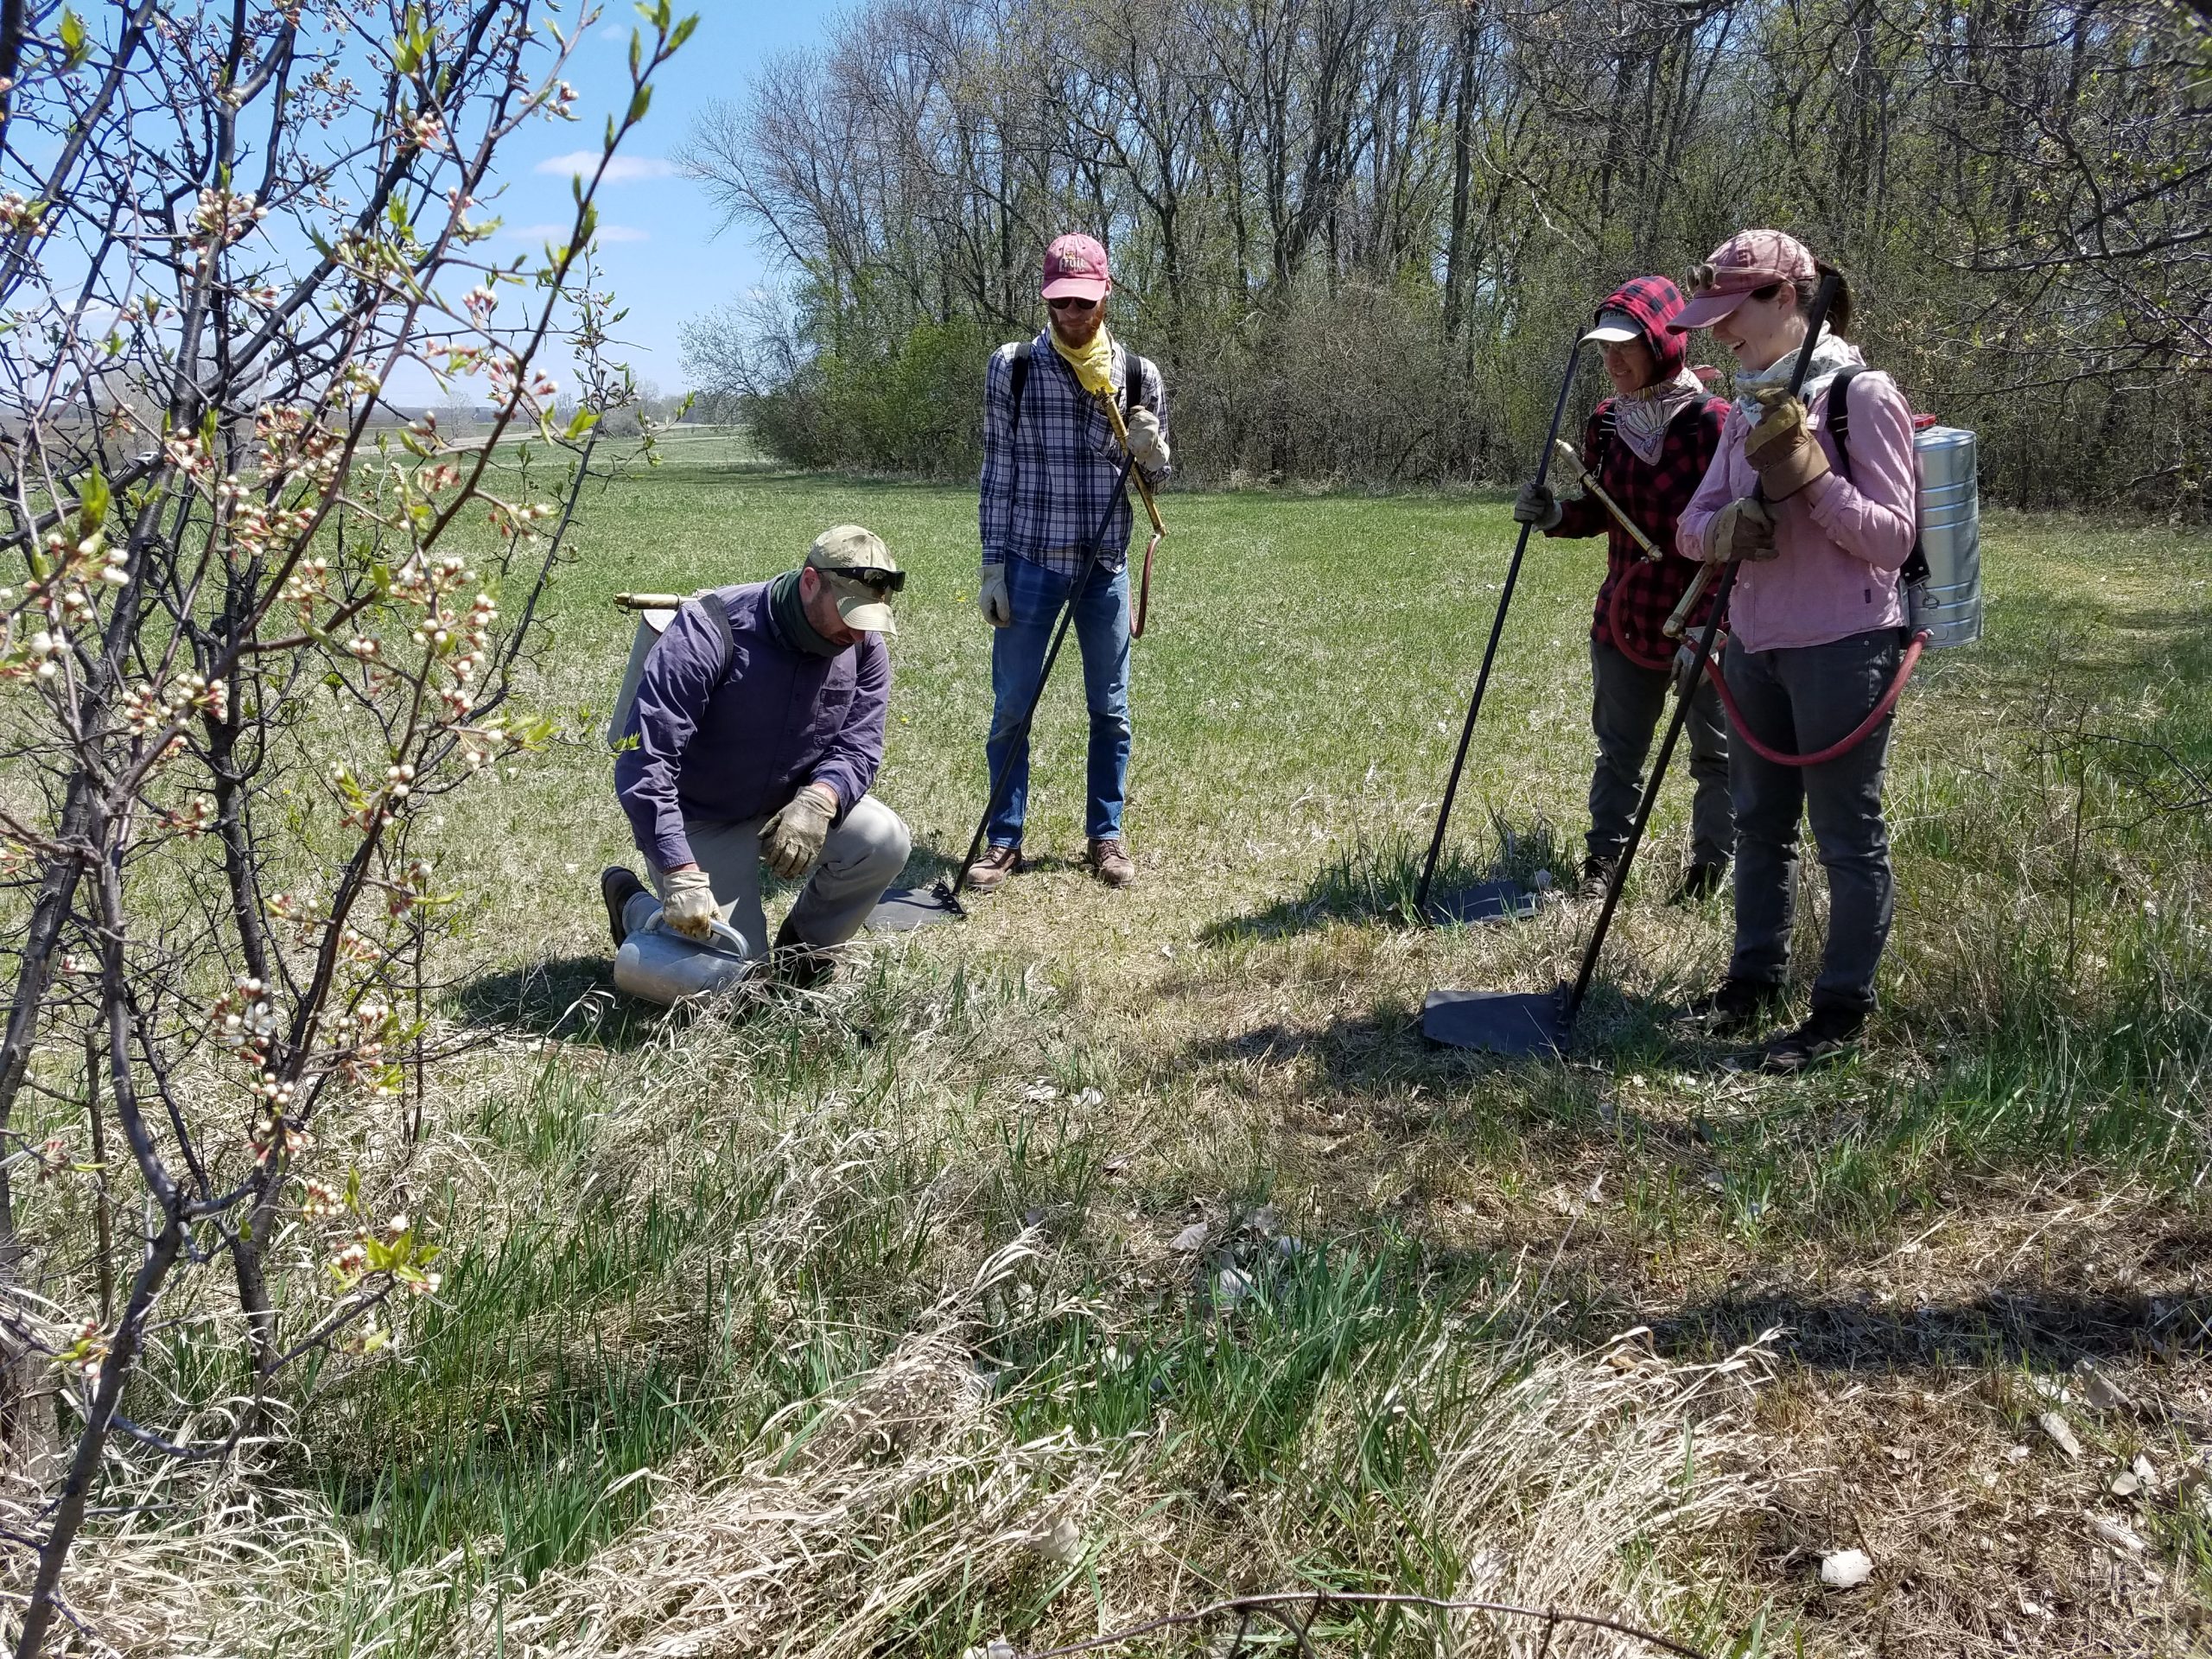
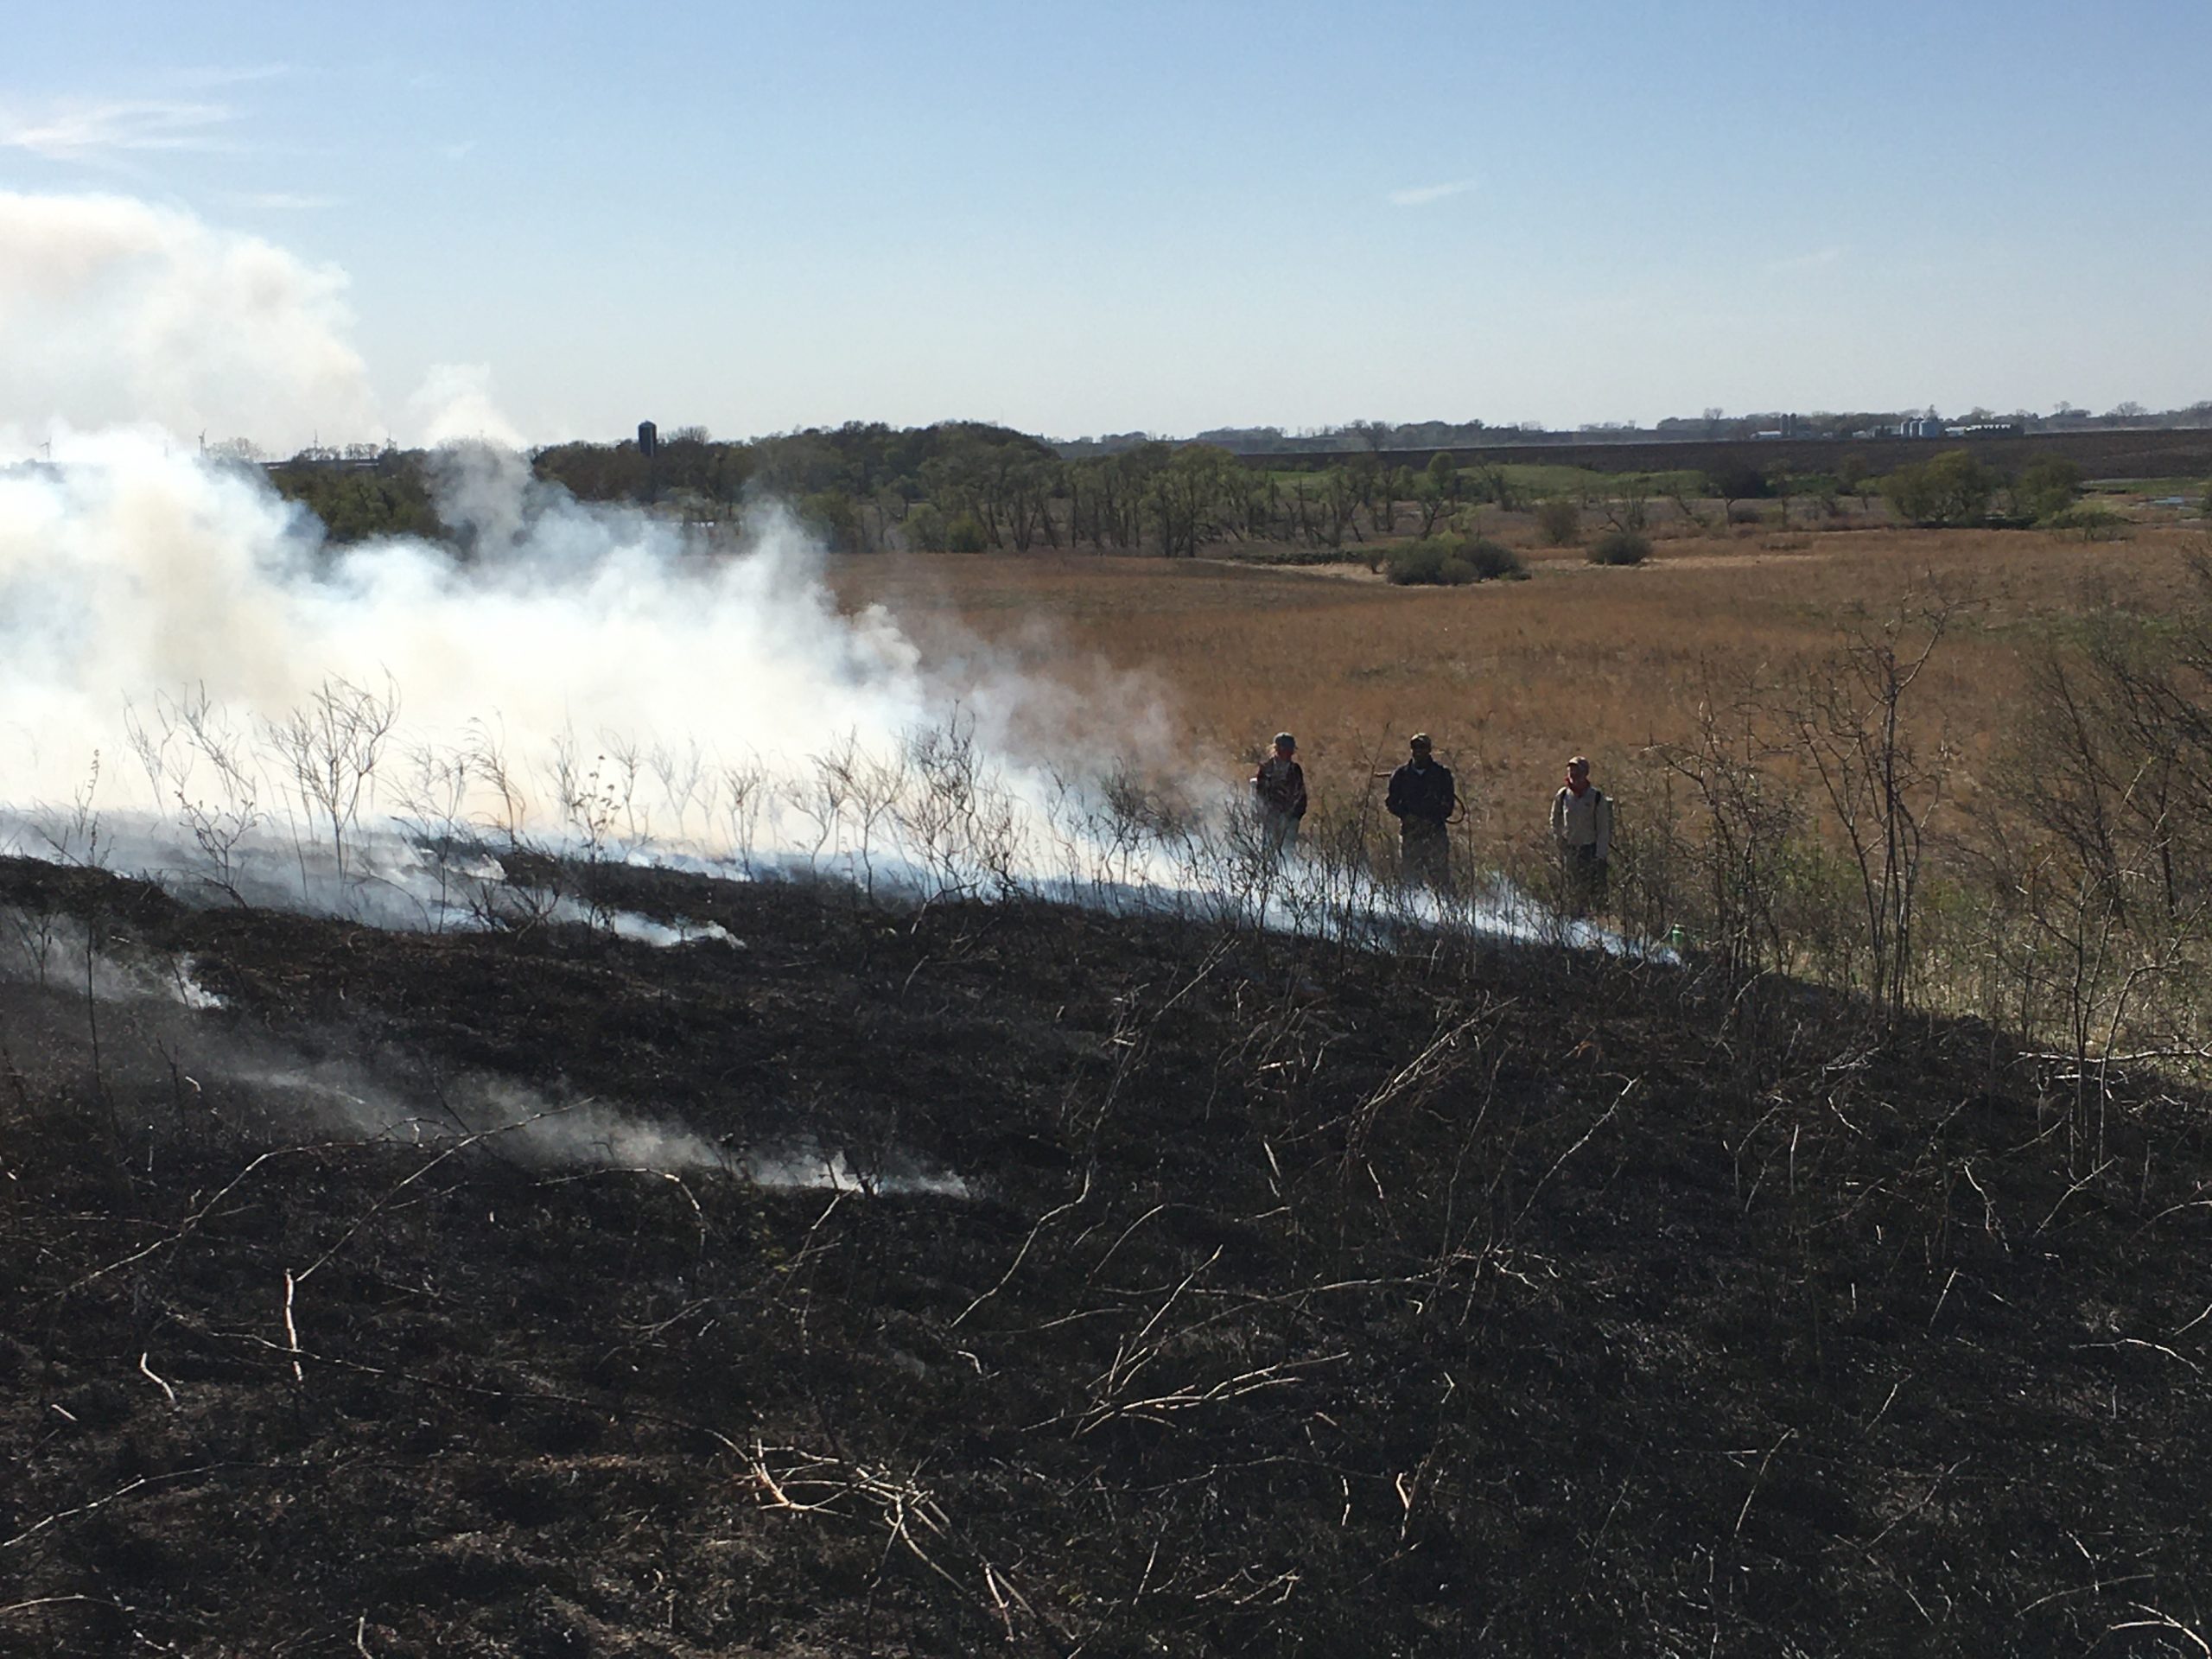
A handful of photos from the burn at landfill east illustrating our preparations and the start of the prescribed burn.
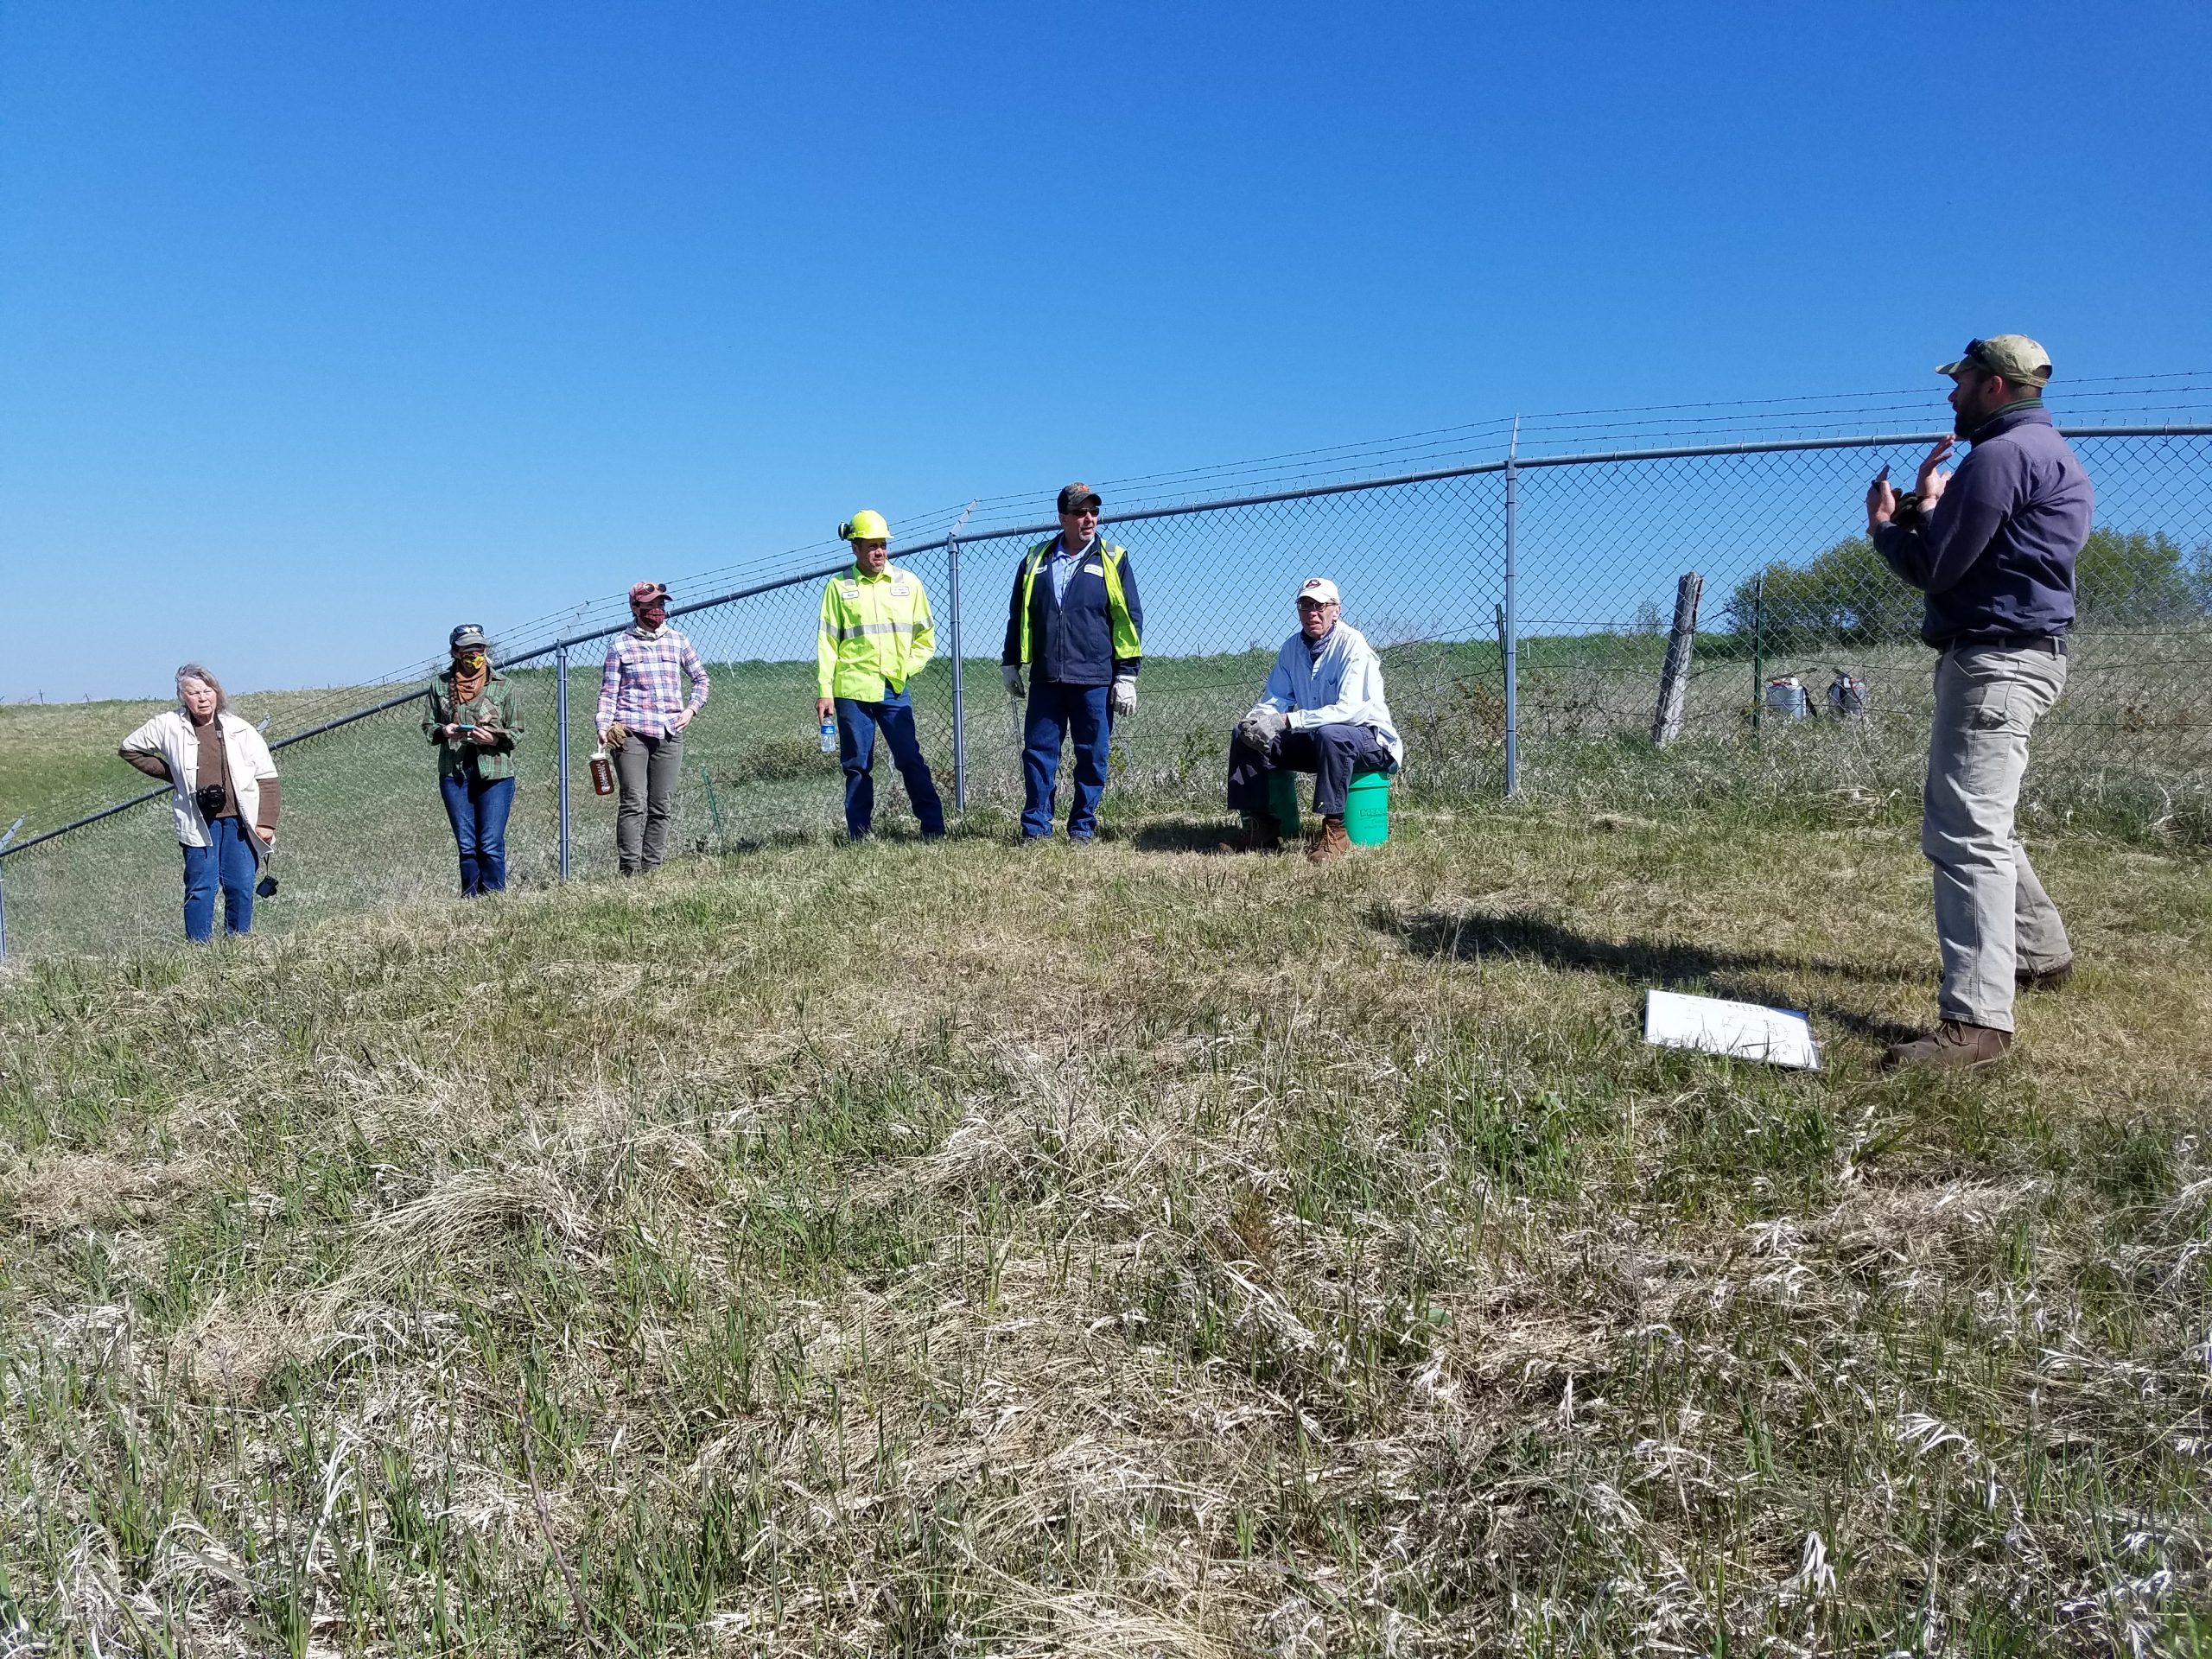
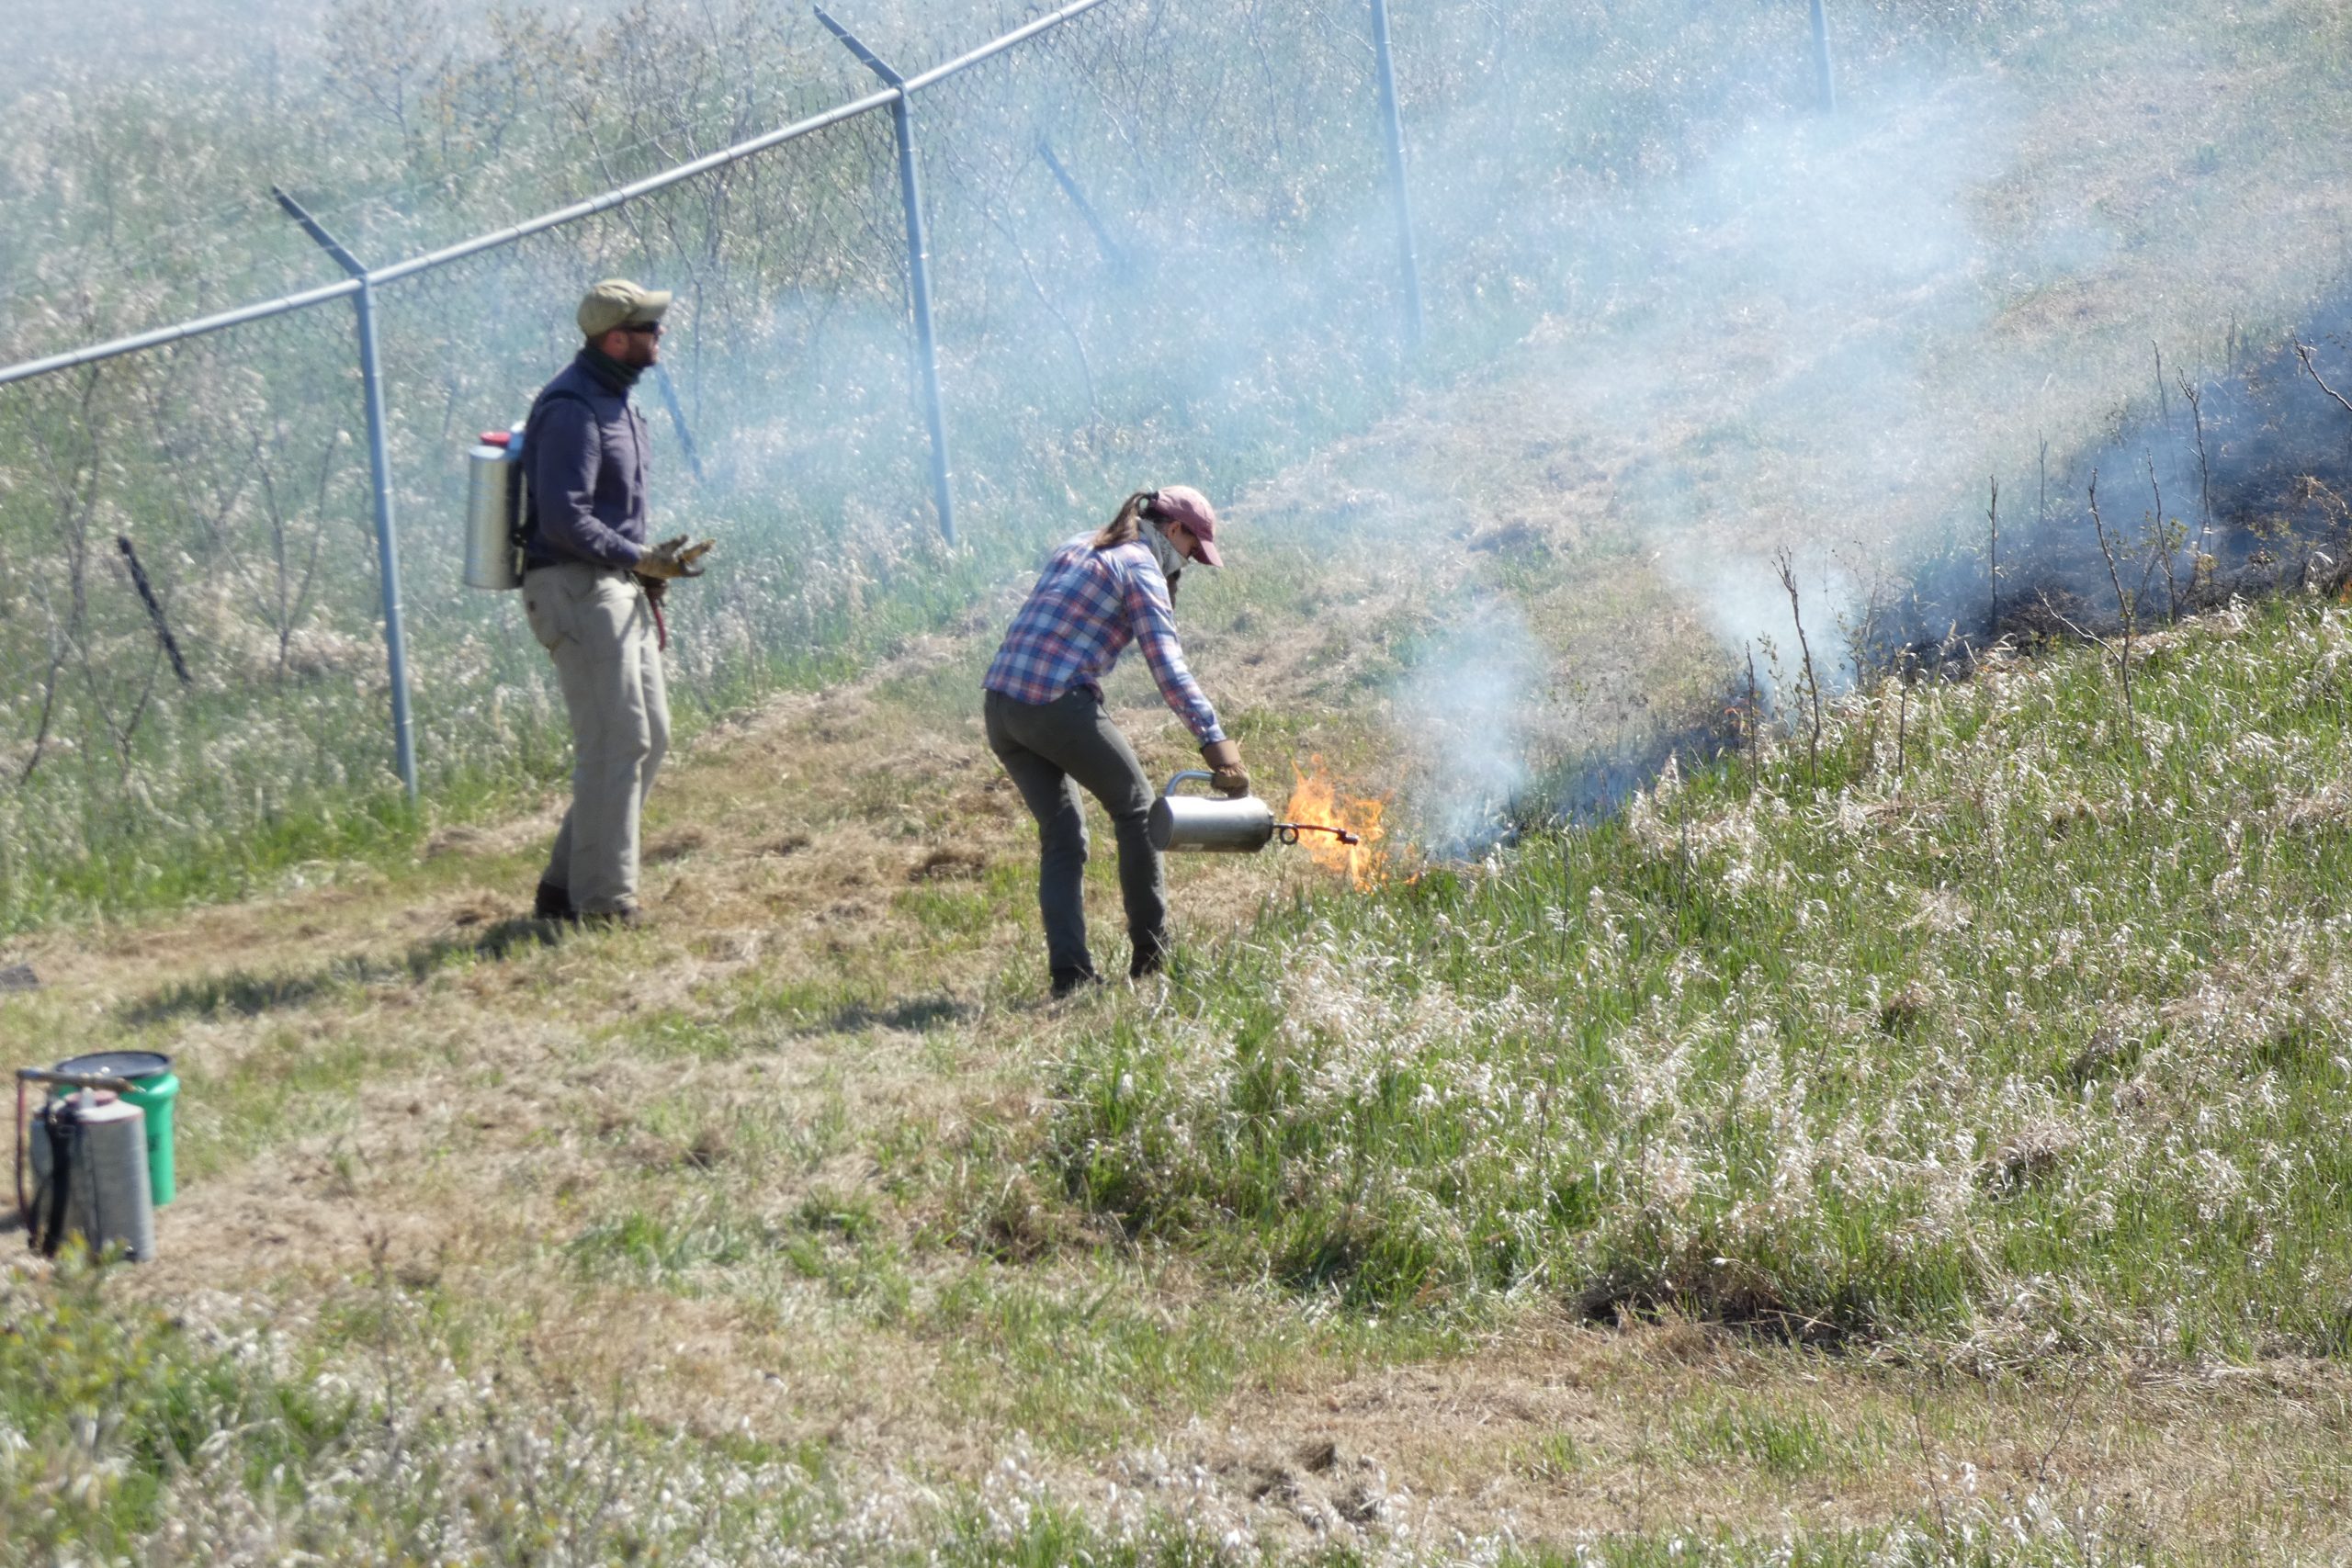
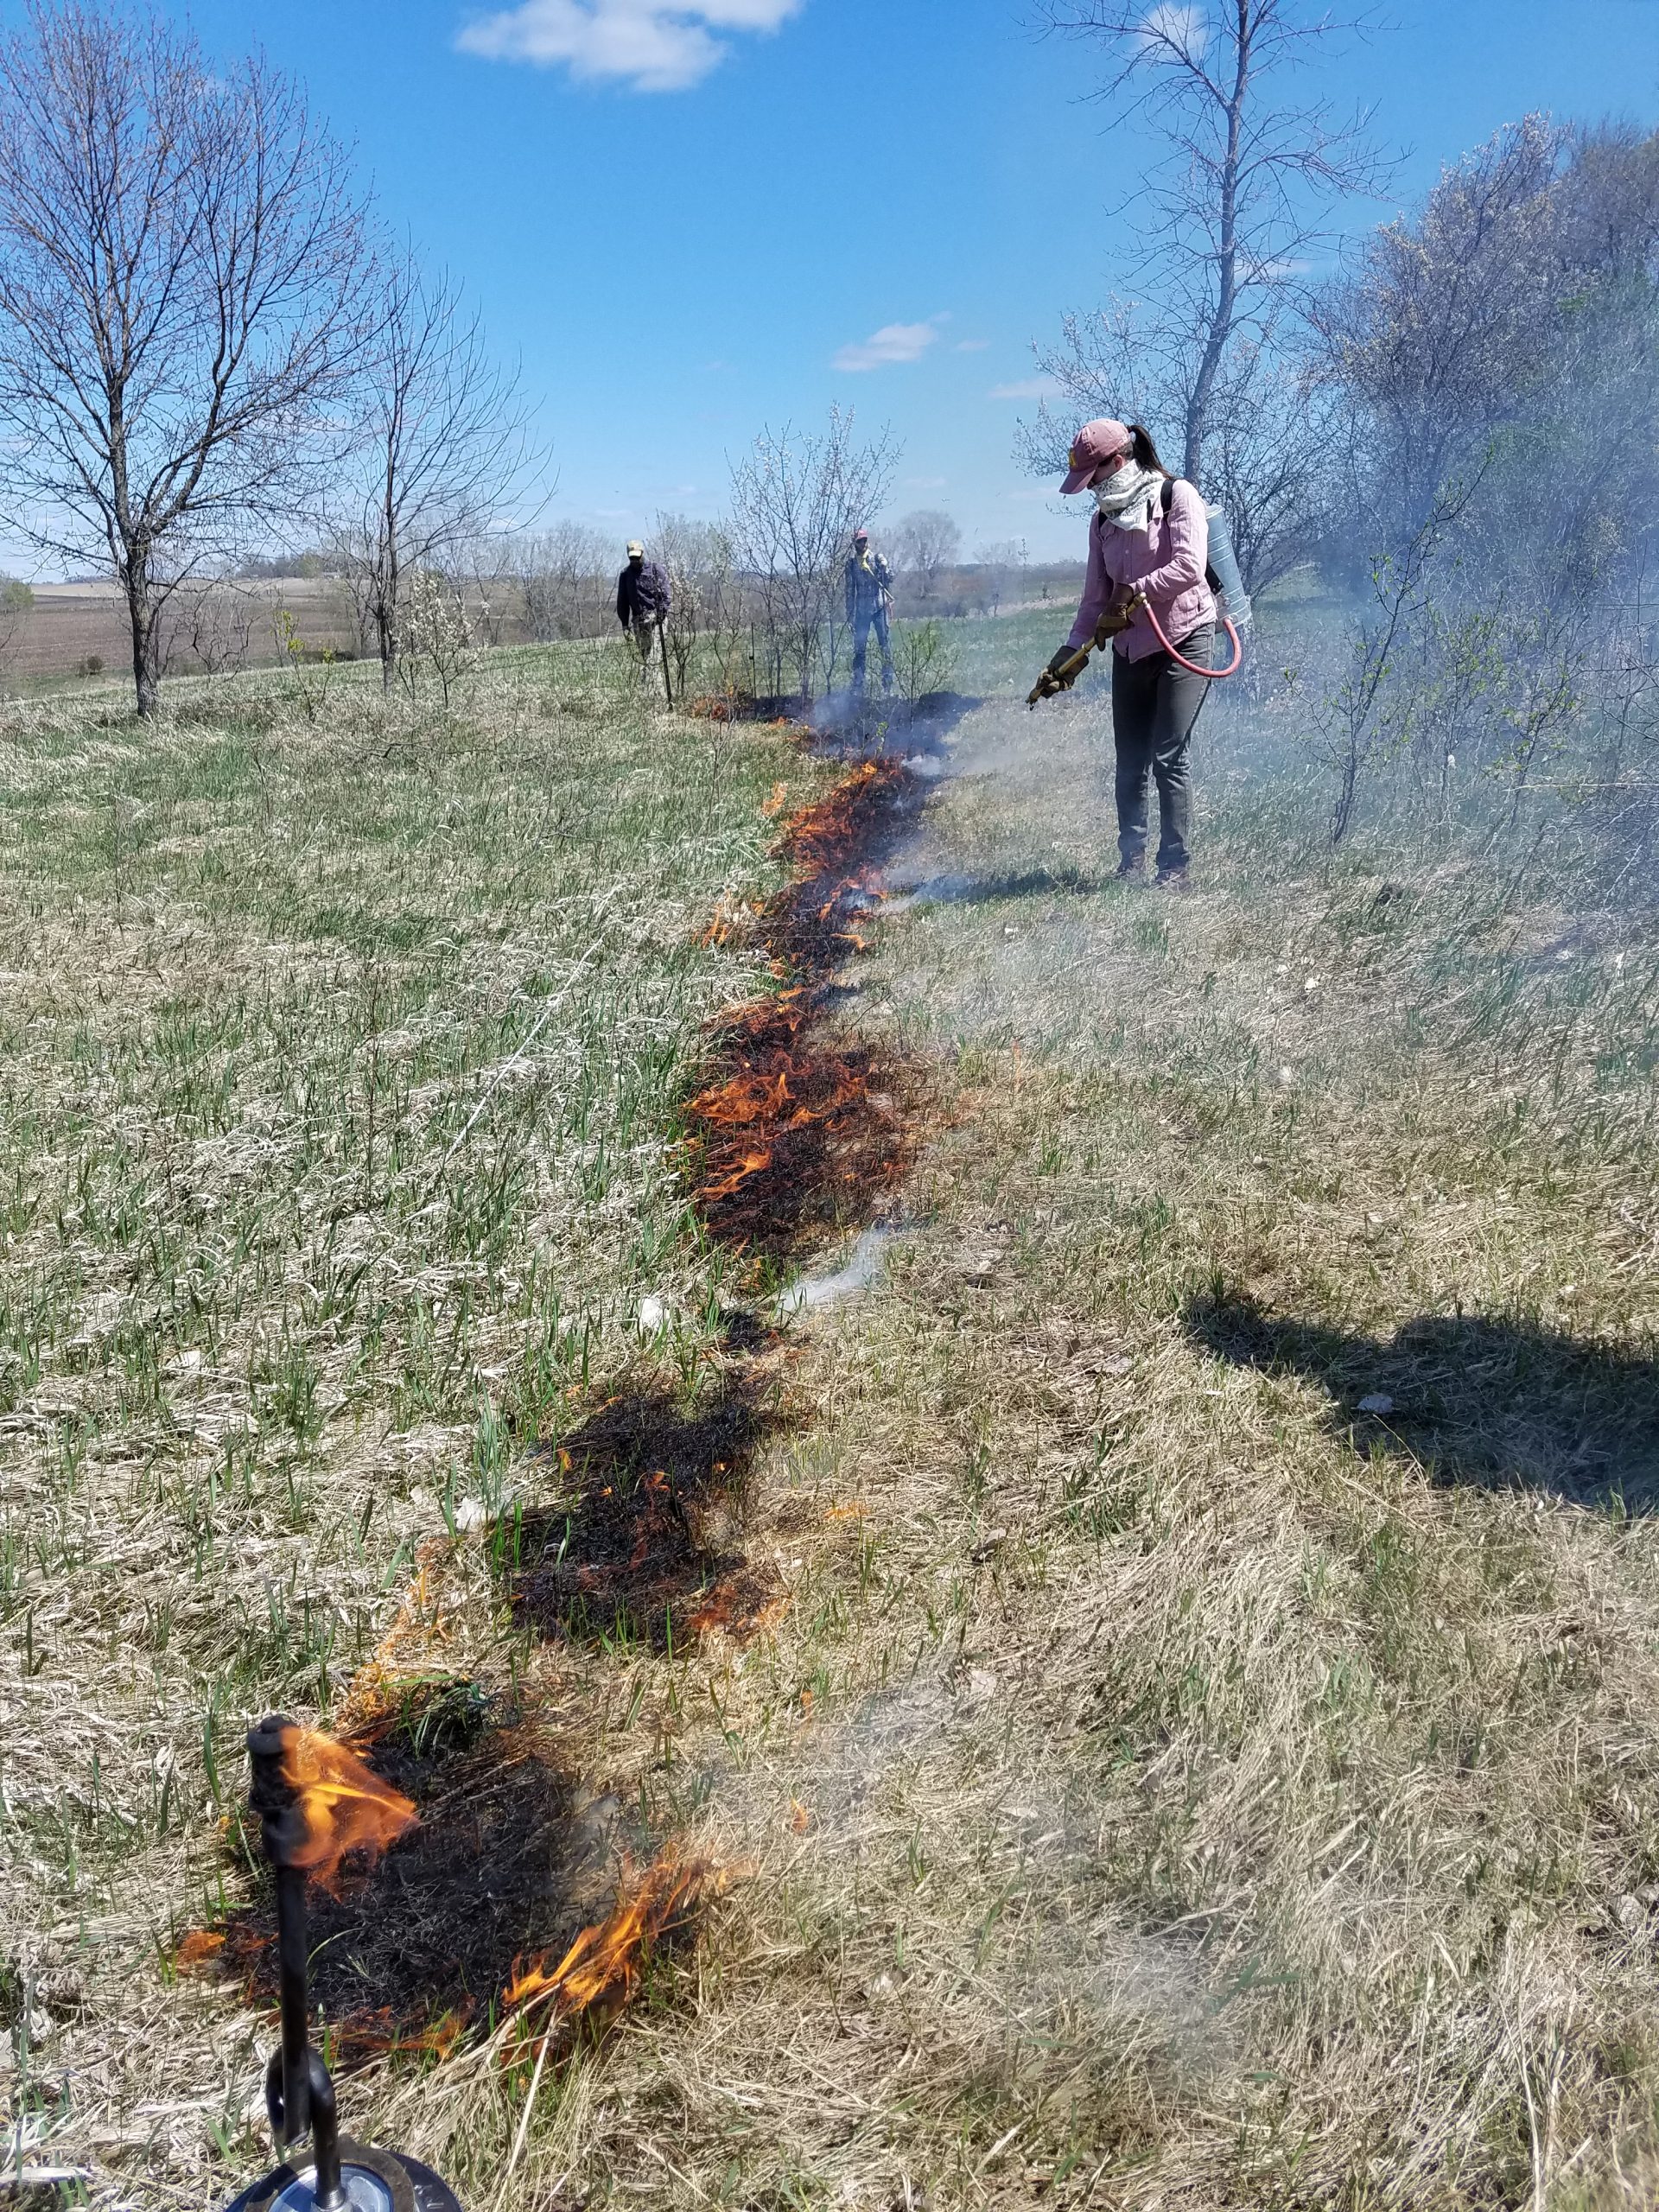
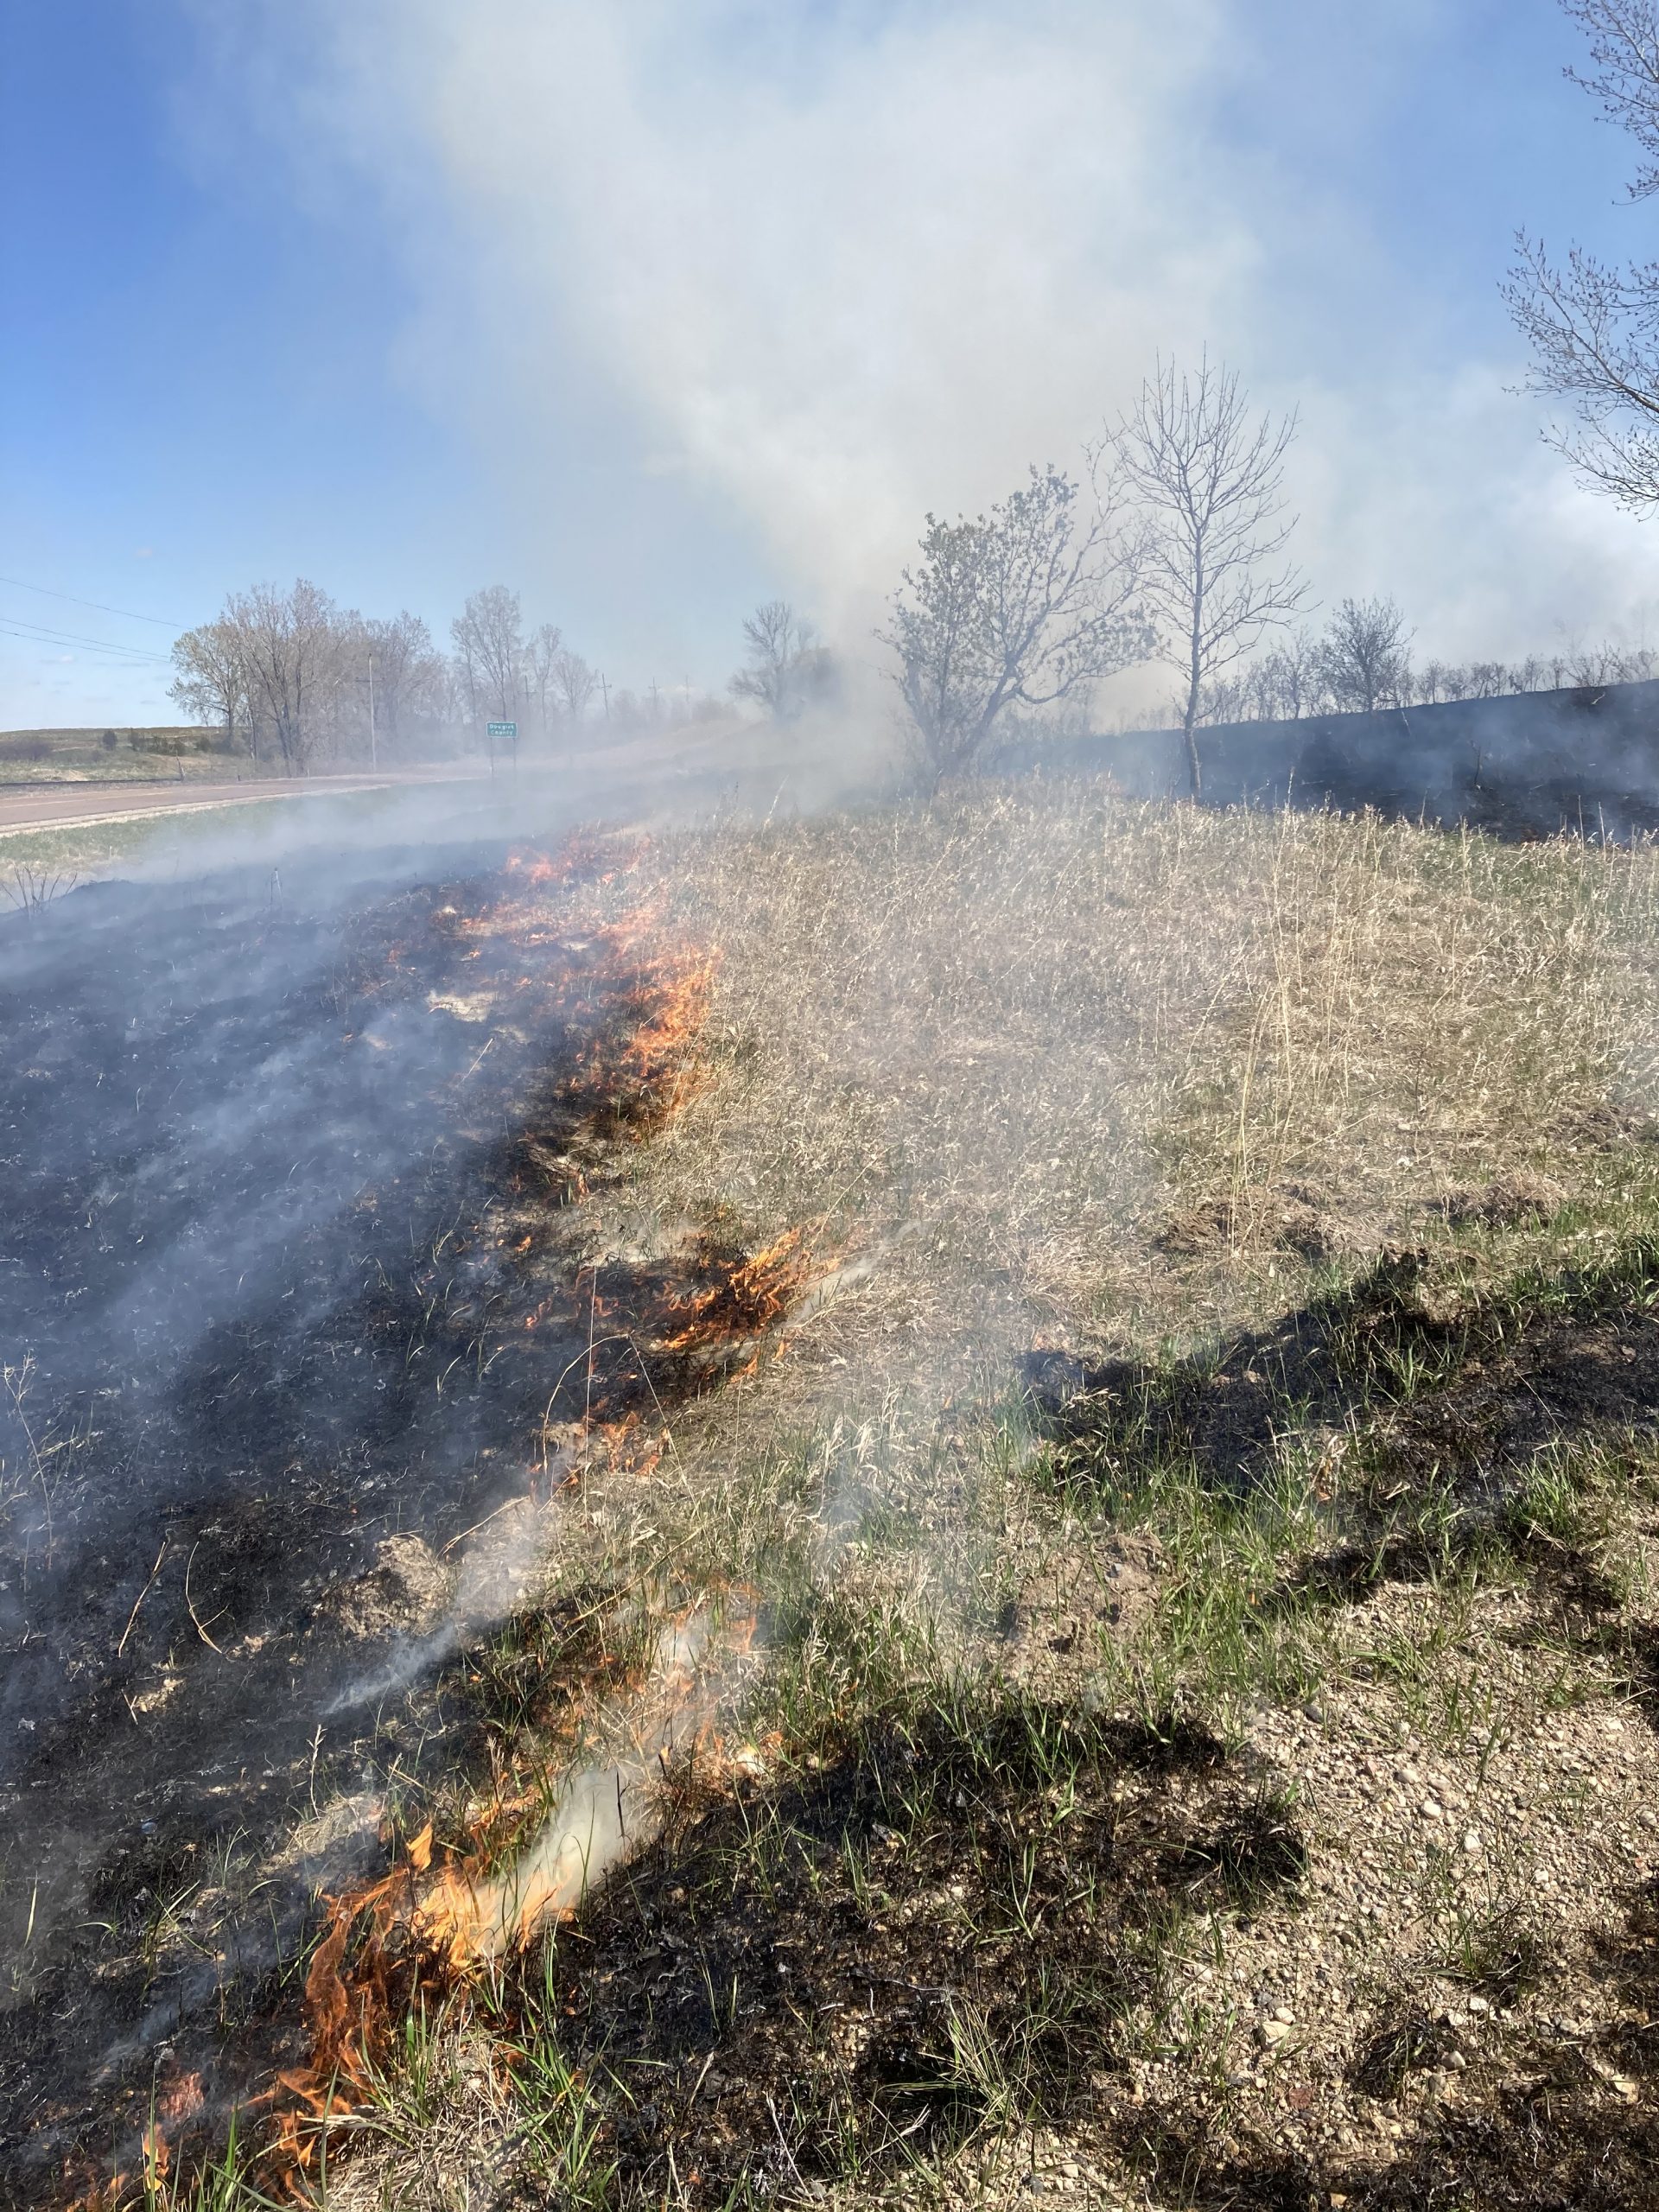
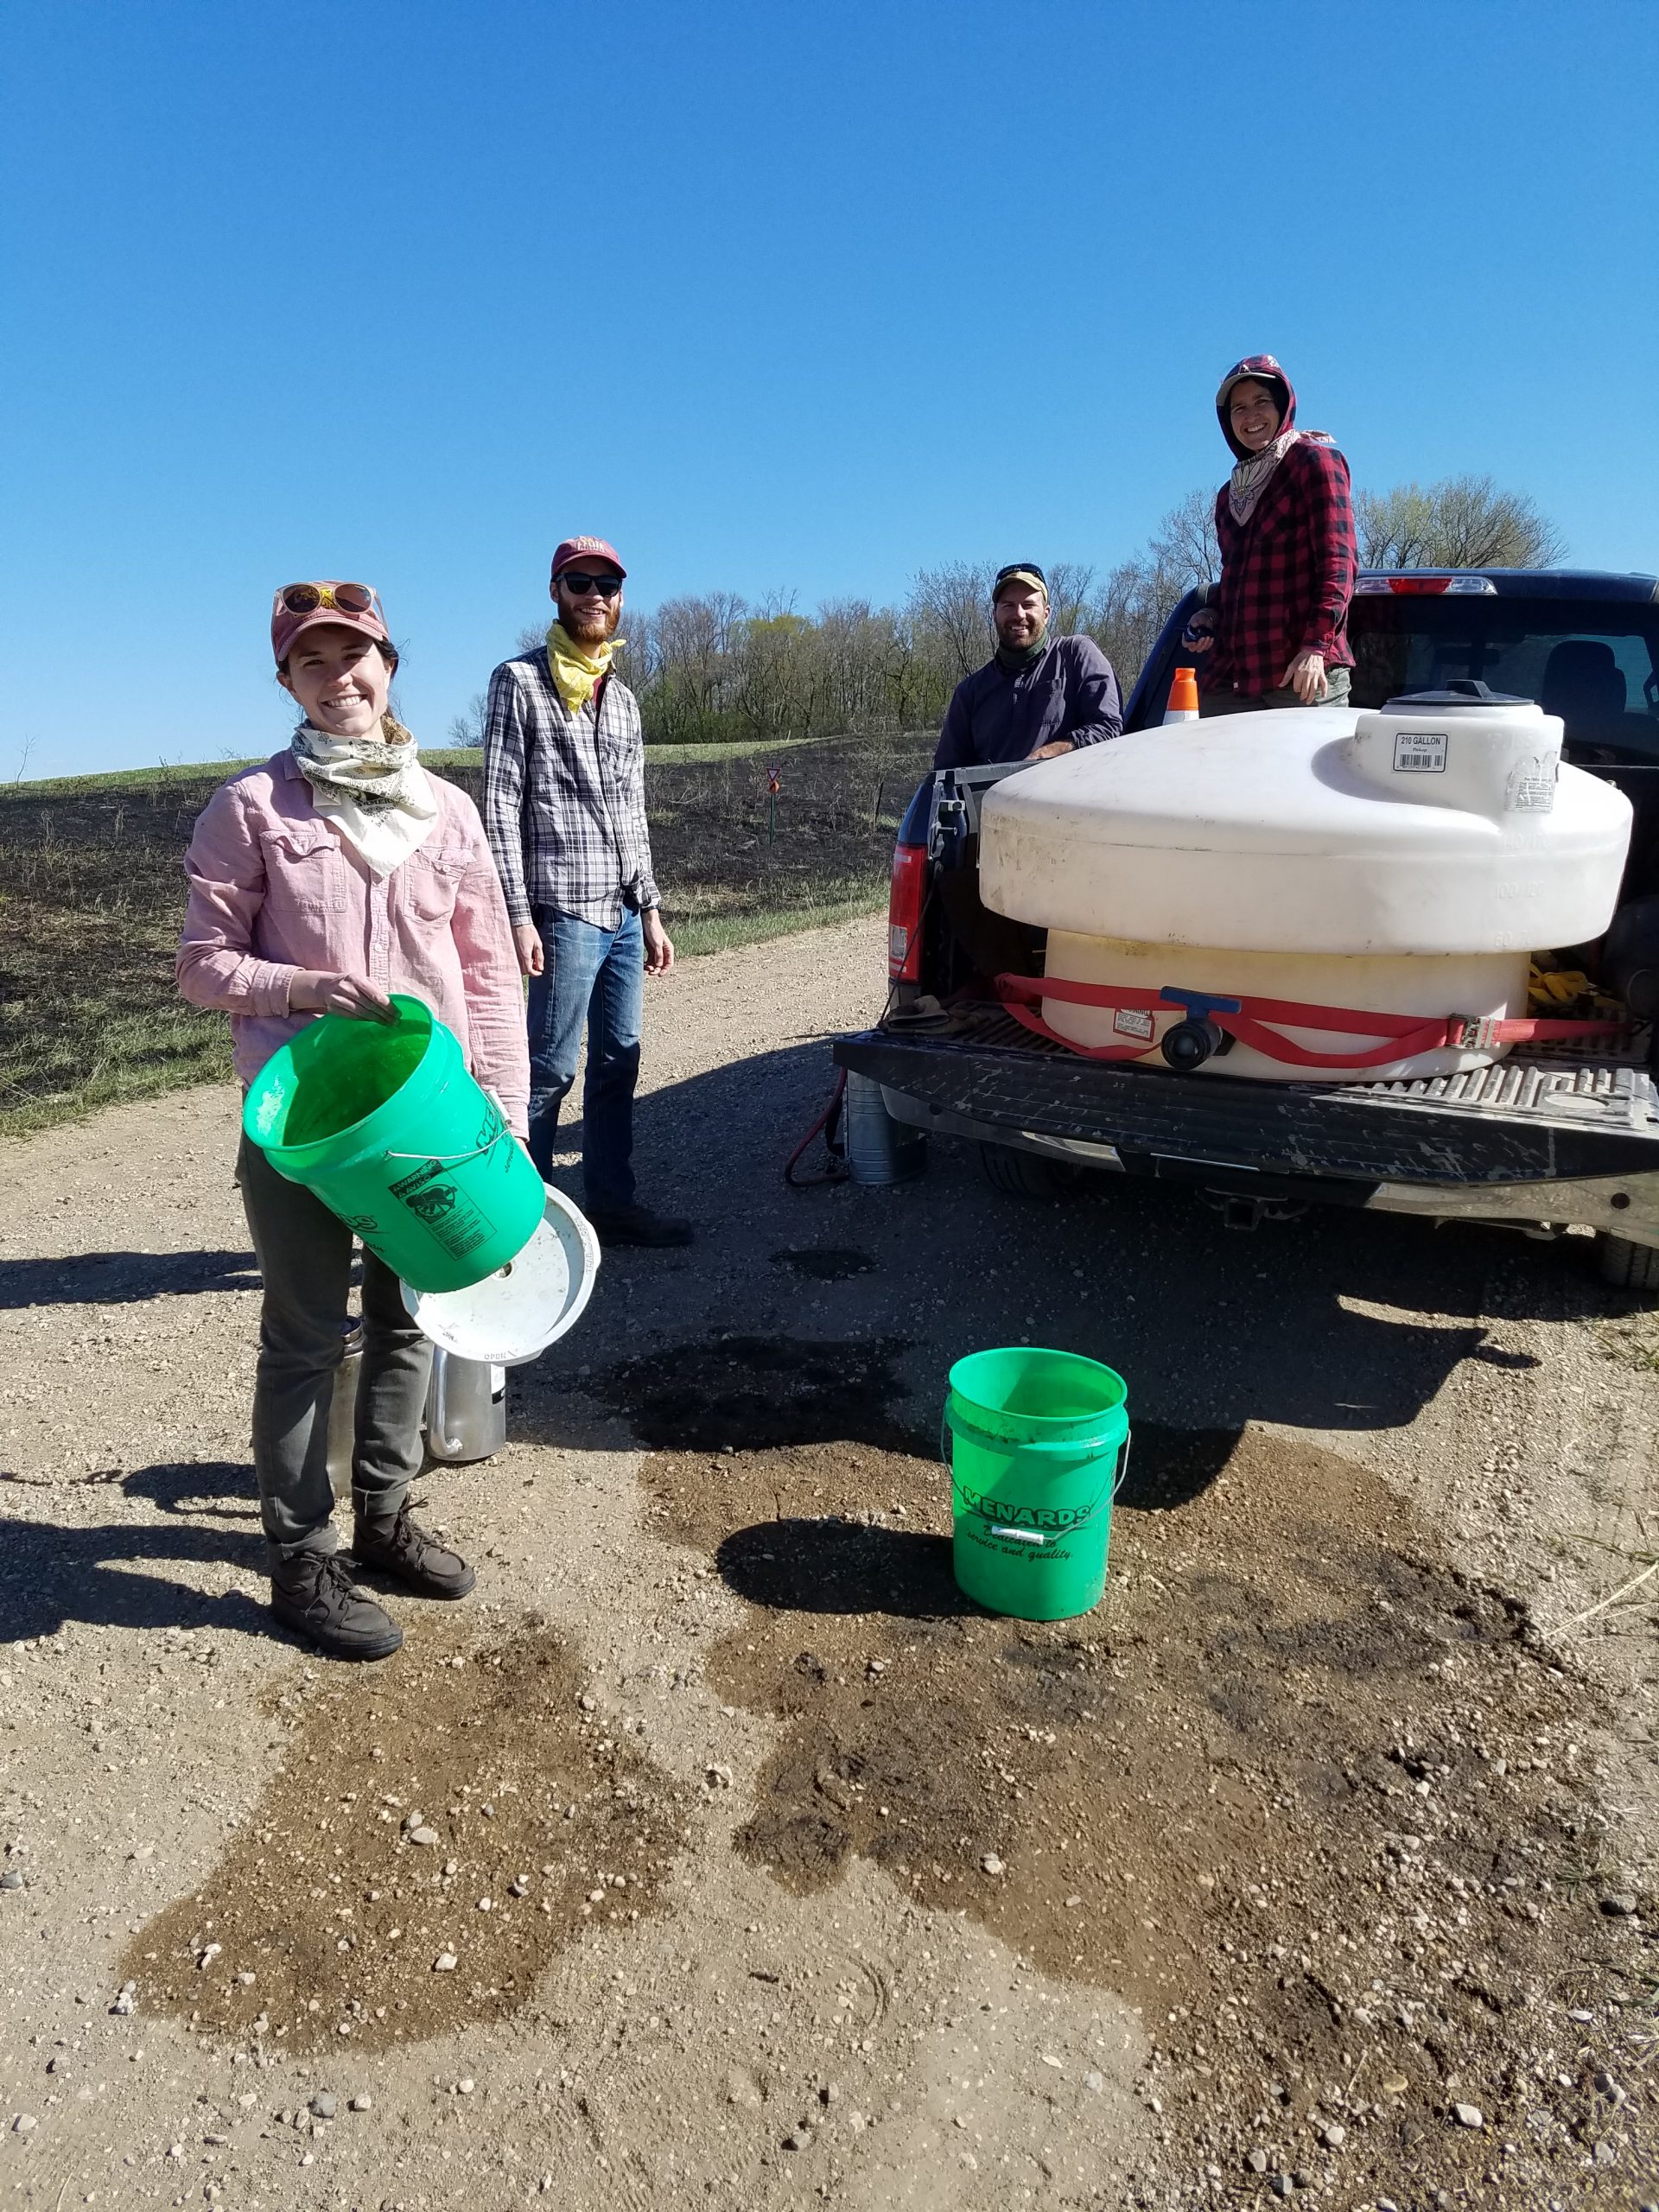
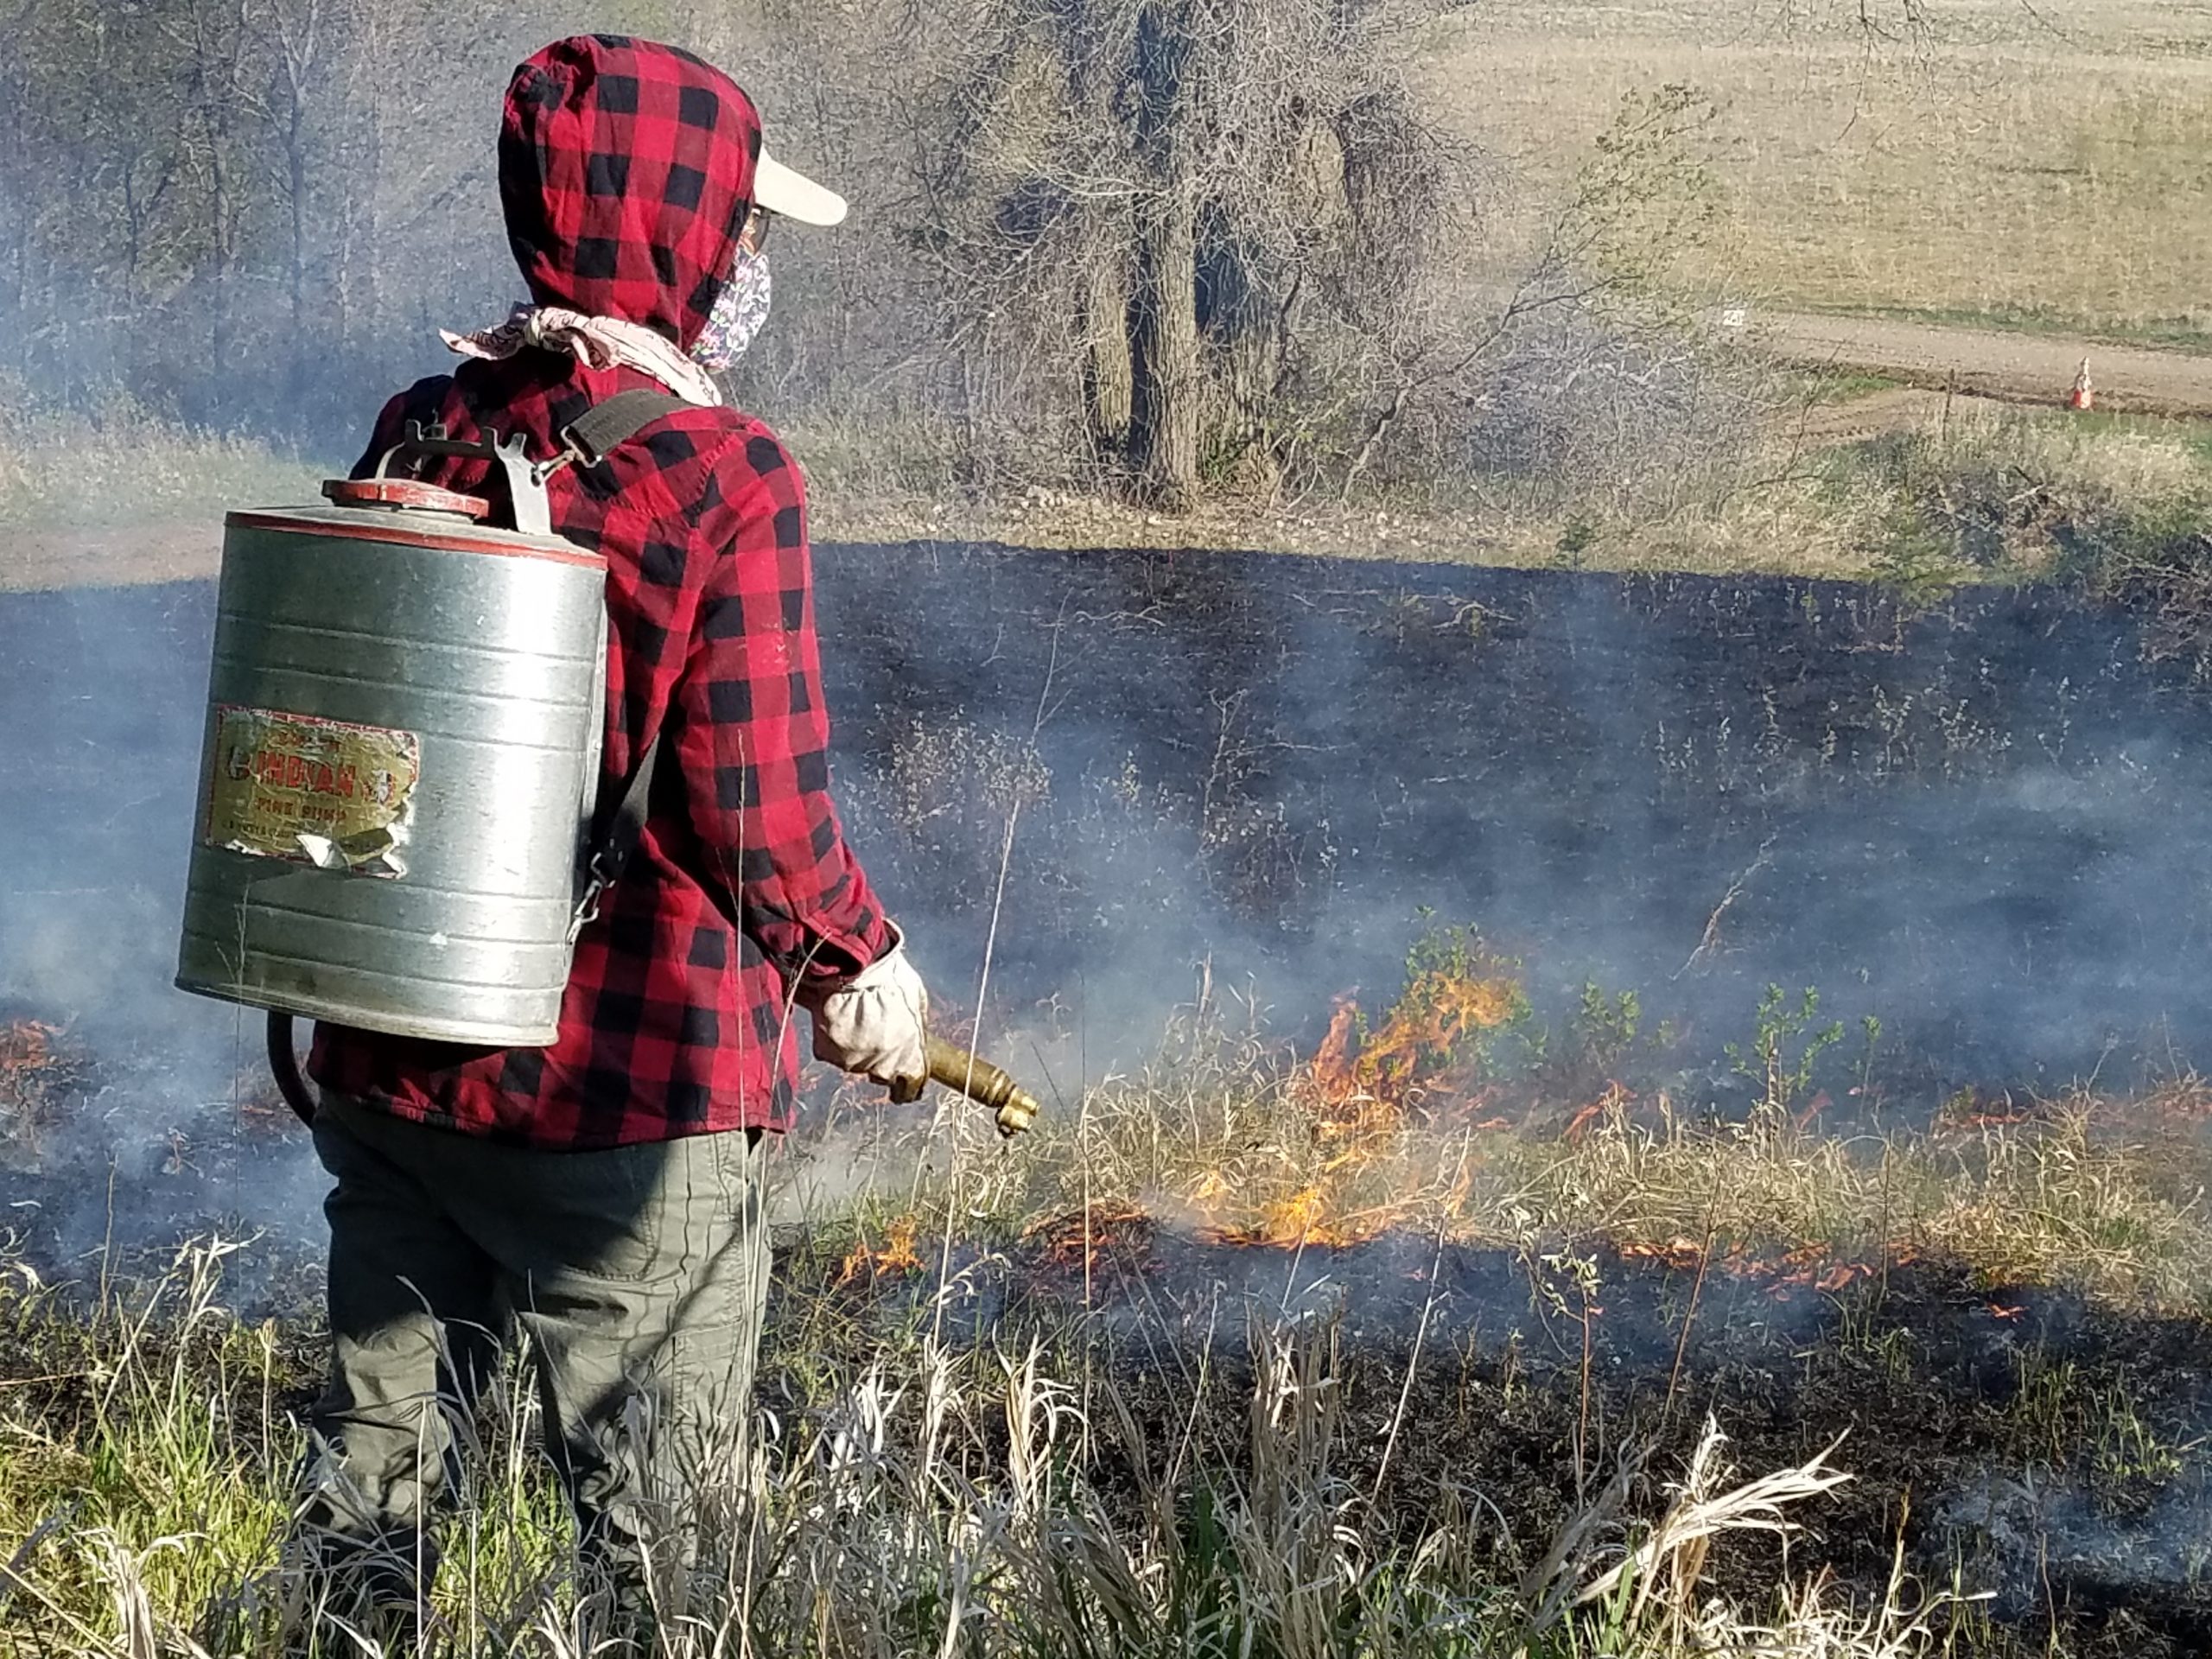
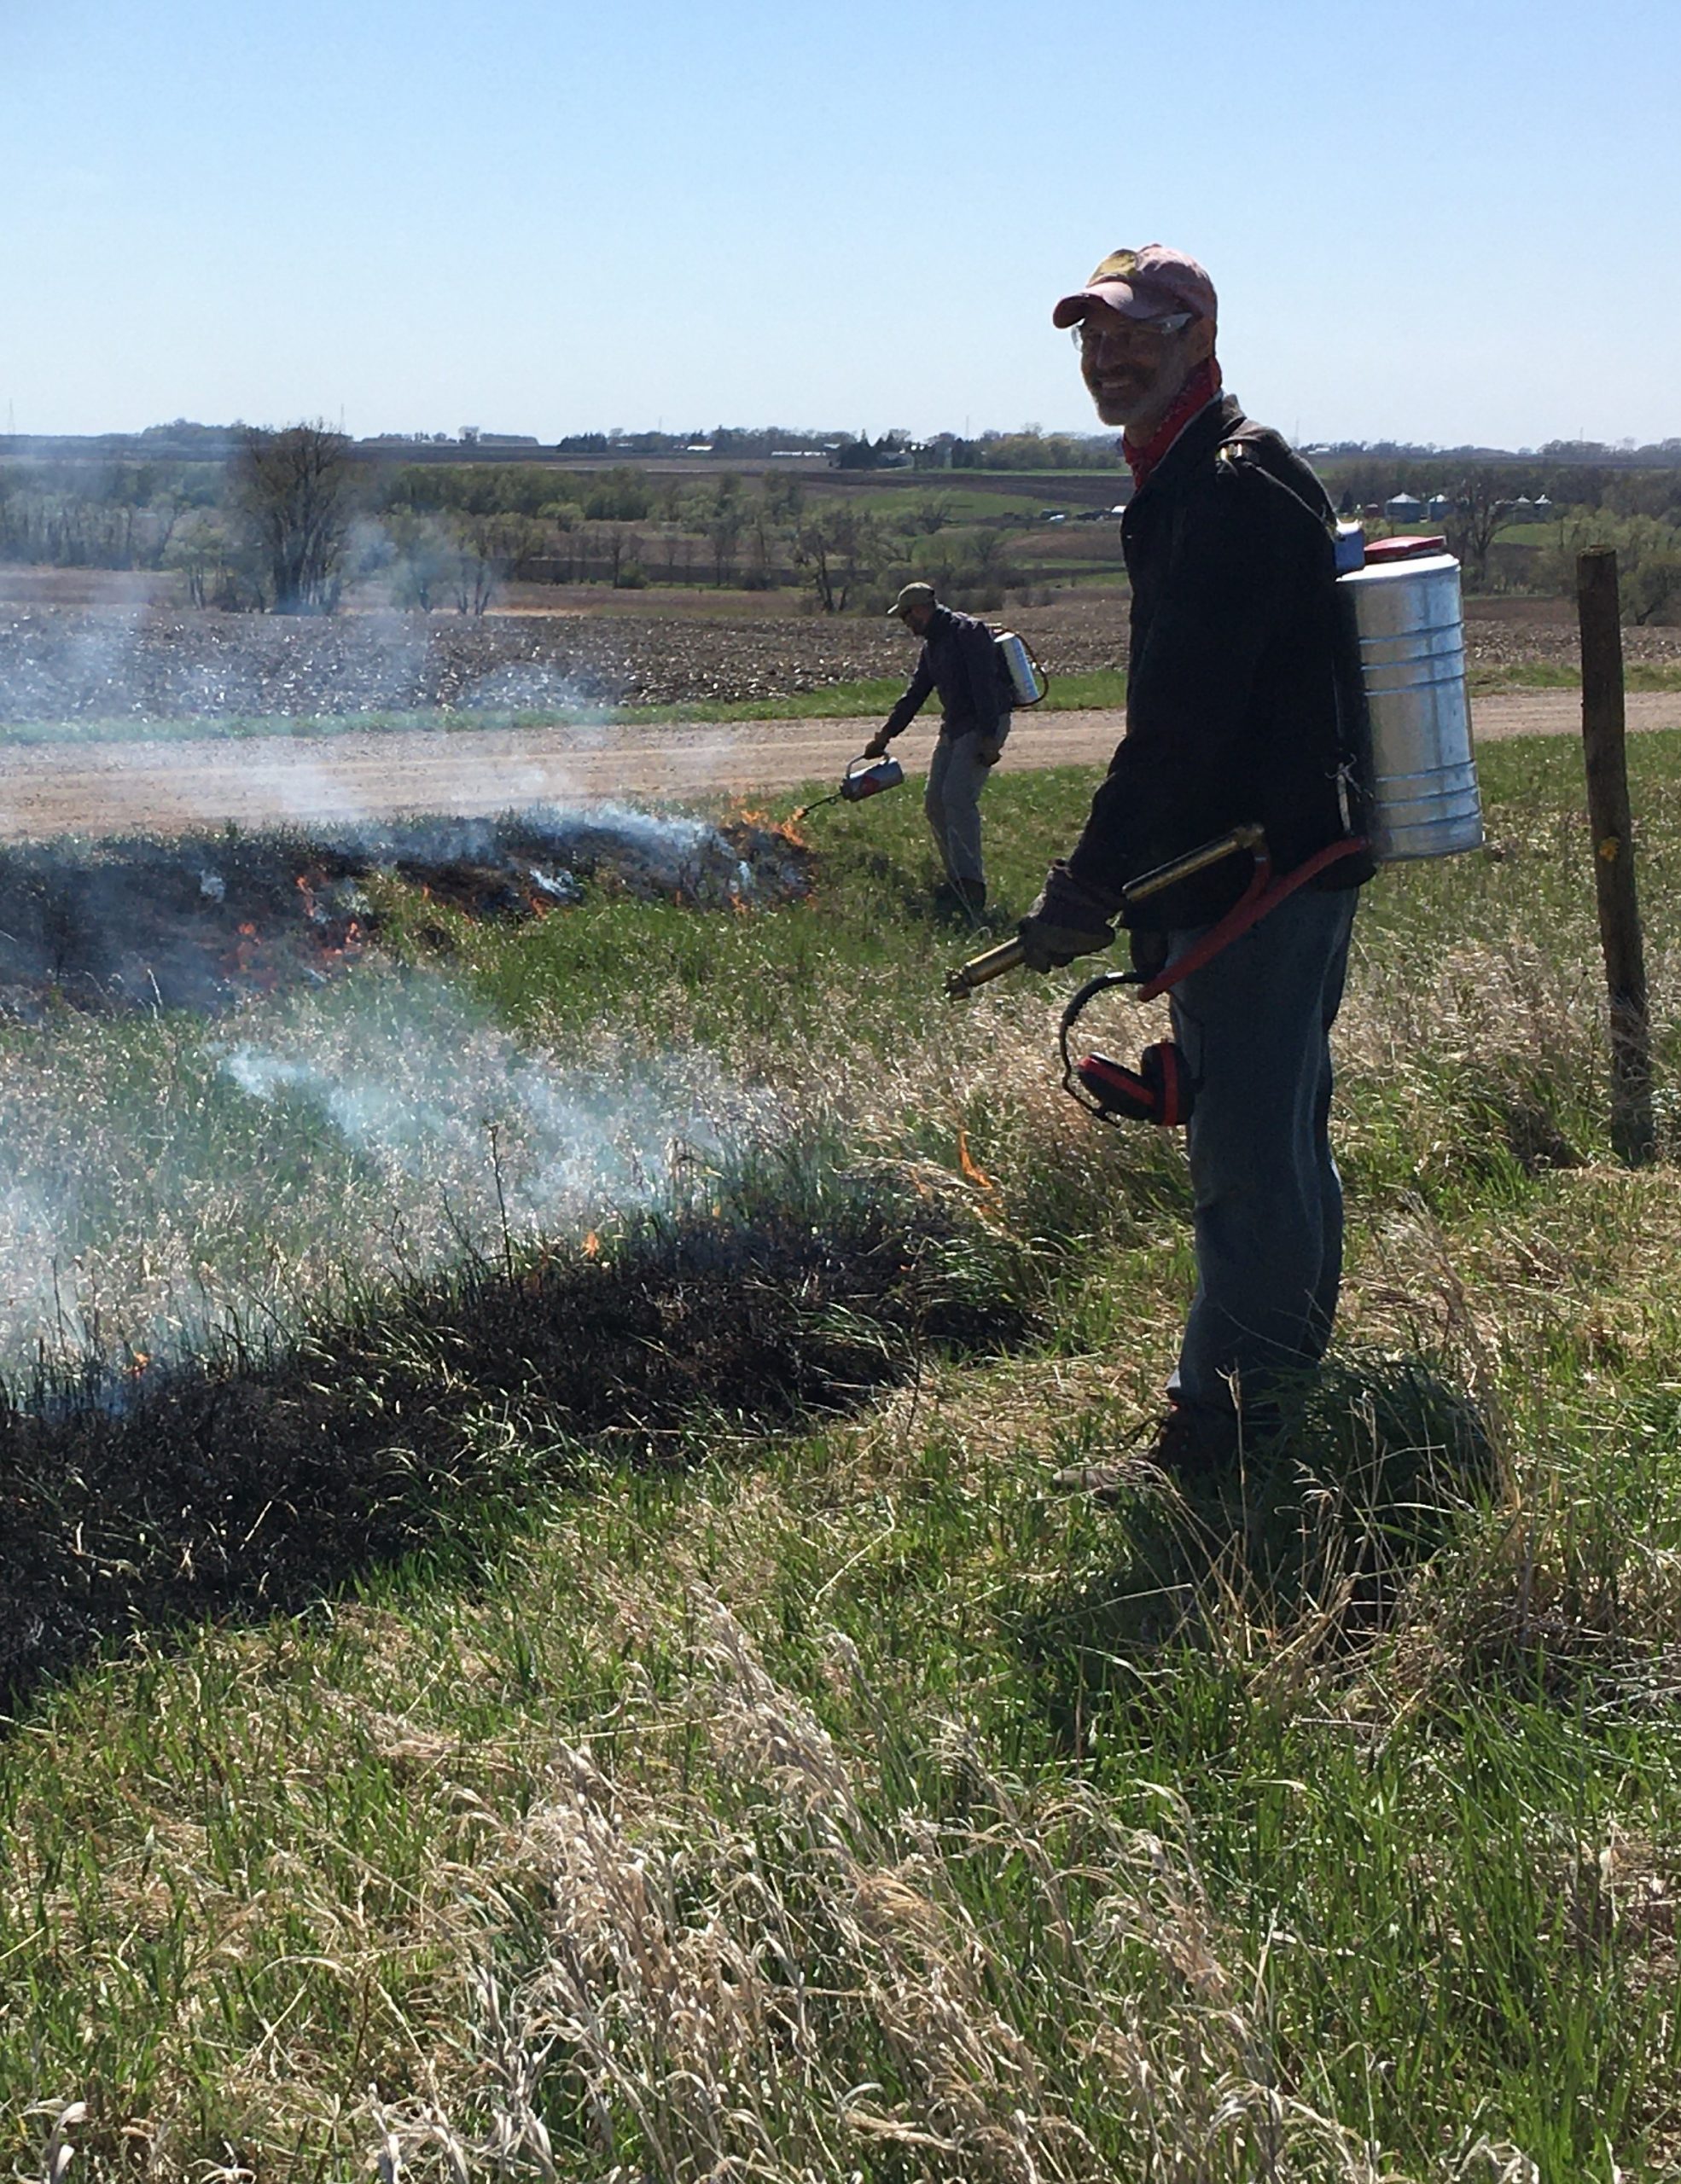
We were joined by Brad D., Amy W., and Julia B. who drove up from the Twin Cities as well as Karl, Nick, and Chris from PDSWM. Stuart’s aunt (a photographer) also tagged along to take photos. Around 10 AM we reviewed the burn plan emphasizing safety, gave a quick tutorial on tools, and assigned personnel. Team 1 was responsible for protecting the pasture north of our burn unit should fire move across our burn break while Team 2 and Team 3 would ignite along the east and west edges of the burn unit. We began a test fire at the apex of the hill and it burned beautifully. We cautiously used a wet line to prevent fire from creeping across our northern burn break but the mowed and raked break held up very well. Once Team 2 reach the northeast corner, Team 3 began igniting to the west. The fire moved much more slowly and was much less volatile than we anticipated. Having a well-behaved fire was a huge relief for this burn boss. Stuart and I definitely lost sleep Tuesday night planning for every possible scenario to ensure we could keep the burn crew safe and the fire within the allotted unit.
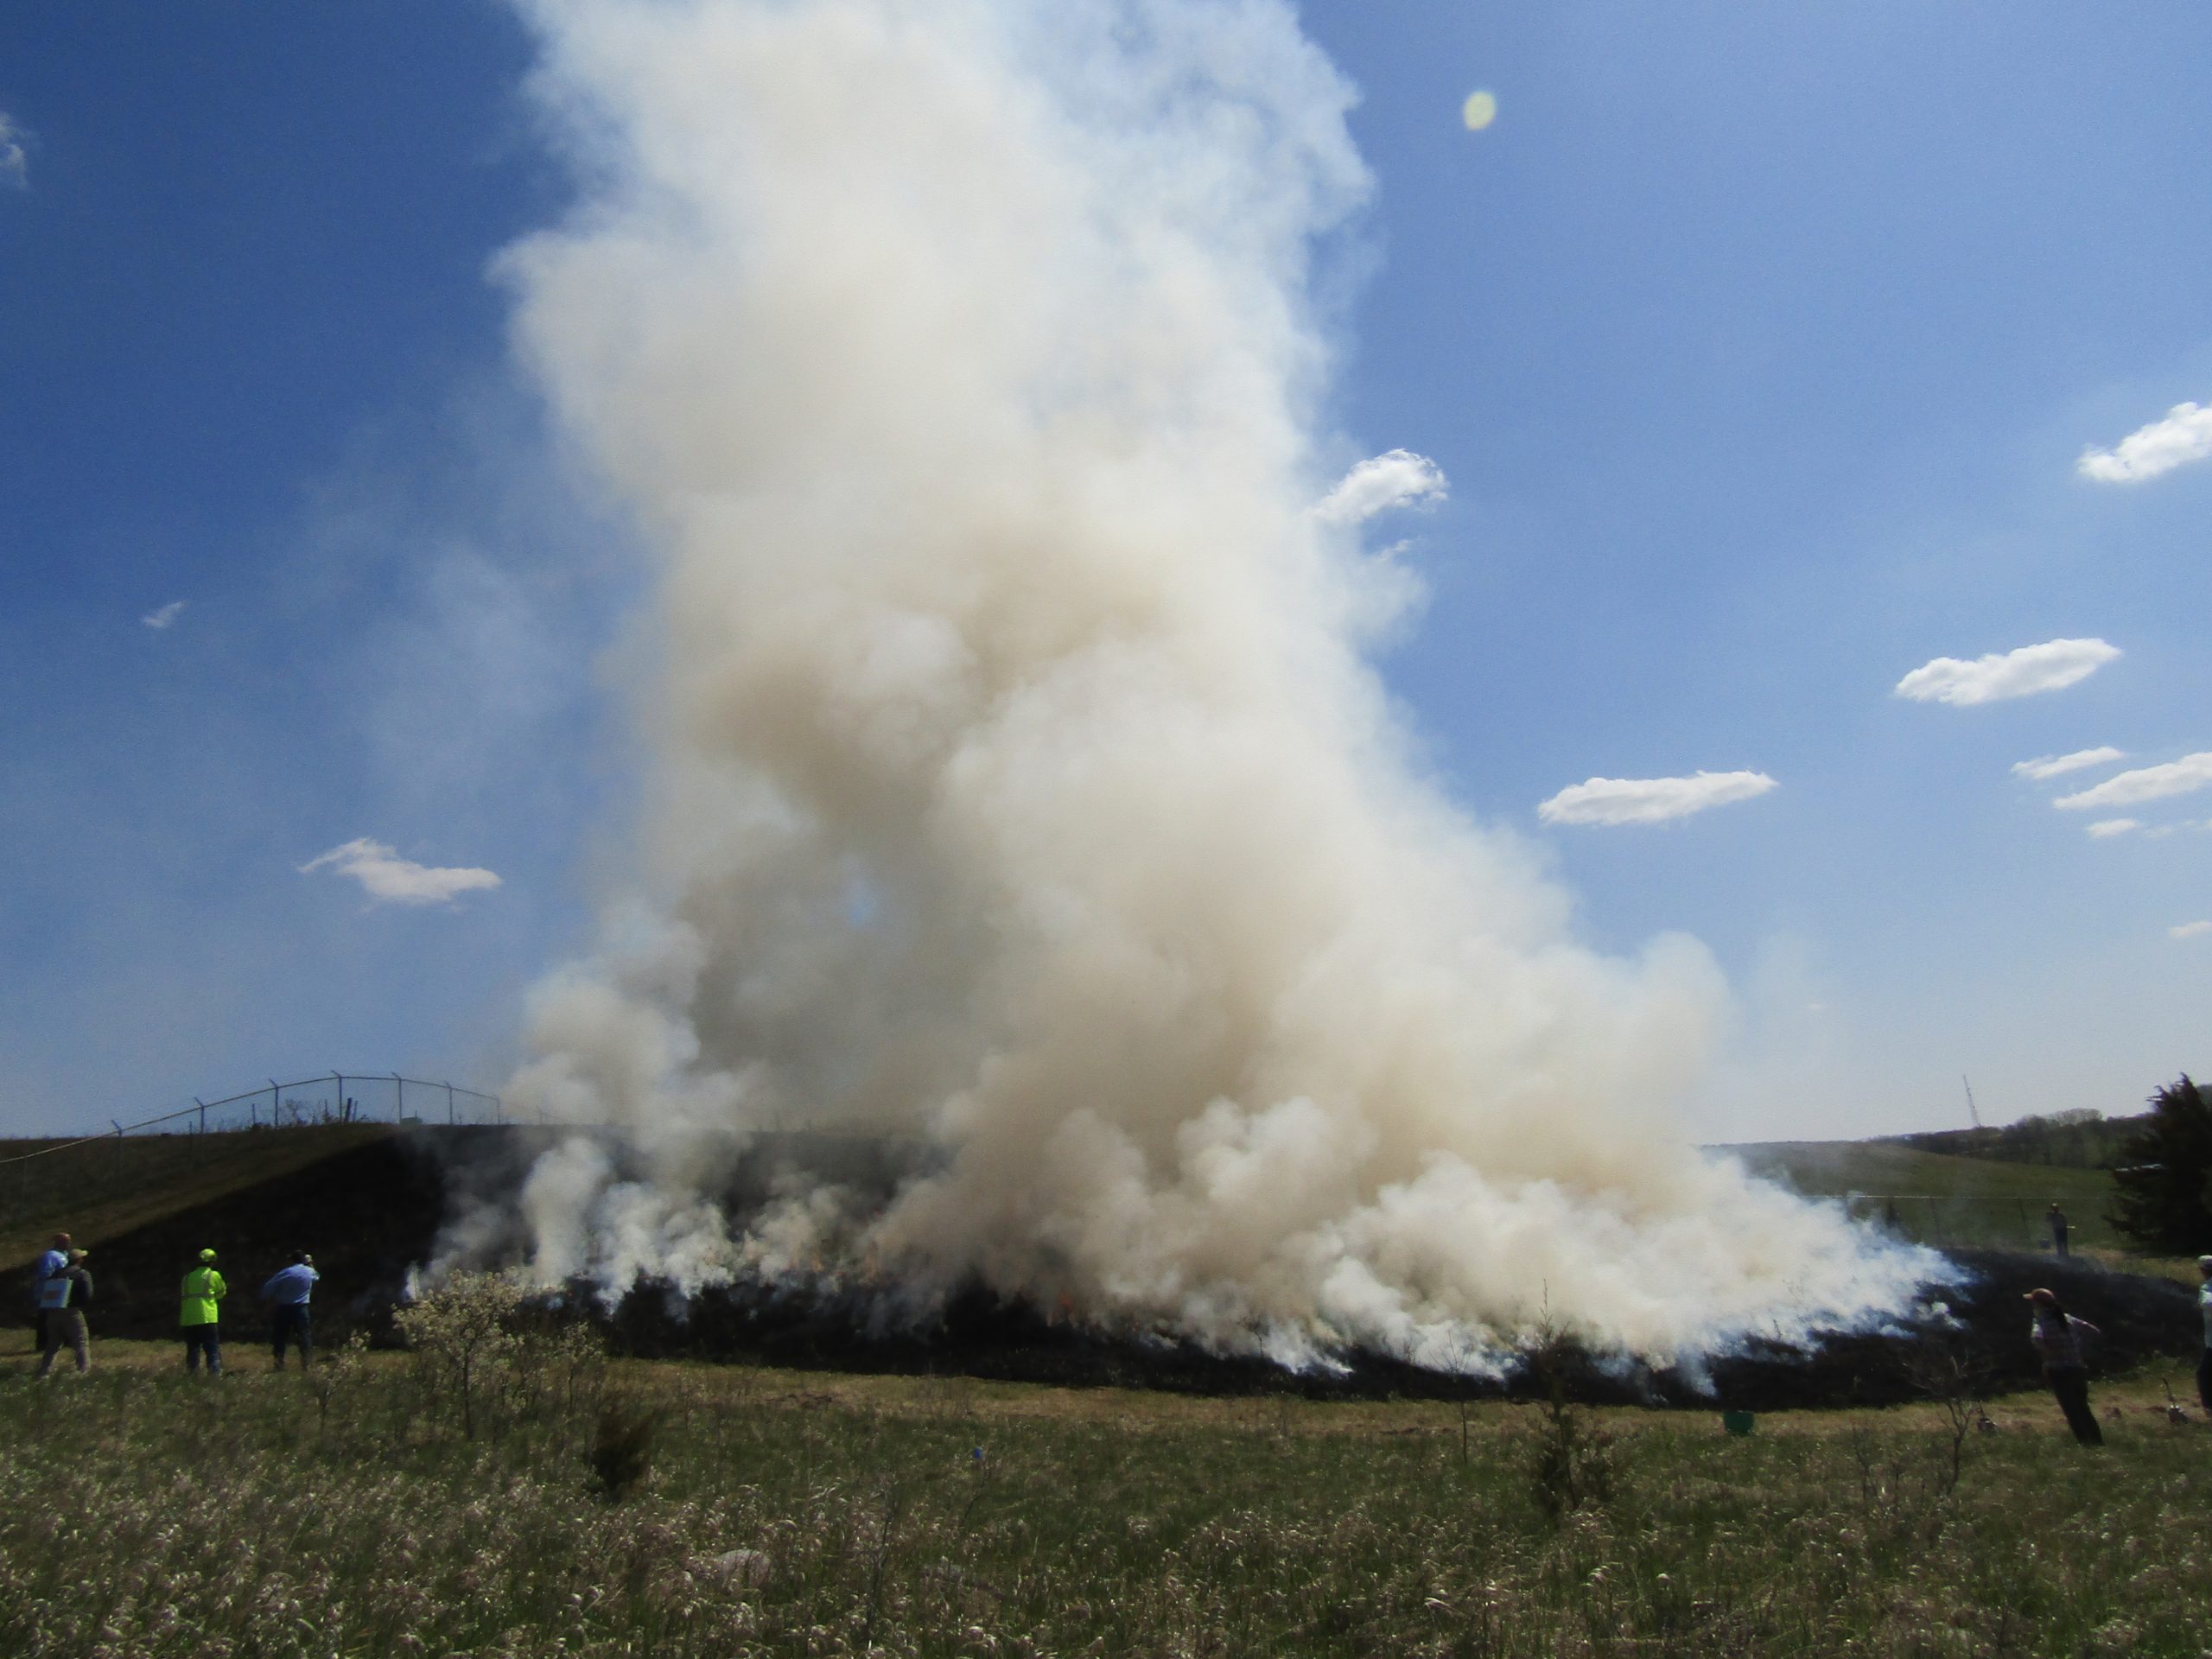
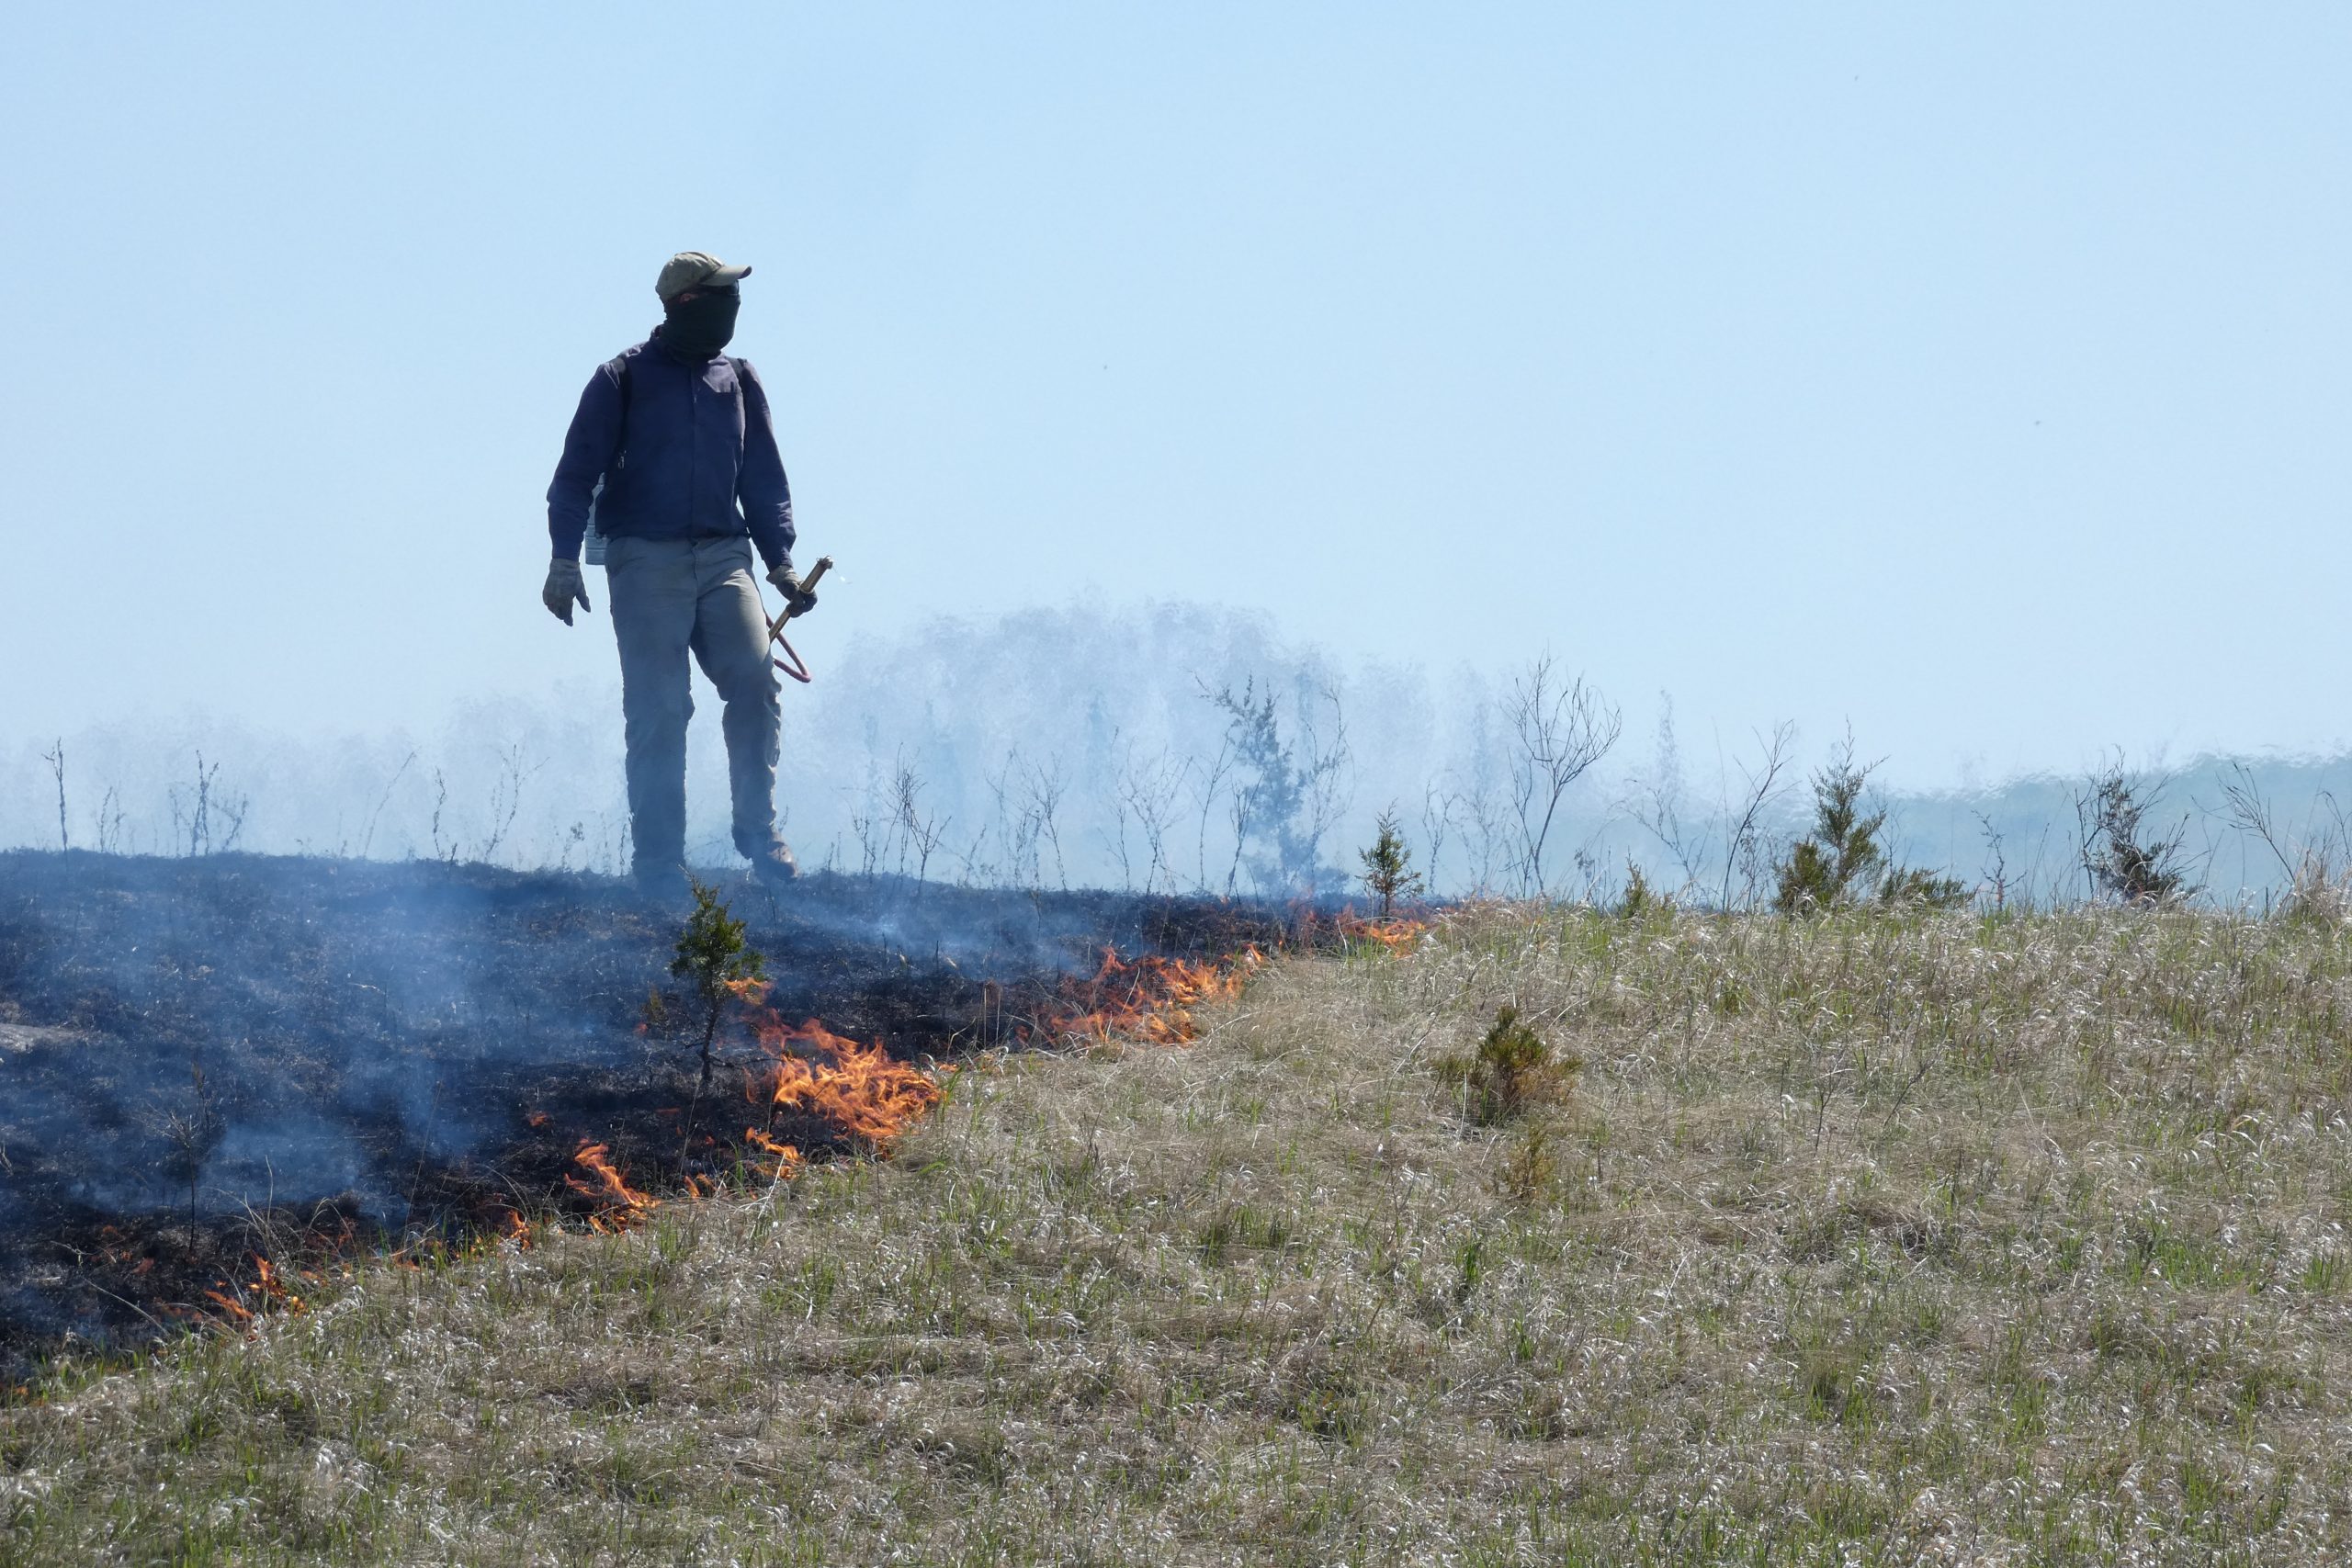
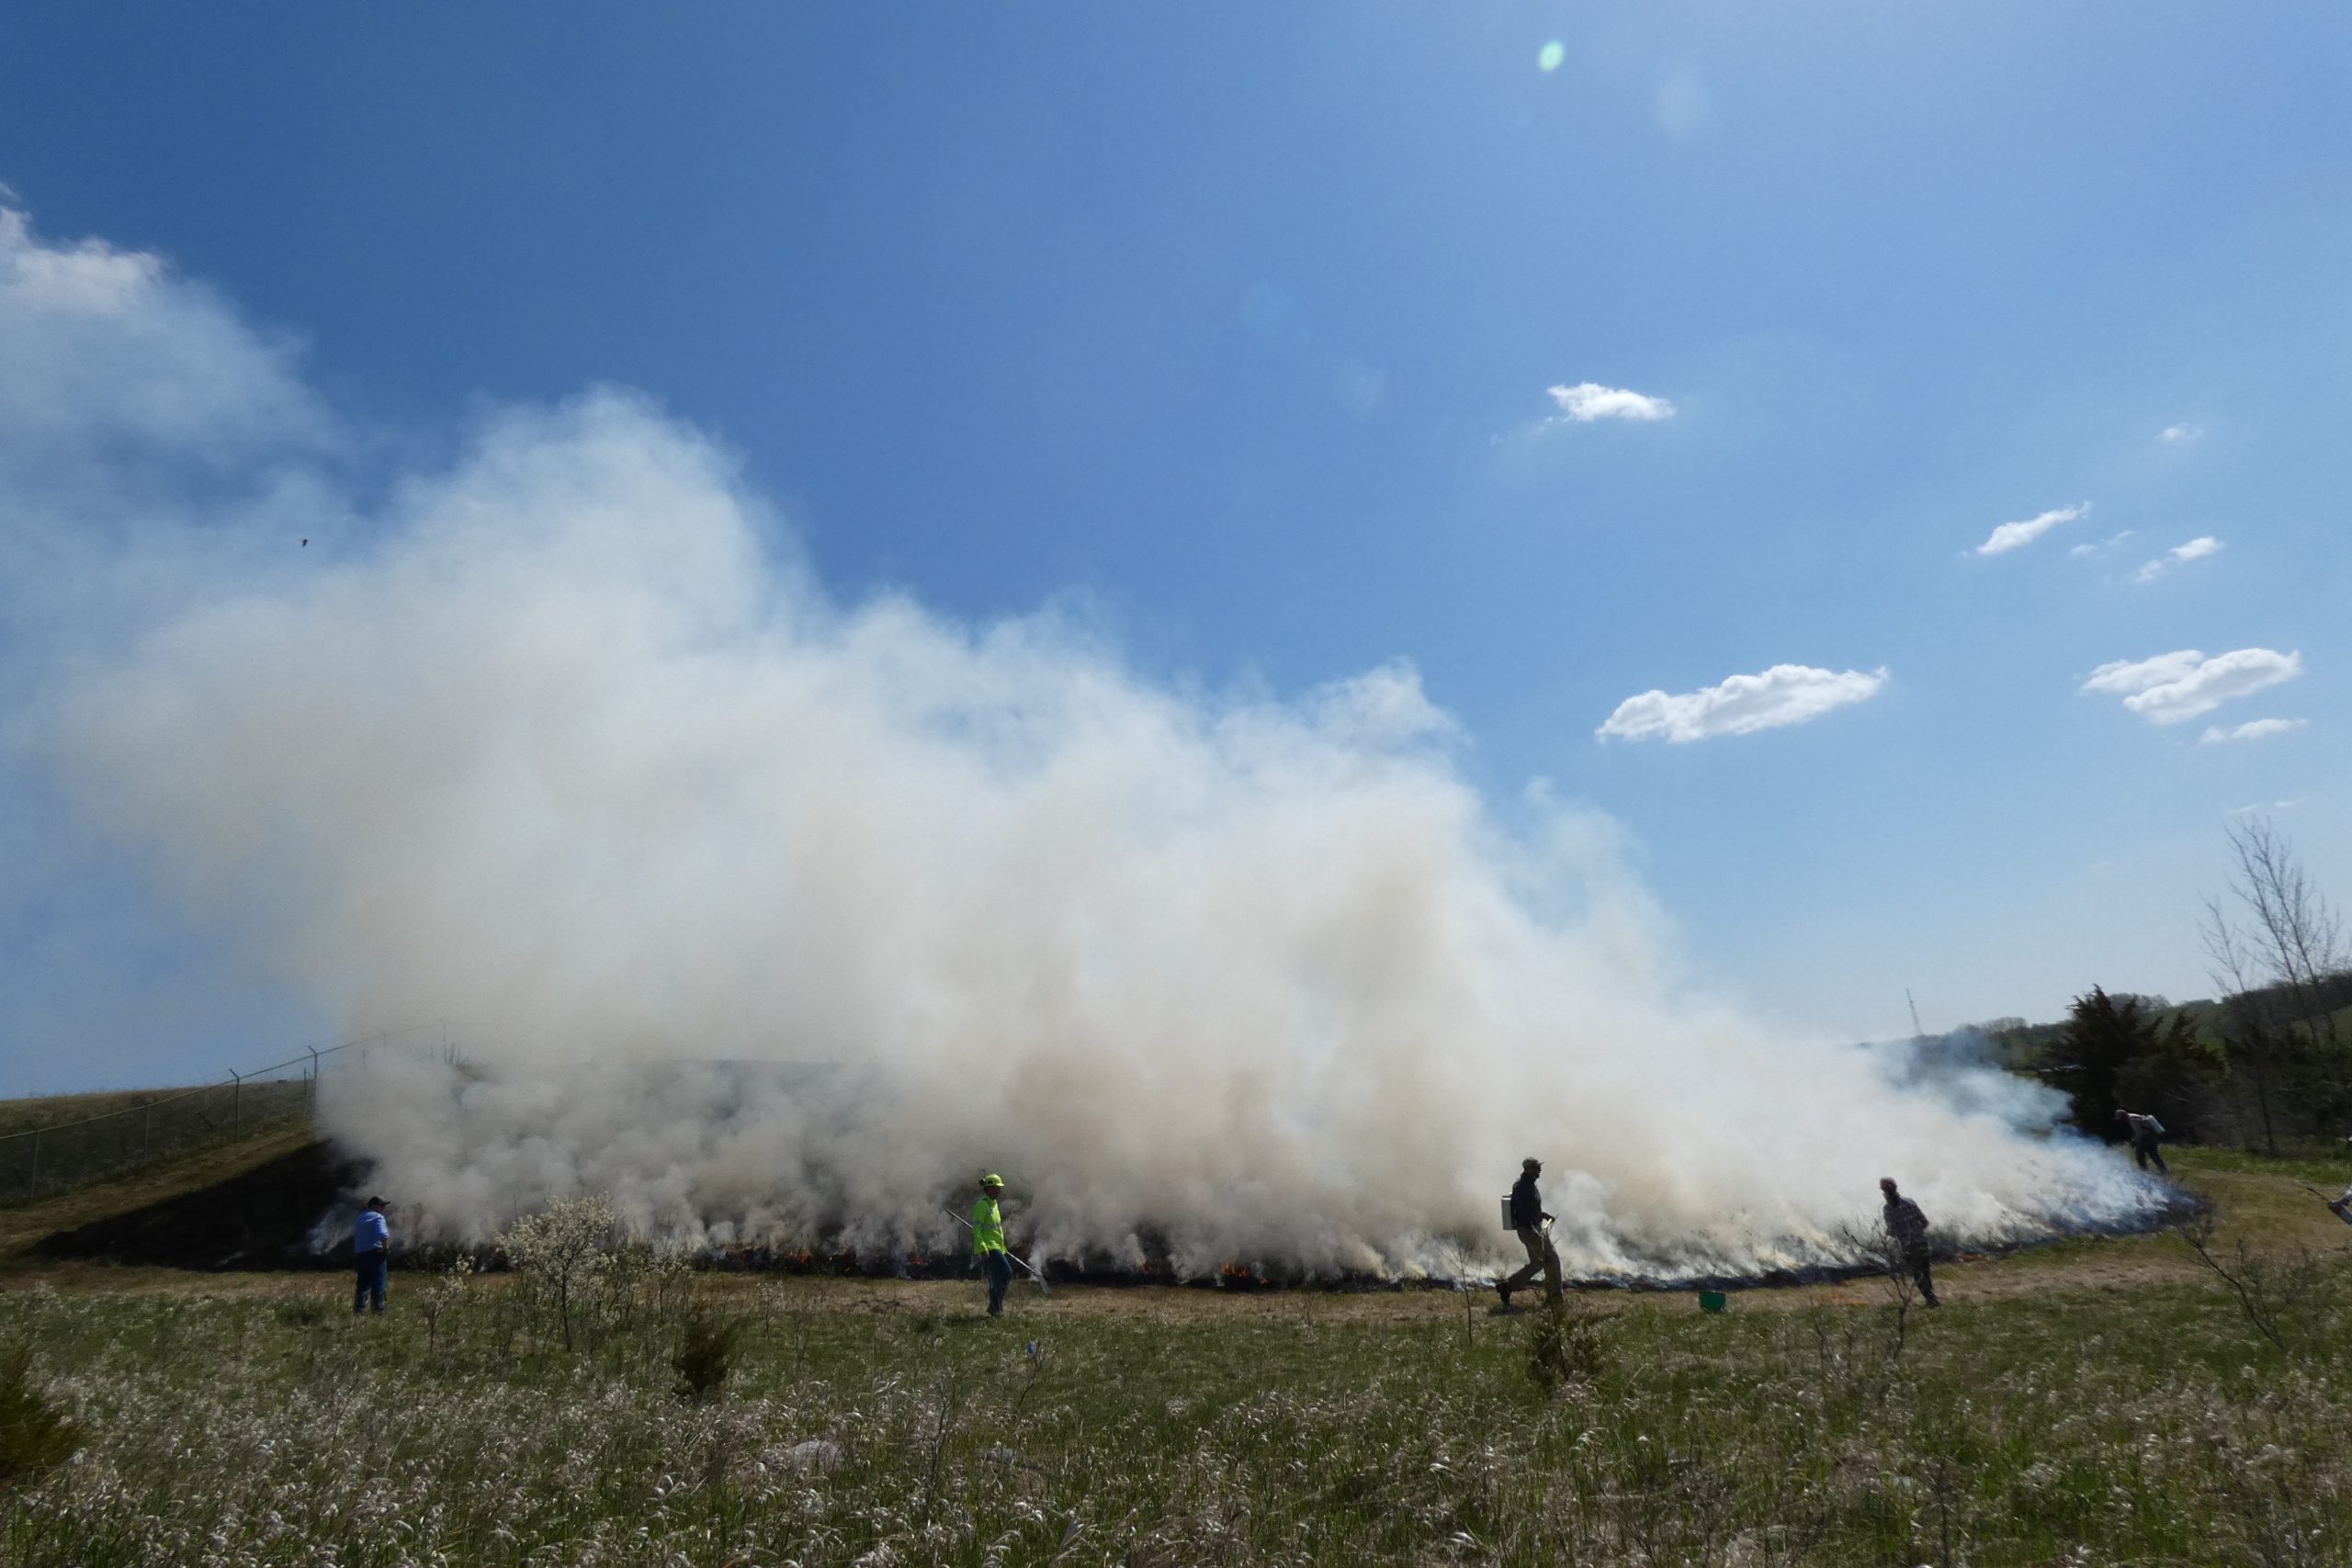
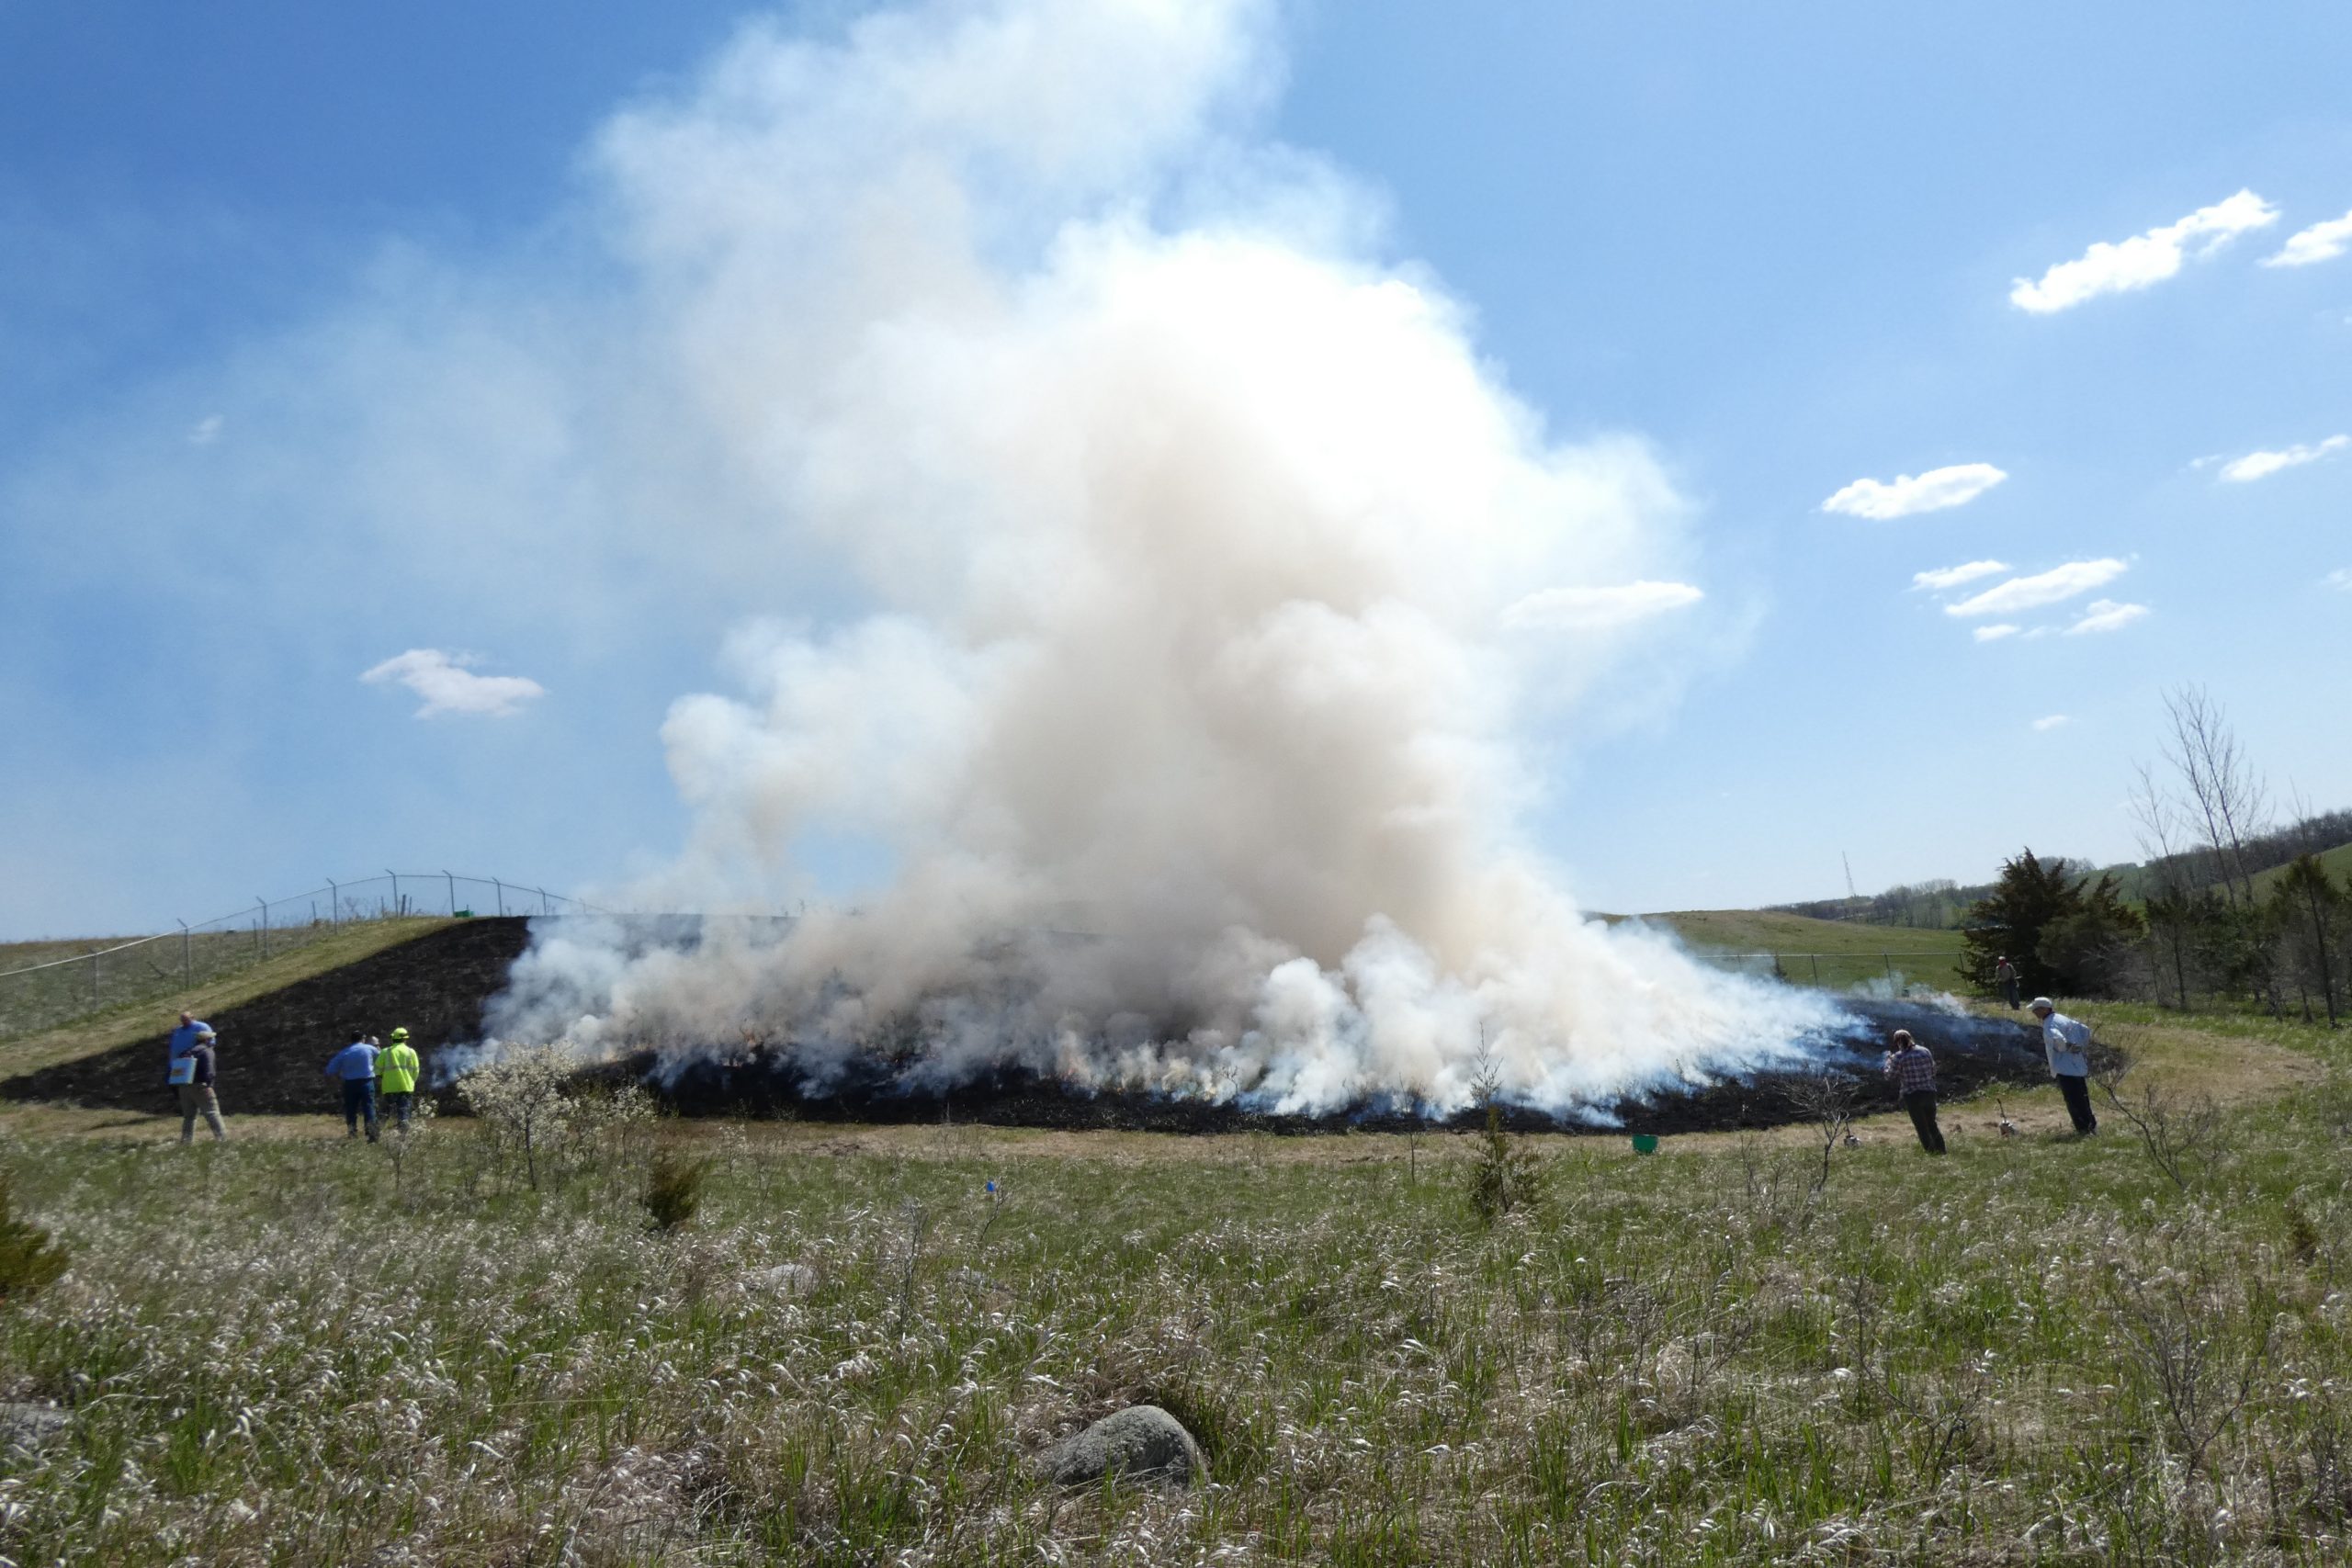
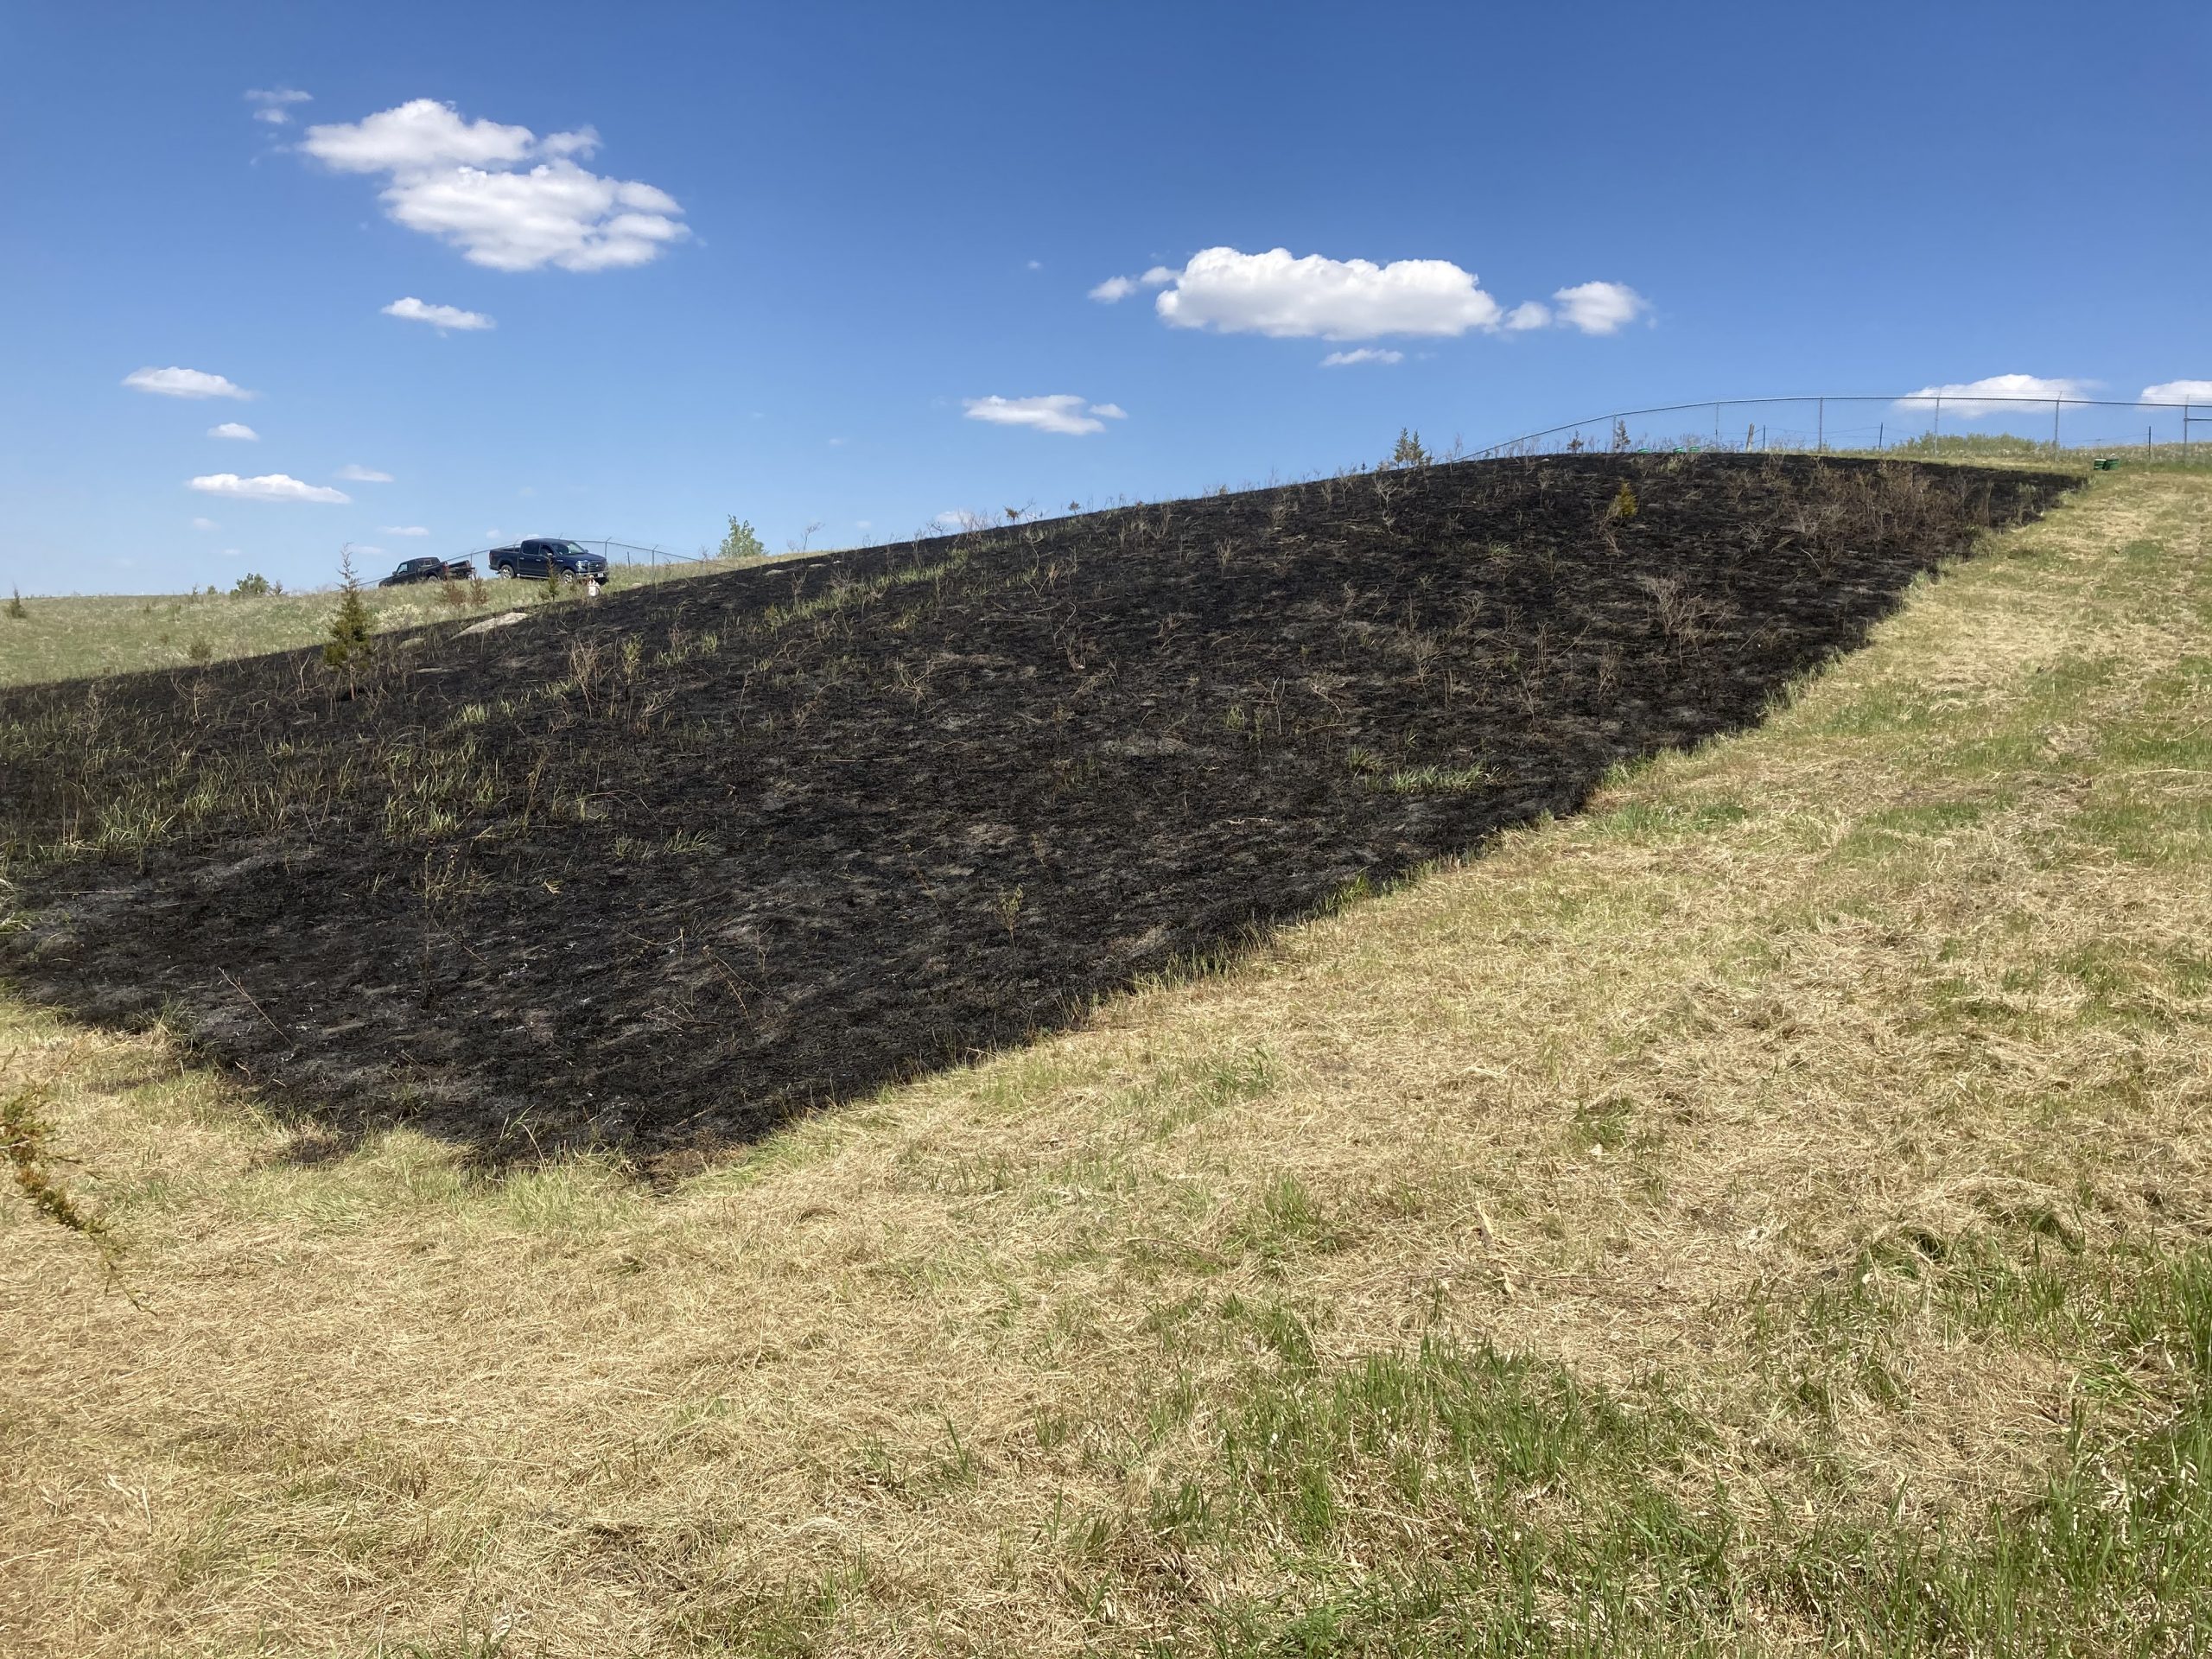
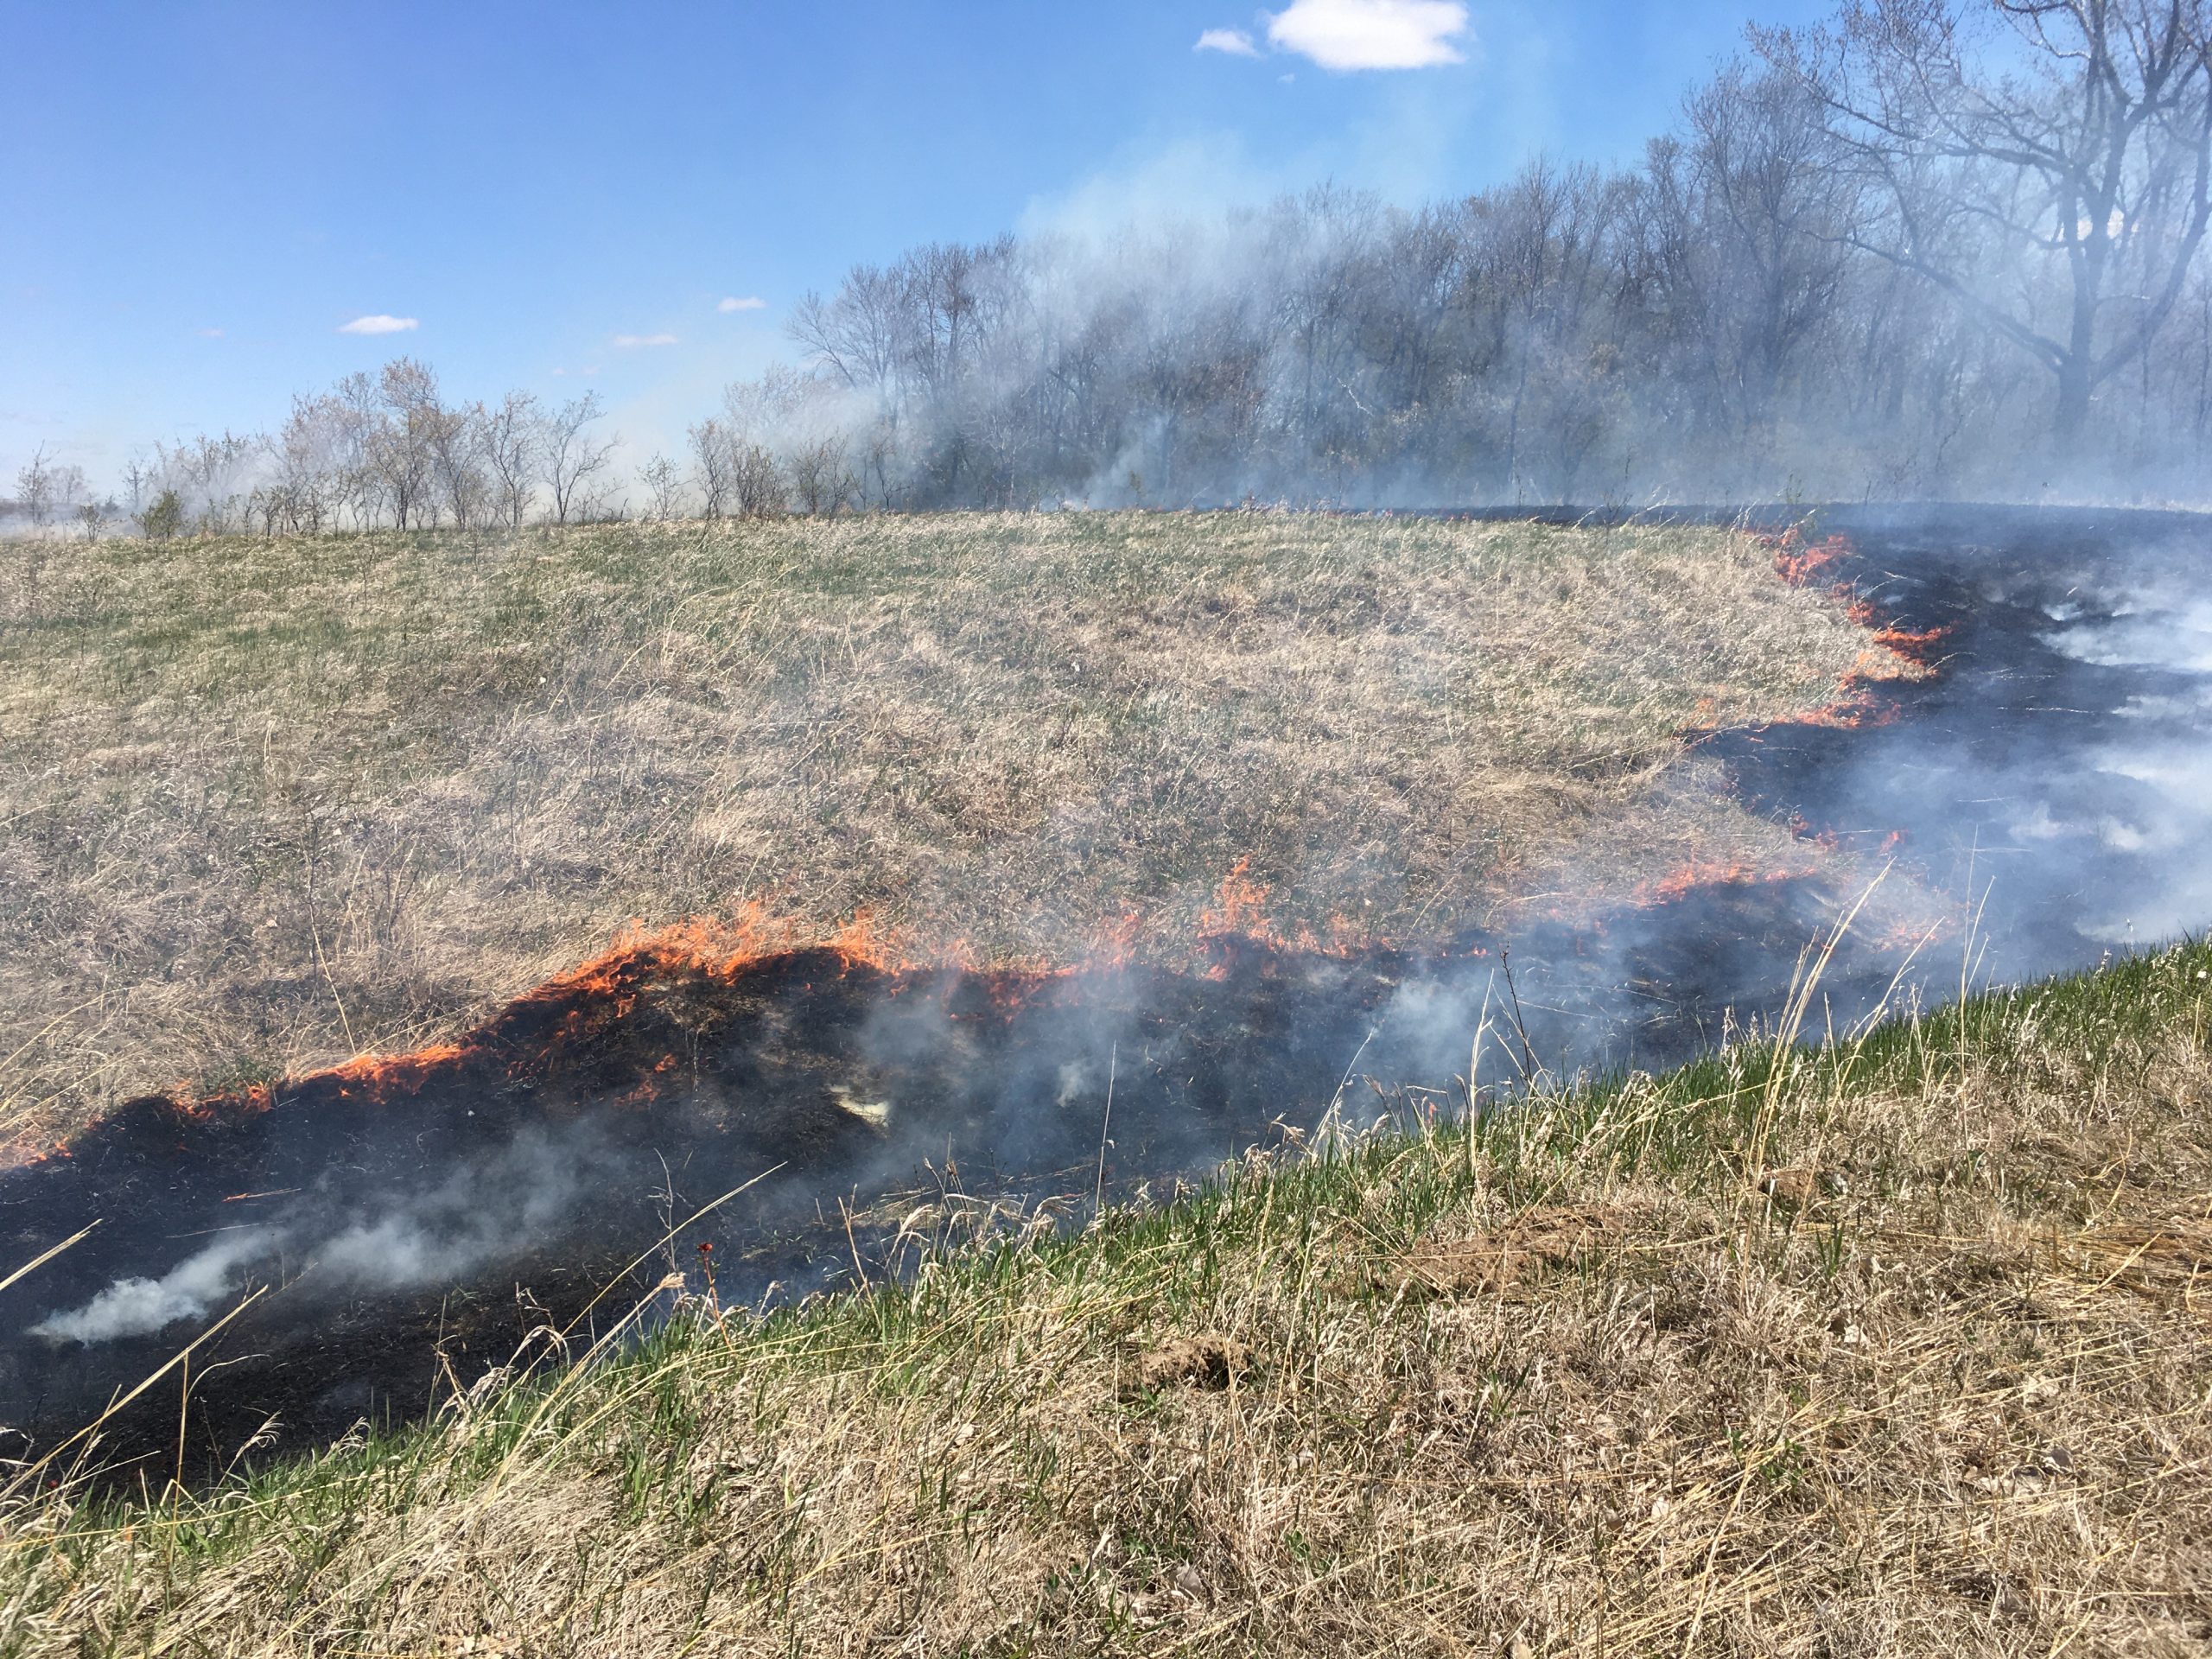
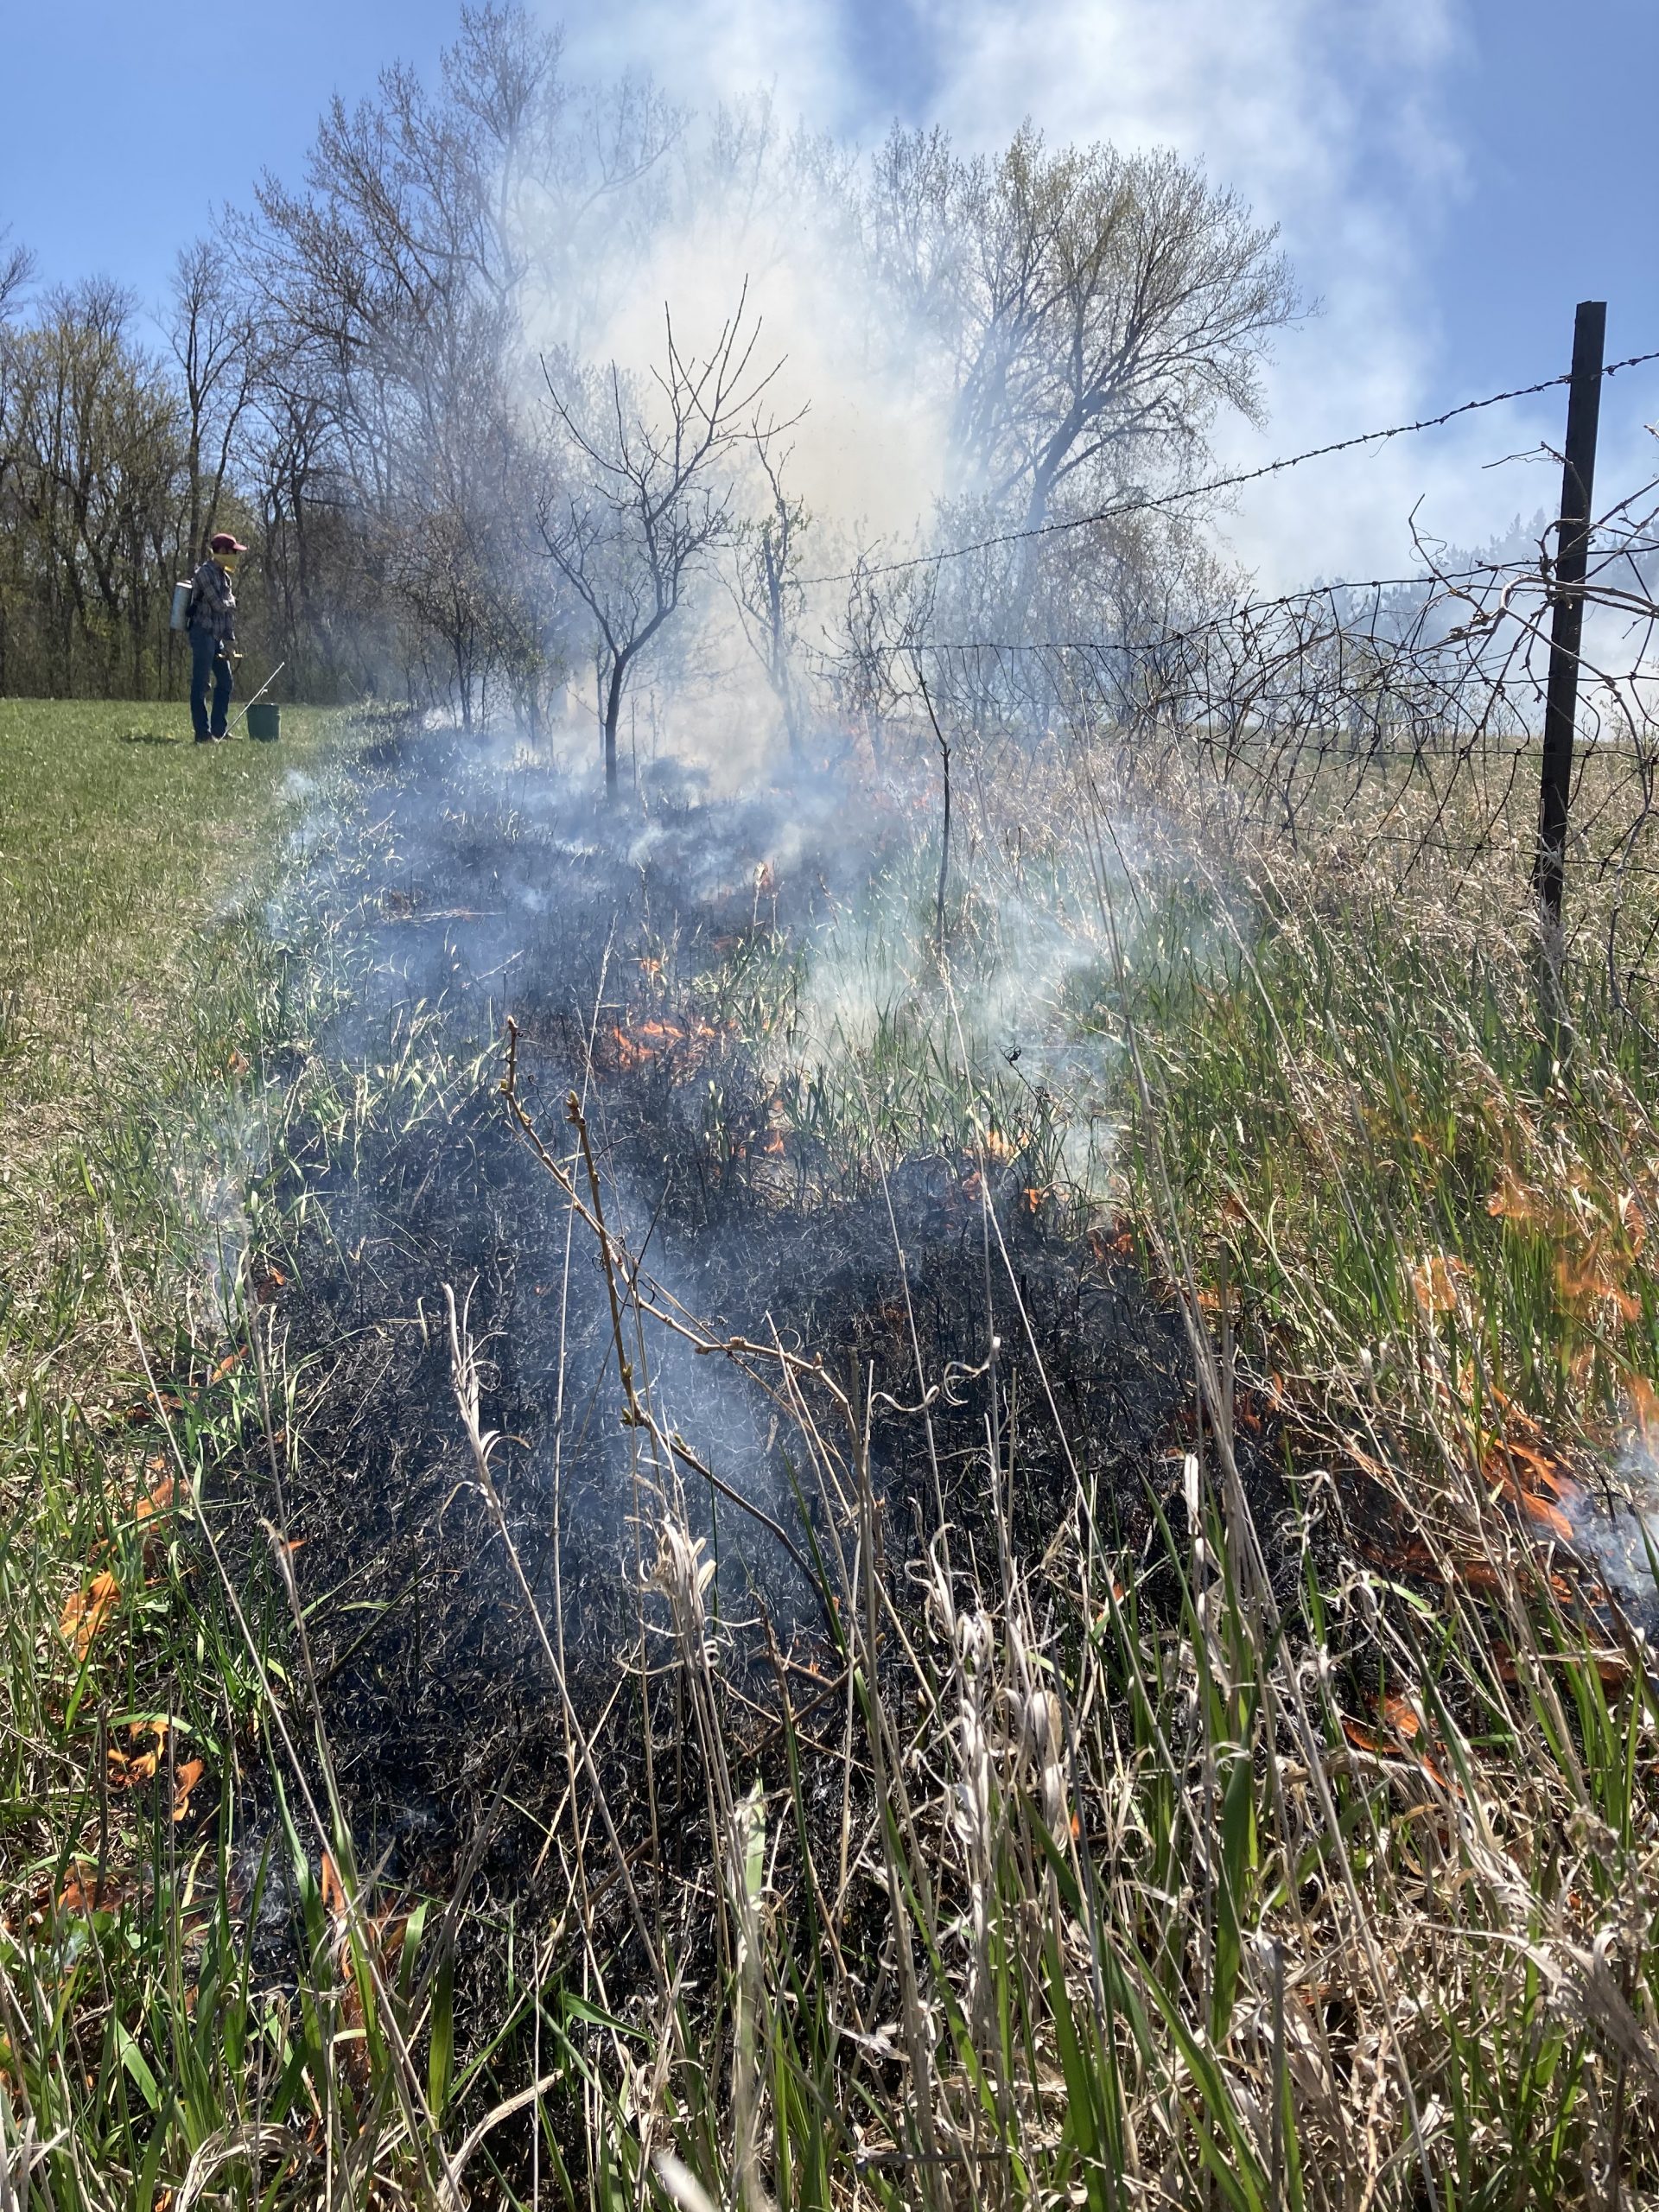
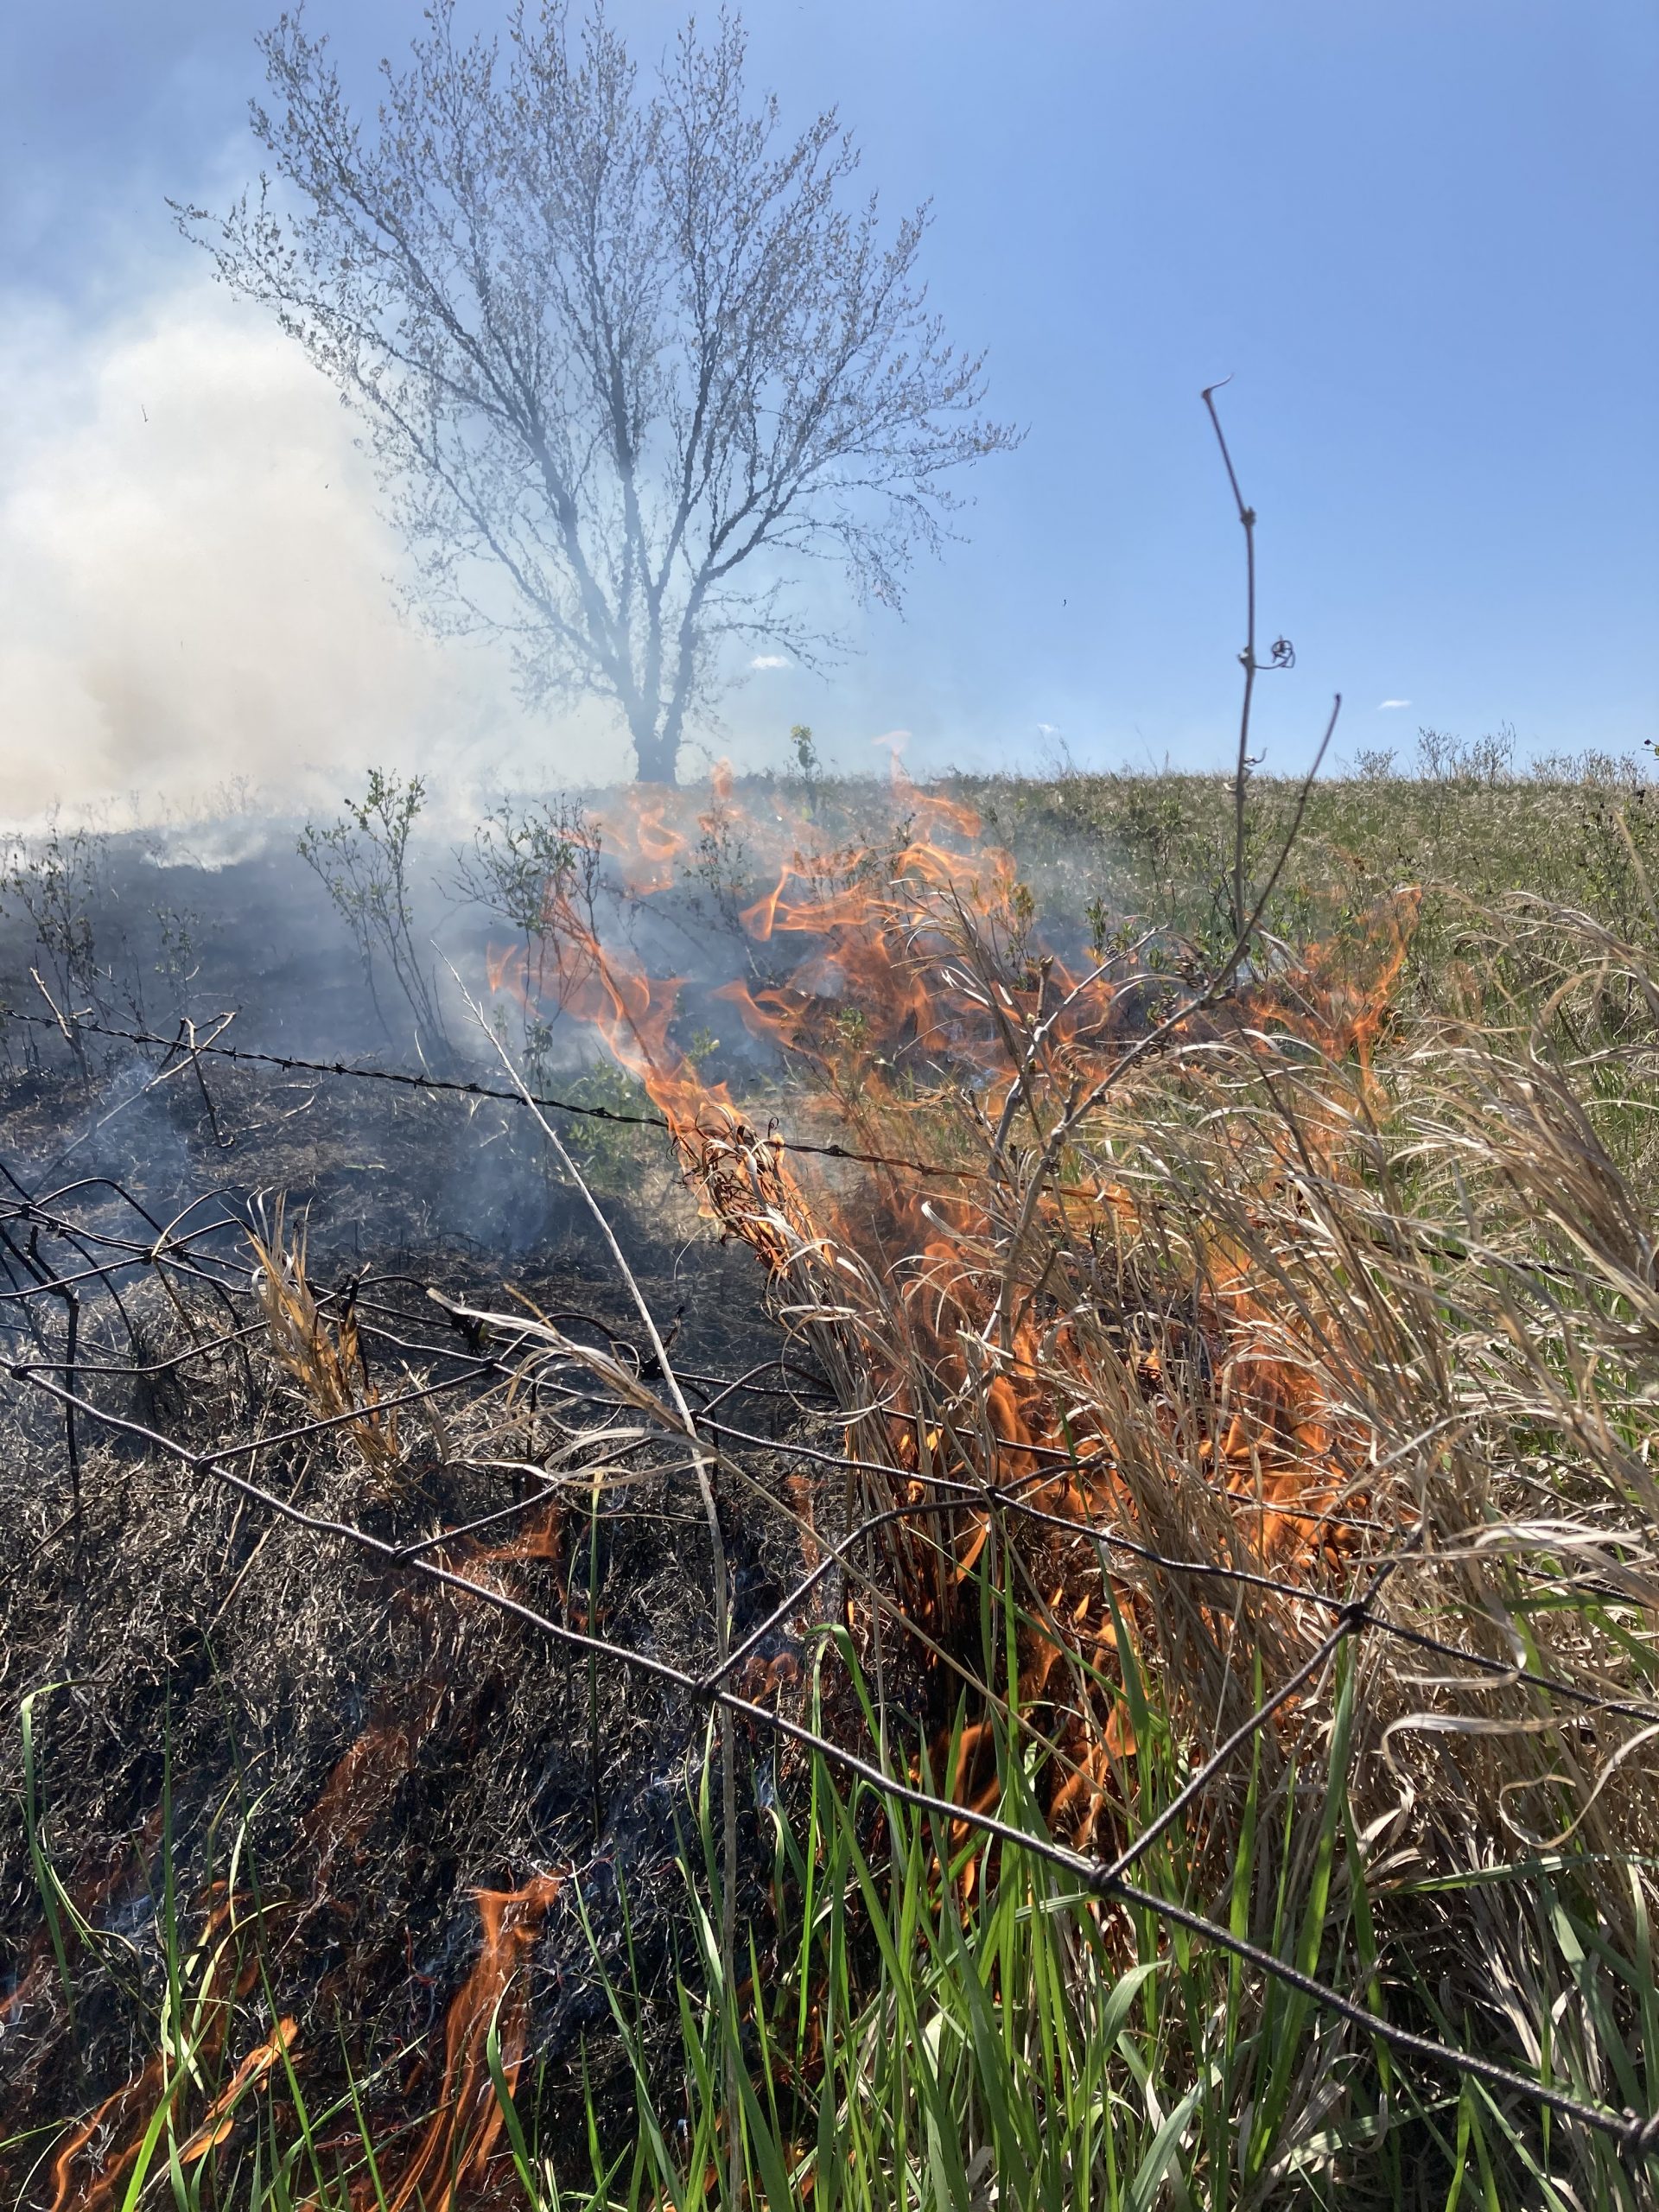
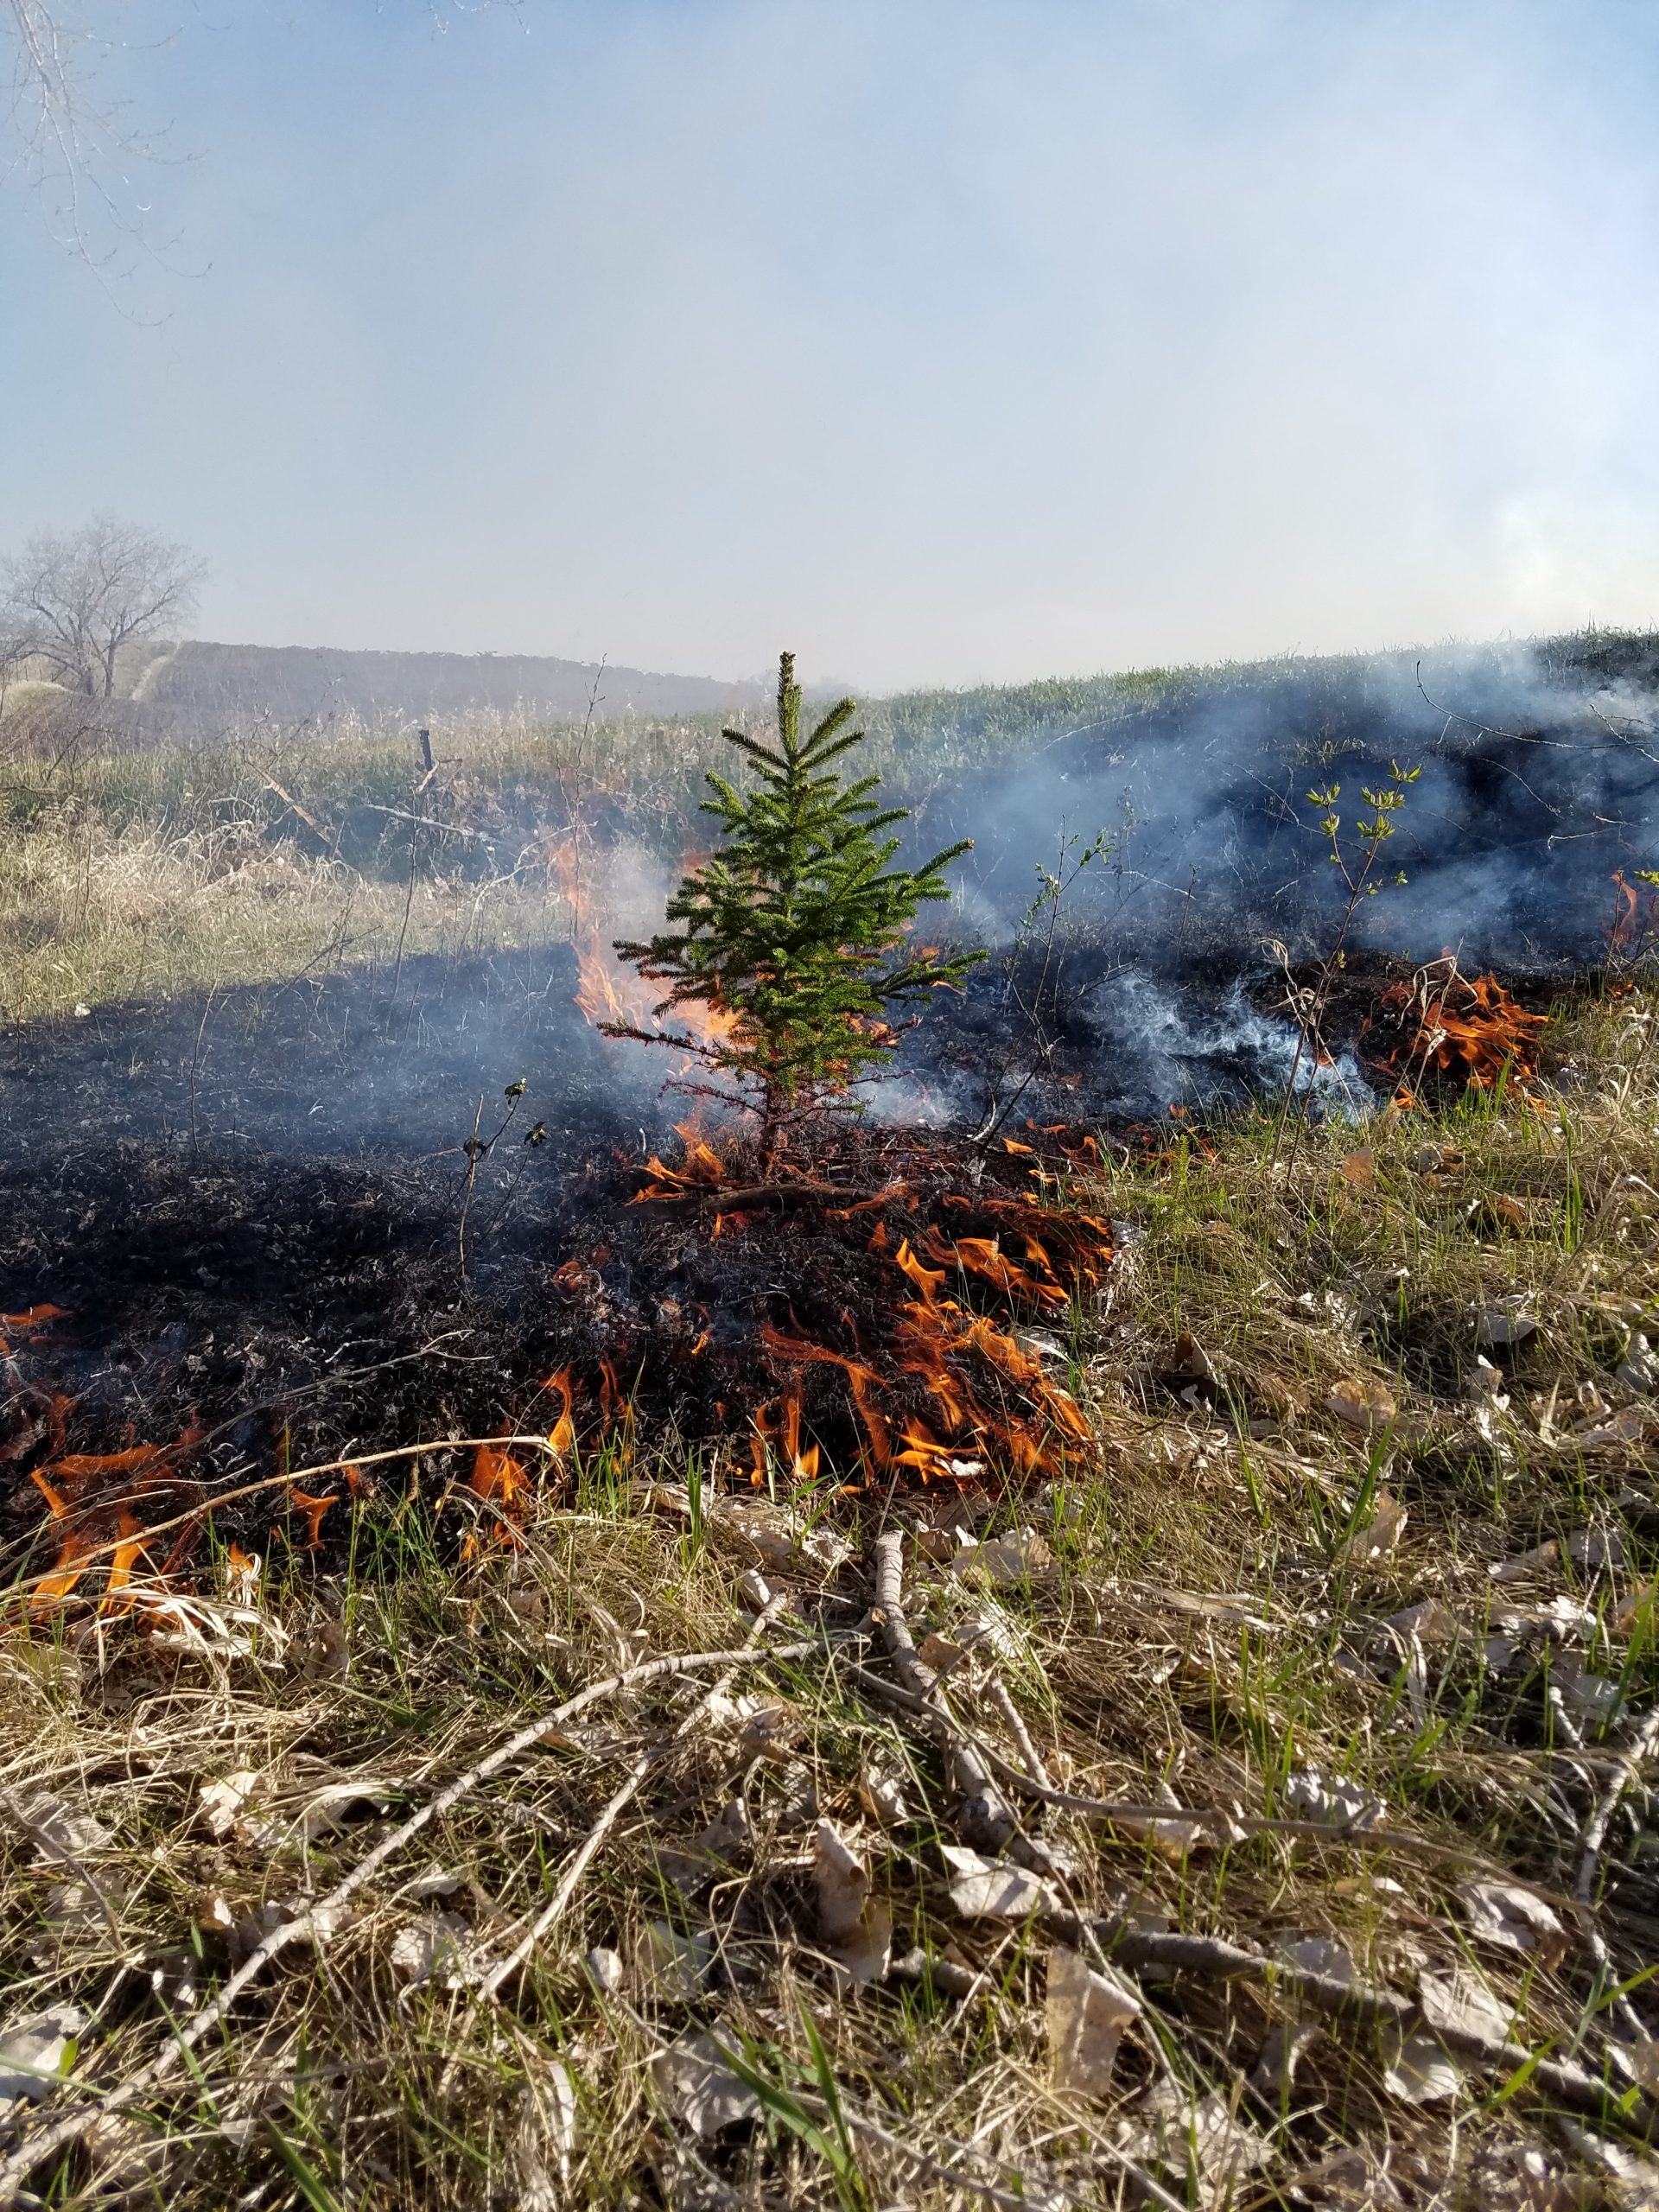
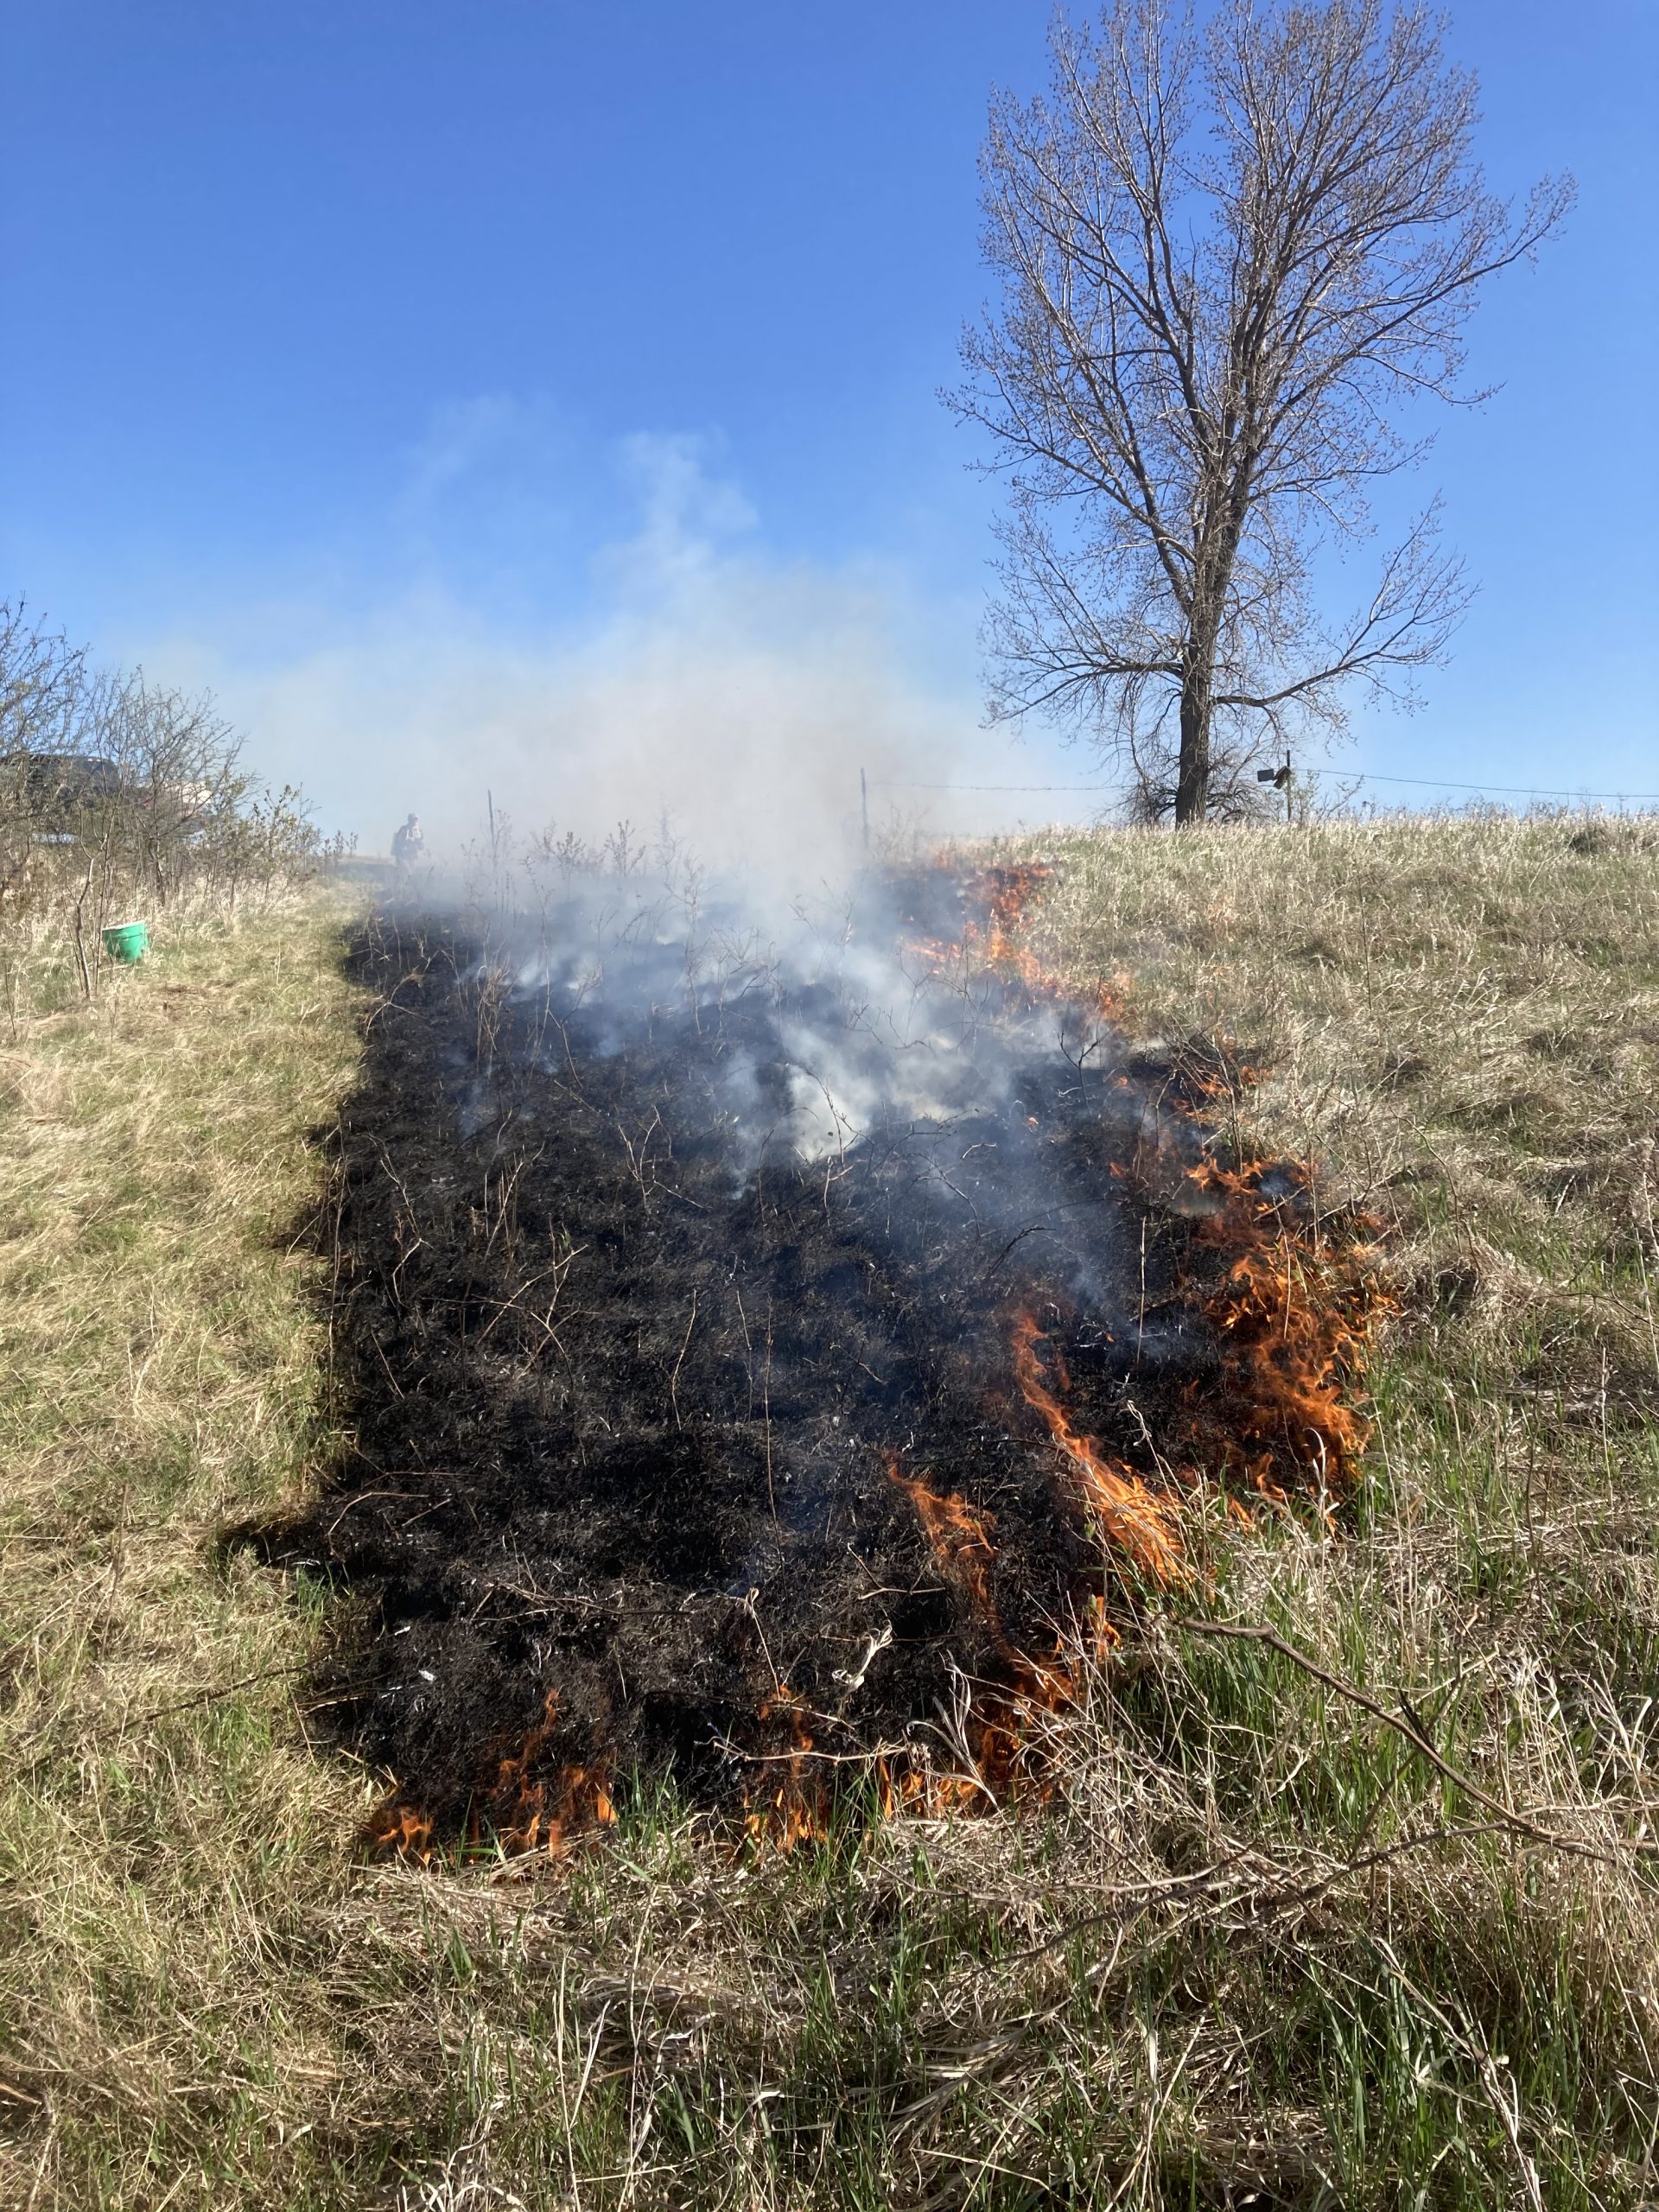
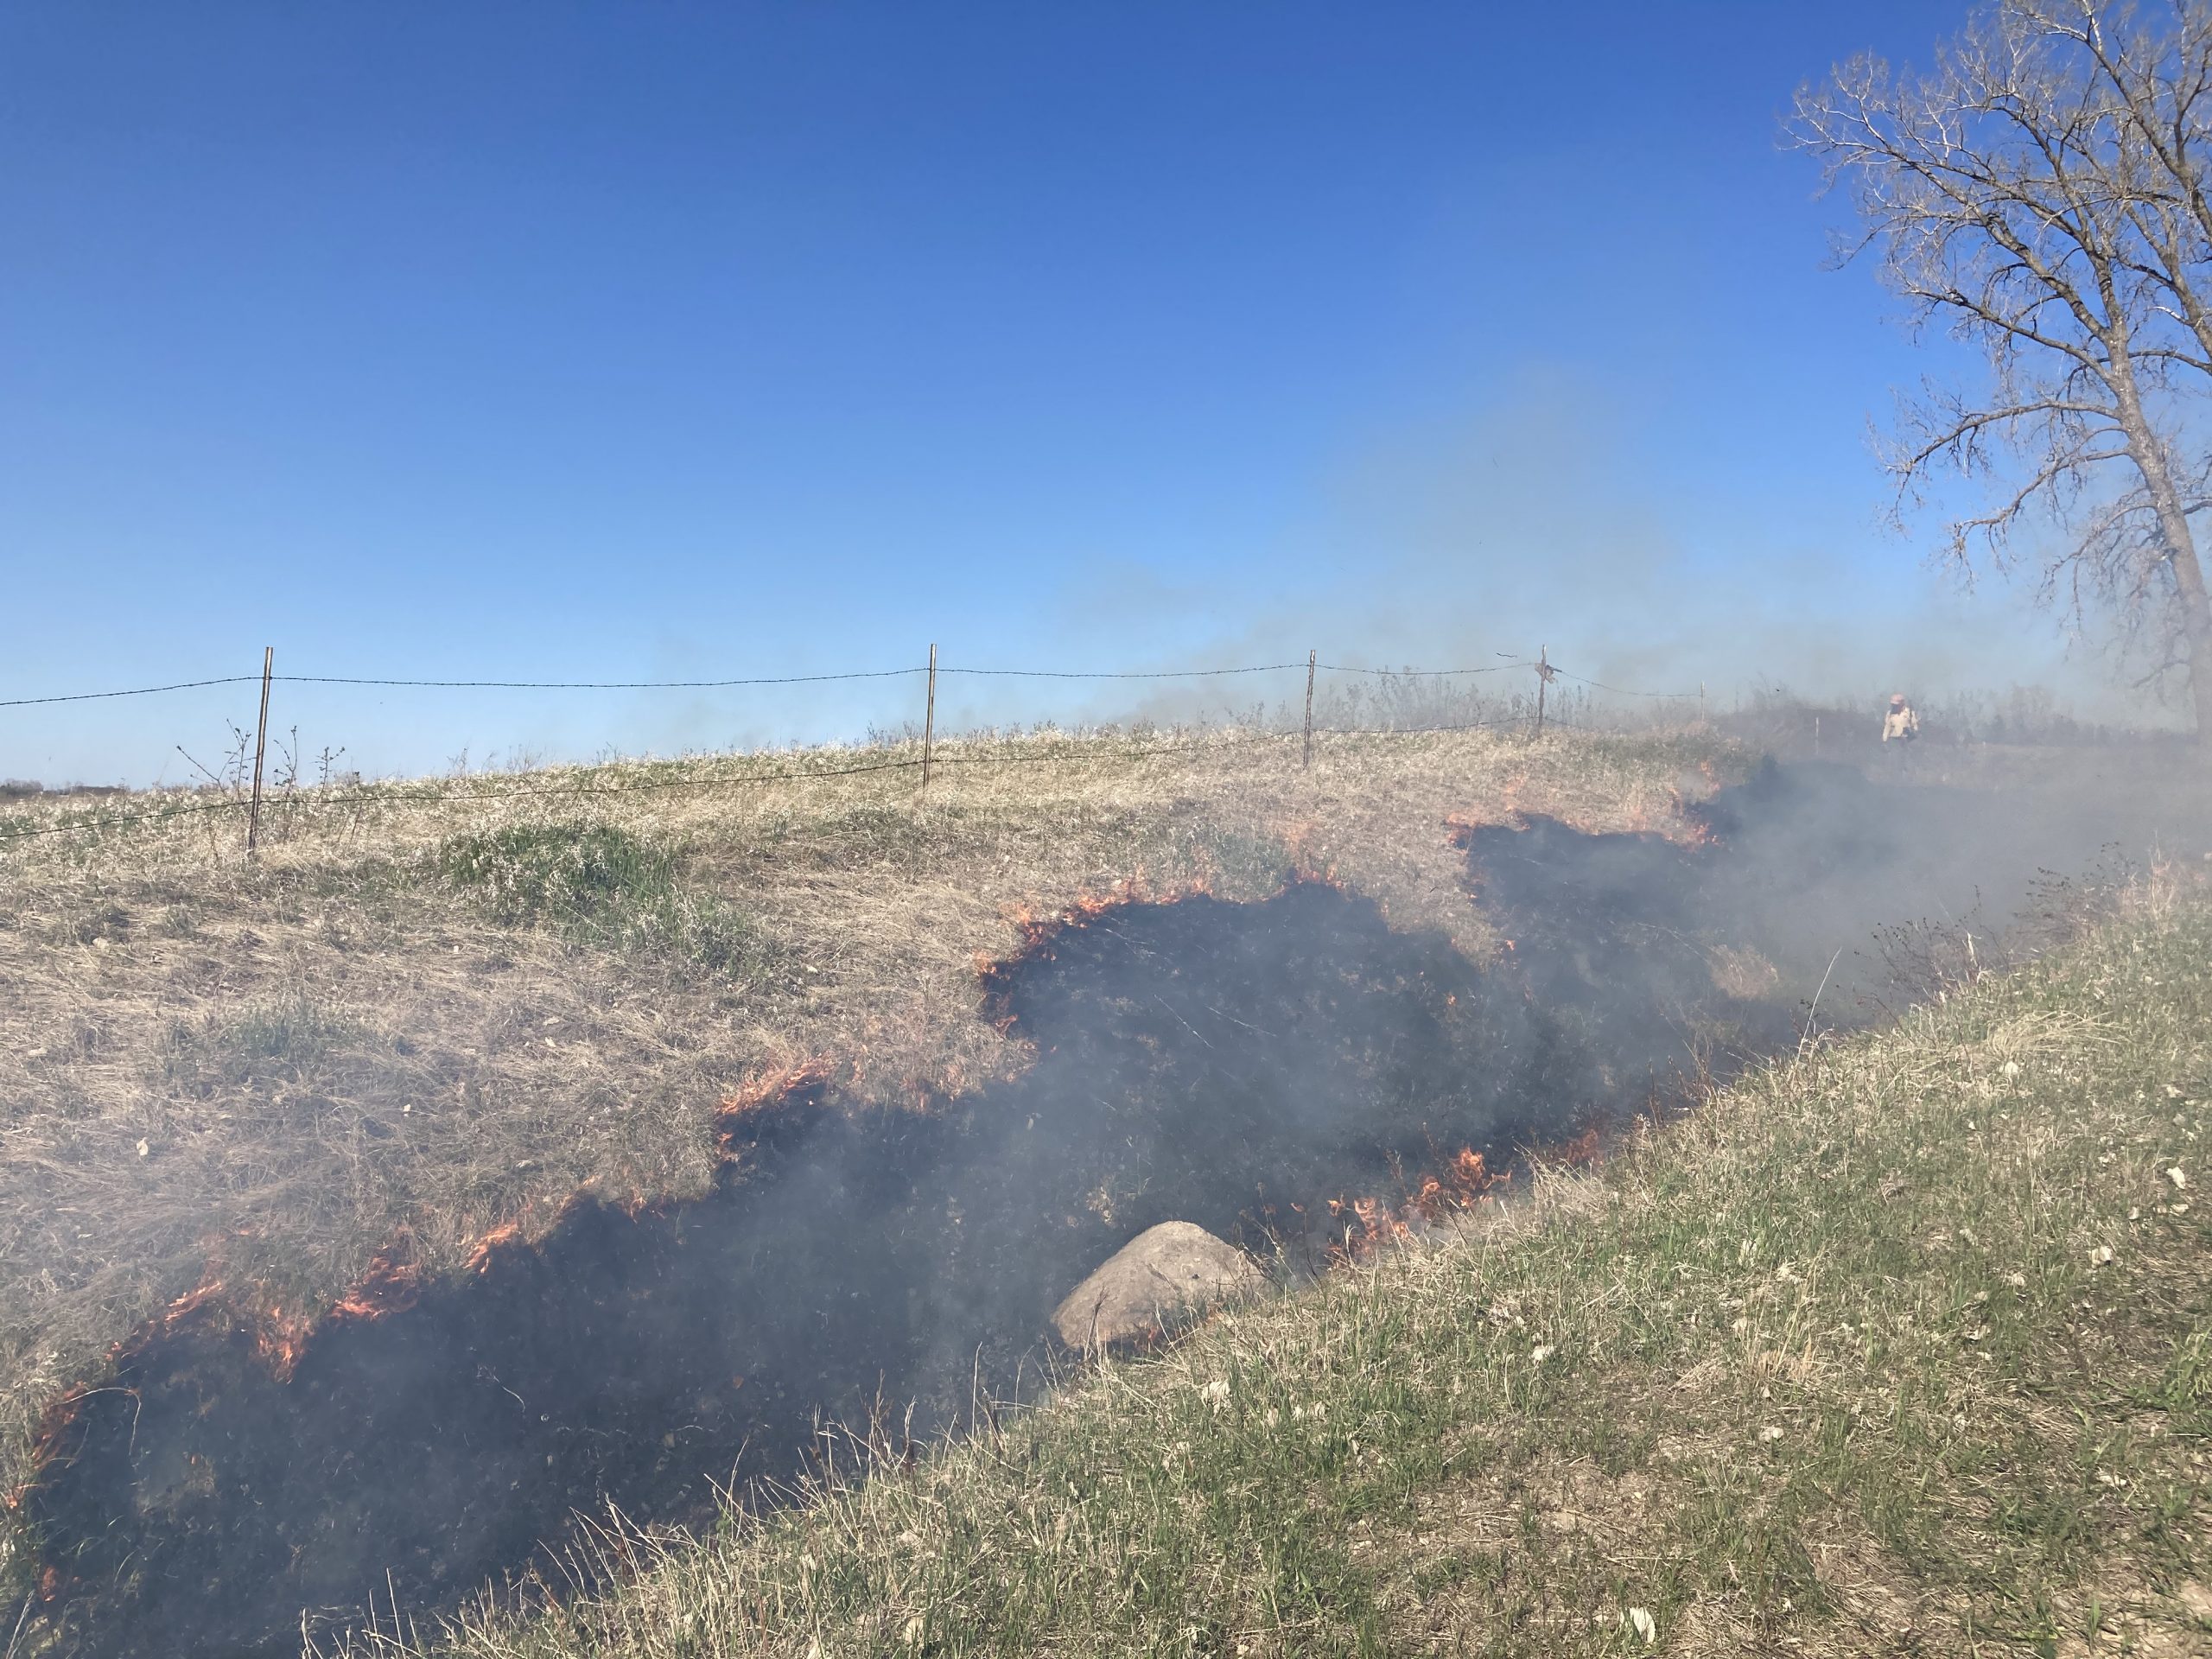
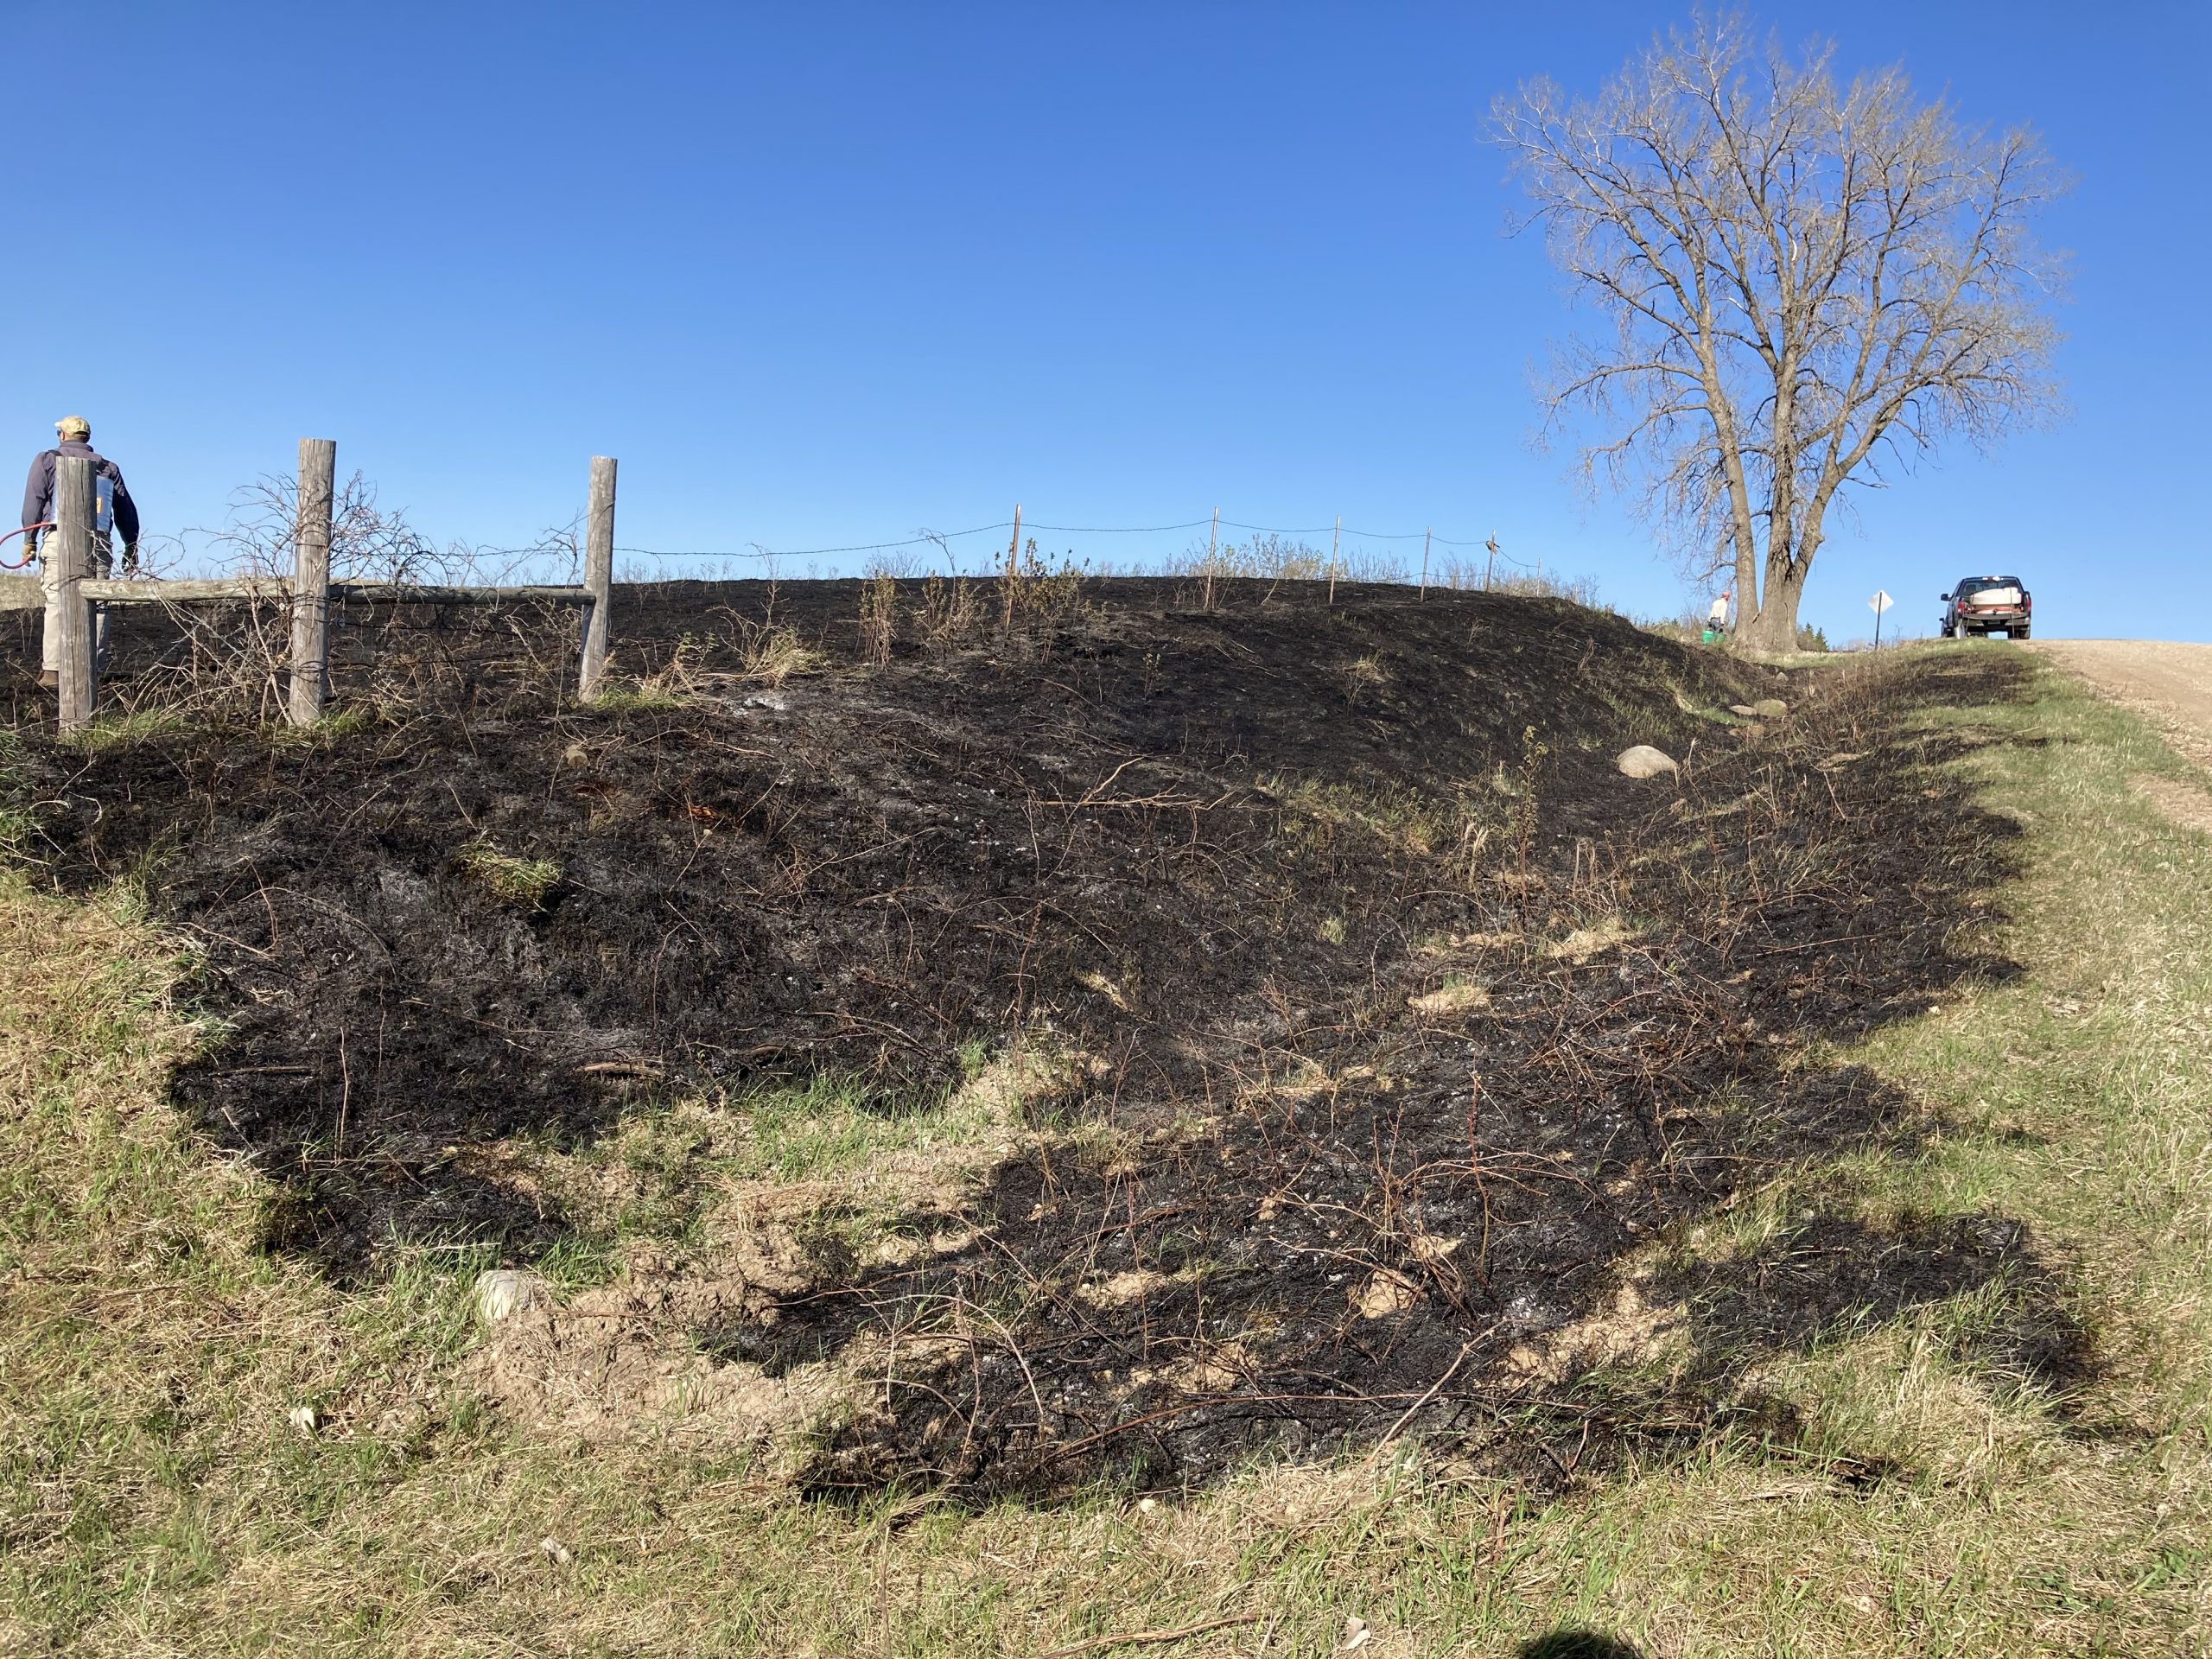
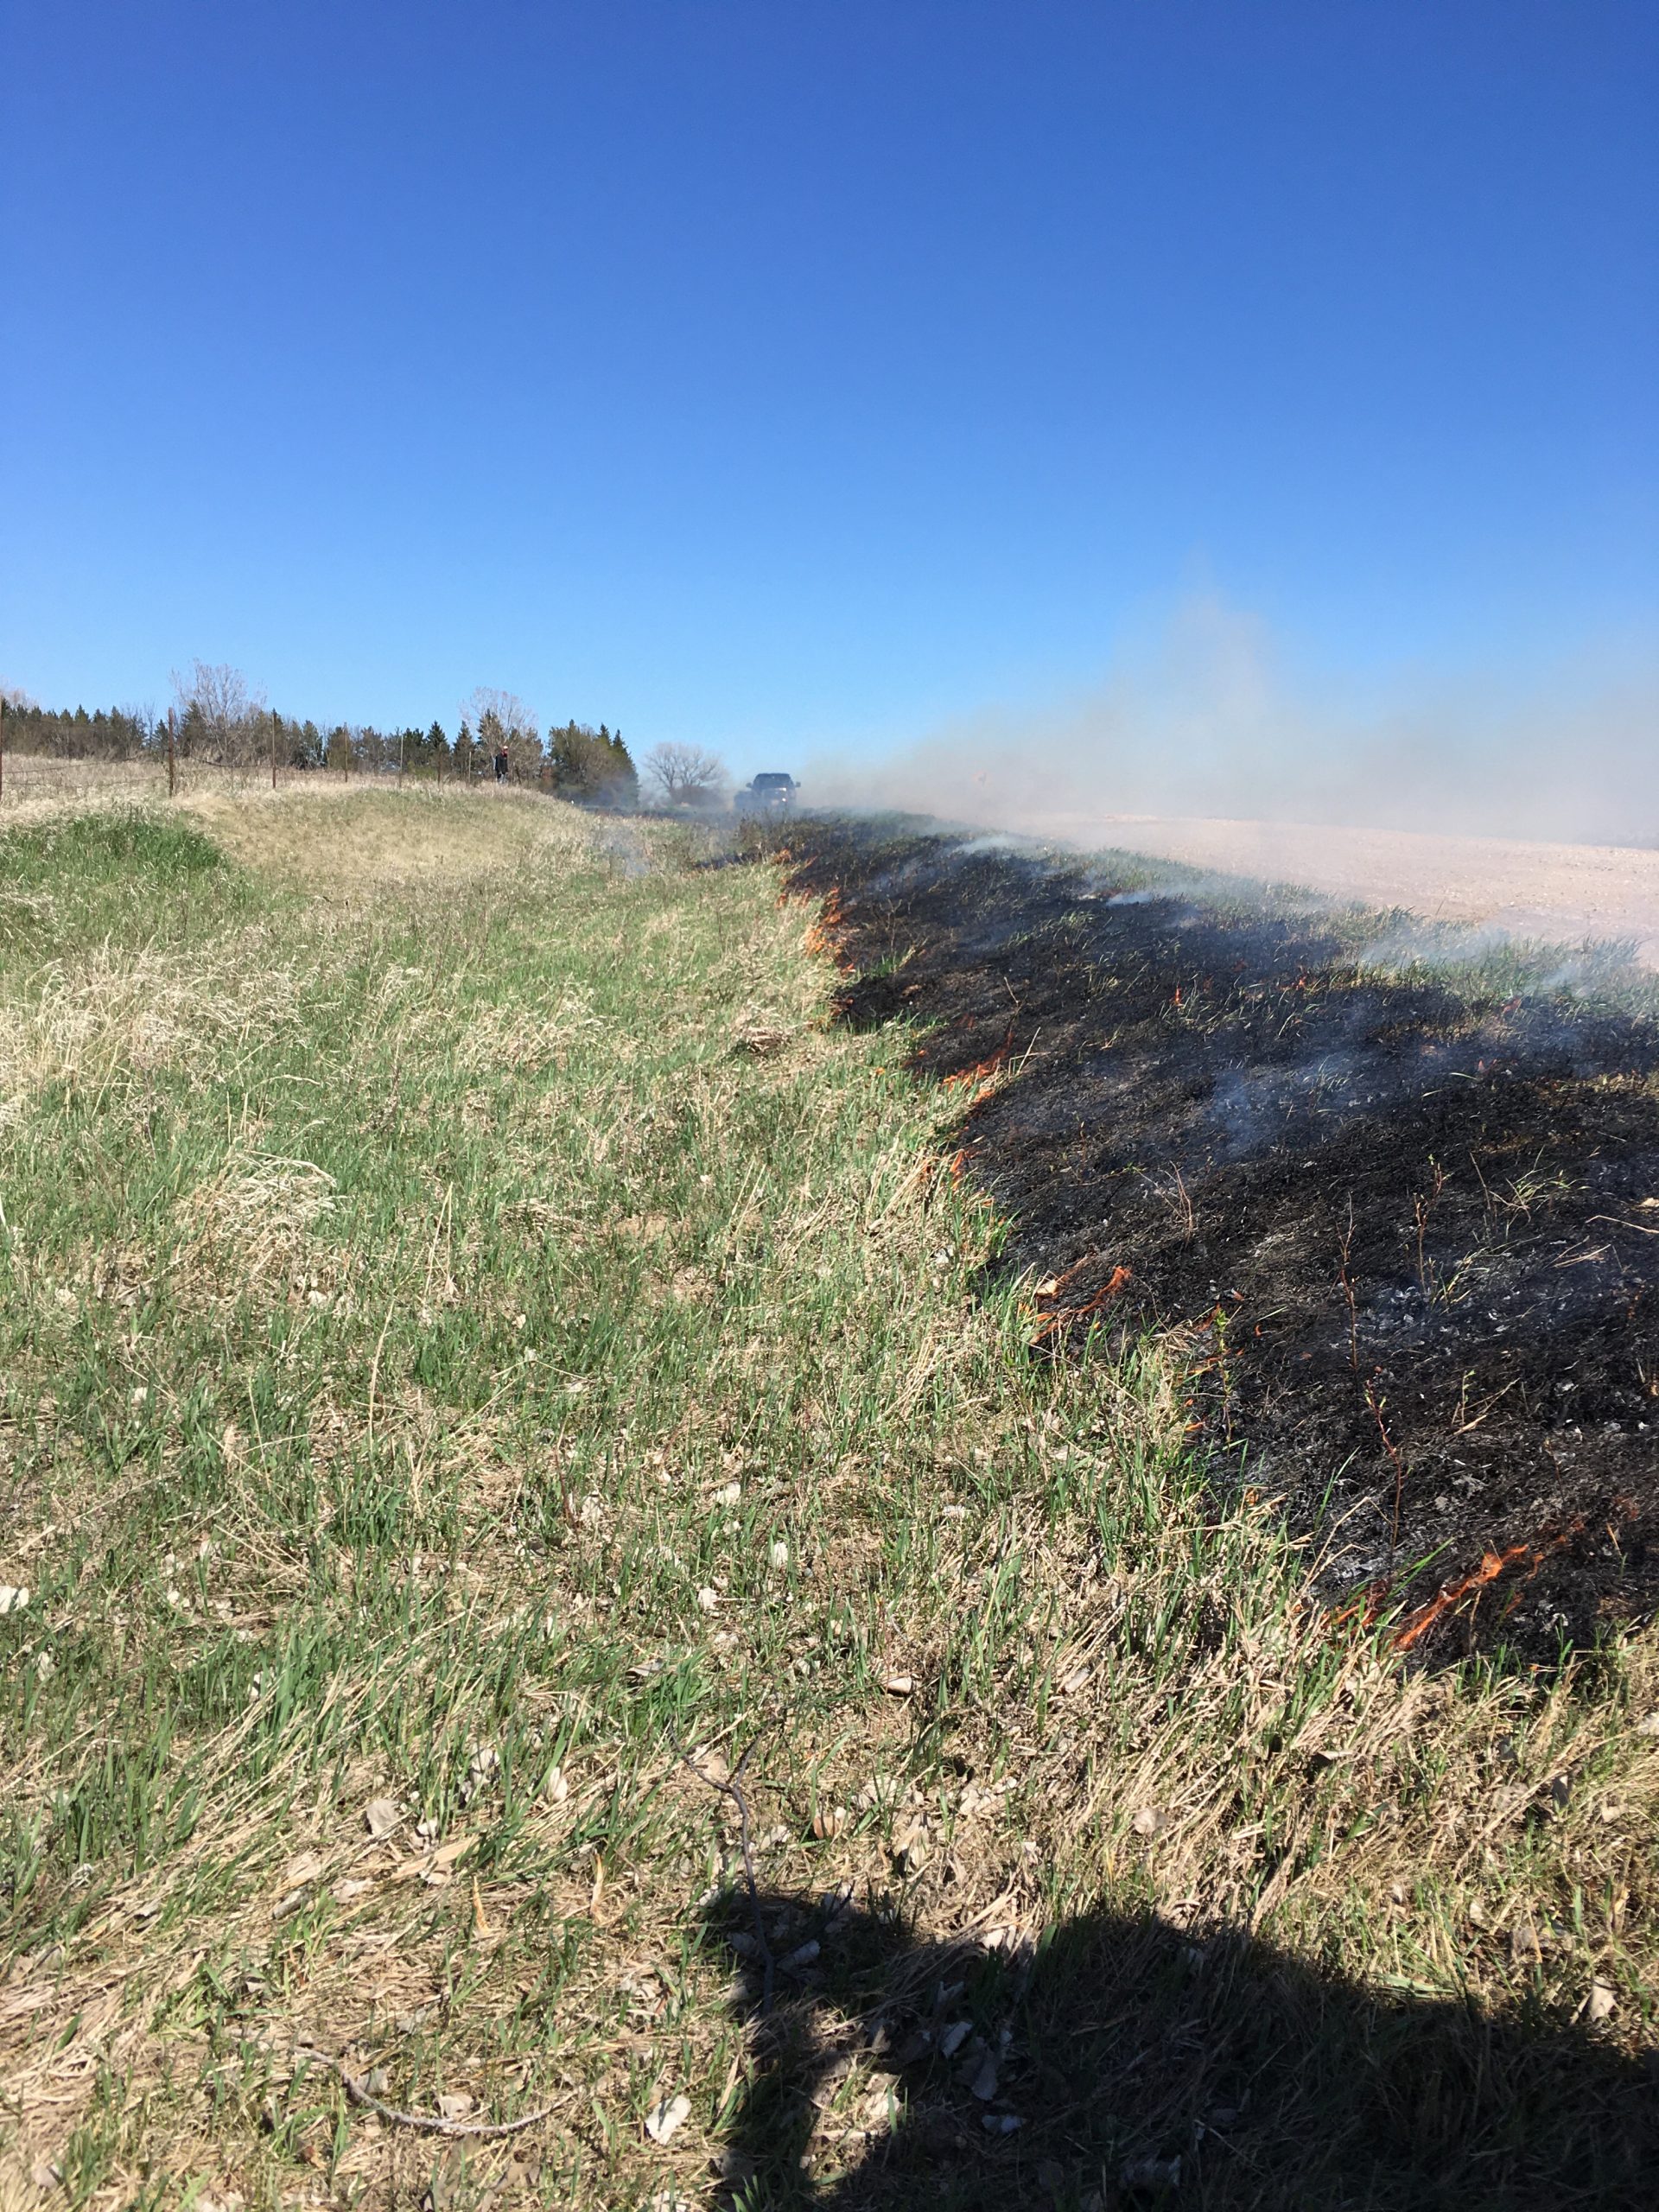
Once sufficient black had been established at the top of the hill and along the east and west edges of the burn unit, Amy W. and Brad D. ringed the unit with drip torches while all watched with great anticipation. The head fire was not nearly as fast or intense as we anticipated (maybe all the green brome grass?) but it sure was thorough! In just a couple minutes, the head fire and backing fire met in the southwest quarter of the burn unit producing a spectacular cloud of smoke and a uniformly blackened burn unit. Exactly as planned! It will be exciting to watch the east hill green up and I am eager to see what prairie plants have been sheltering below the dense thatch, just waiting for some fire and a little light to make their encore.
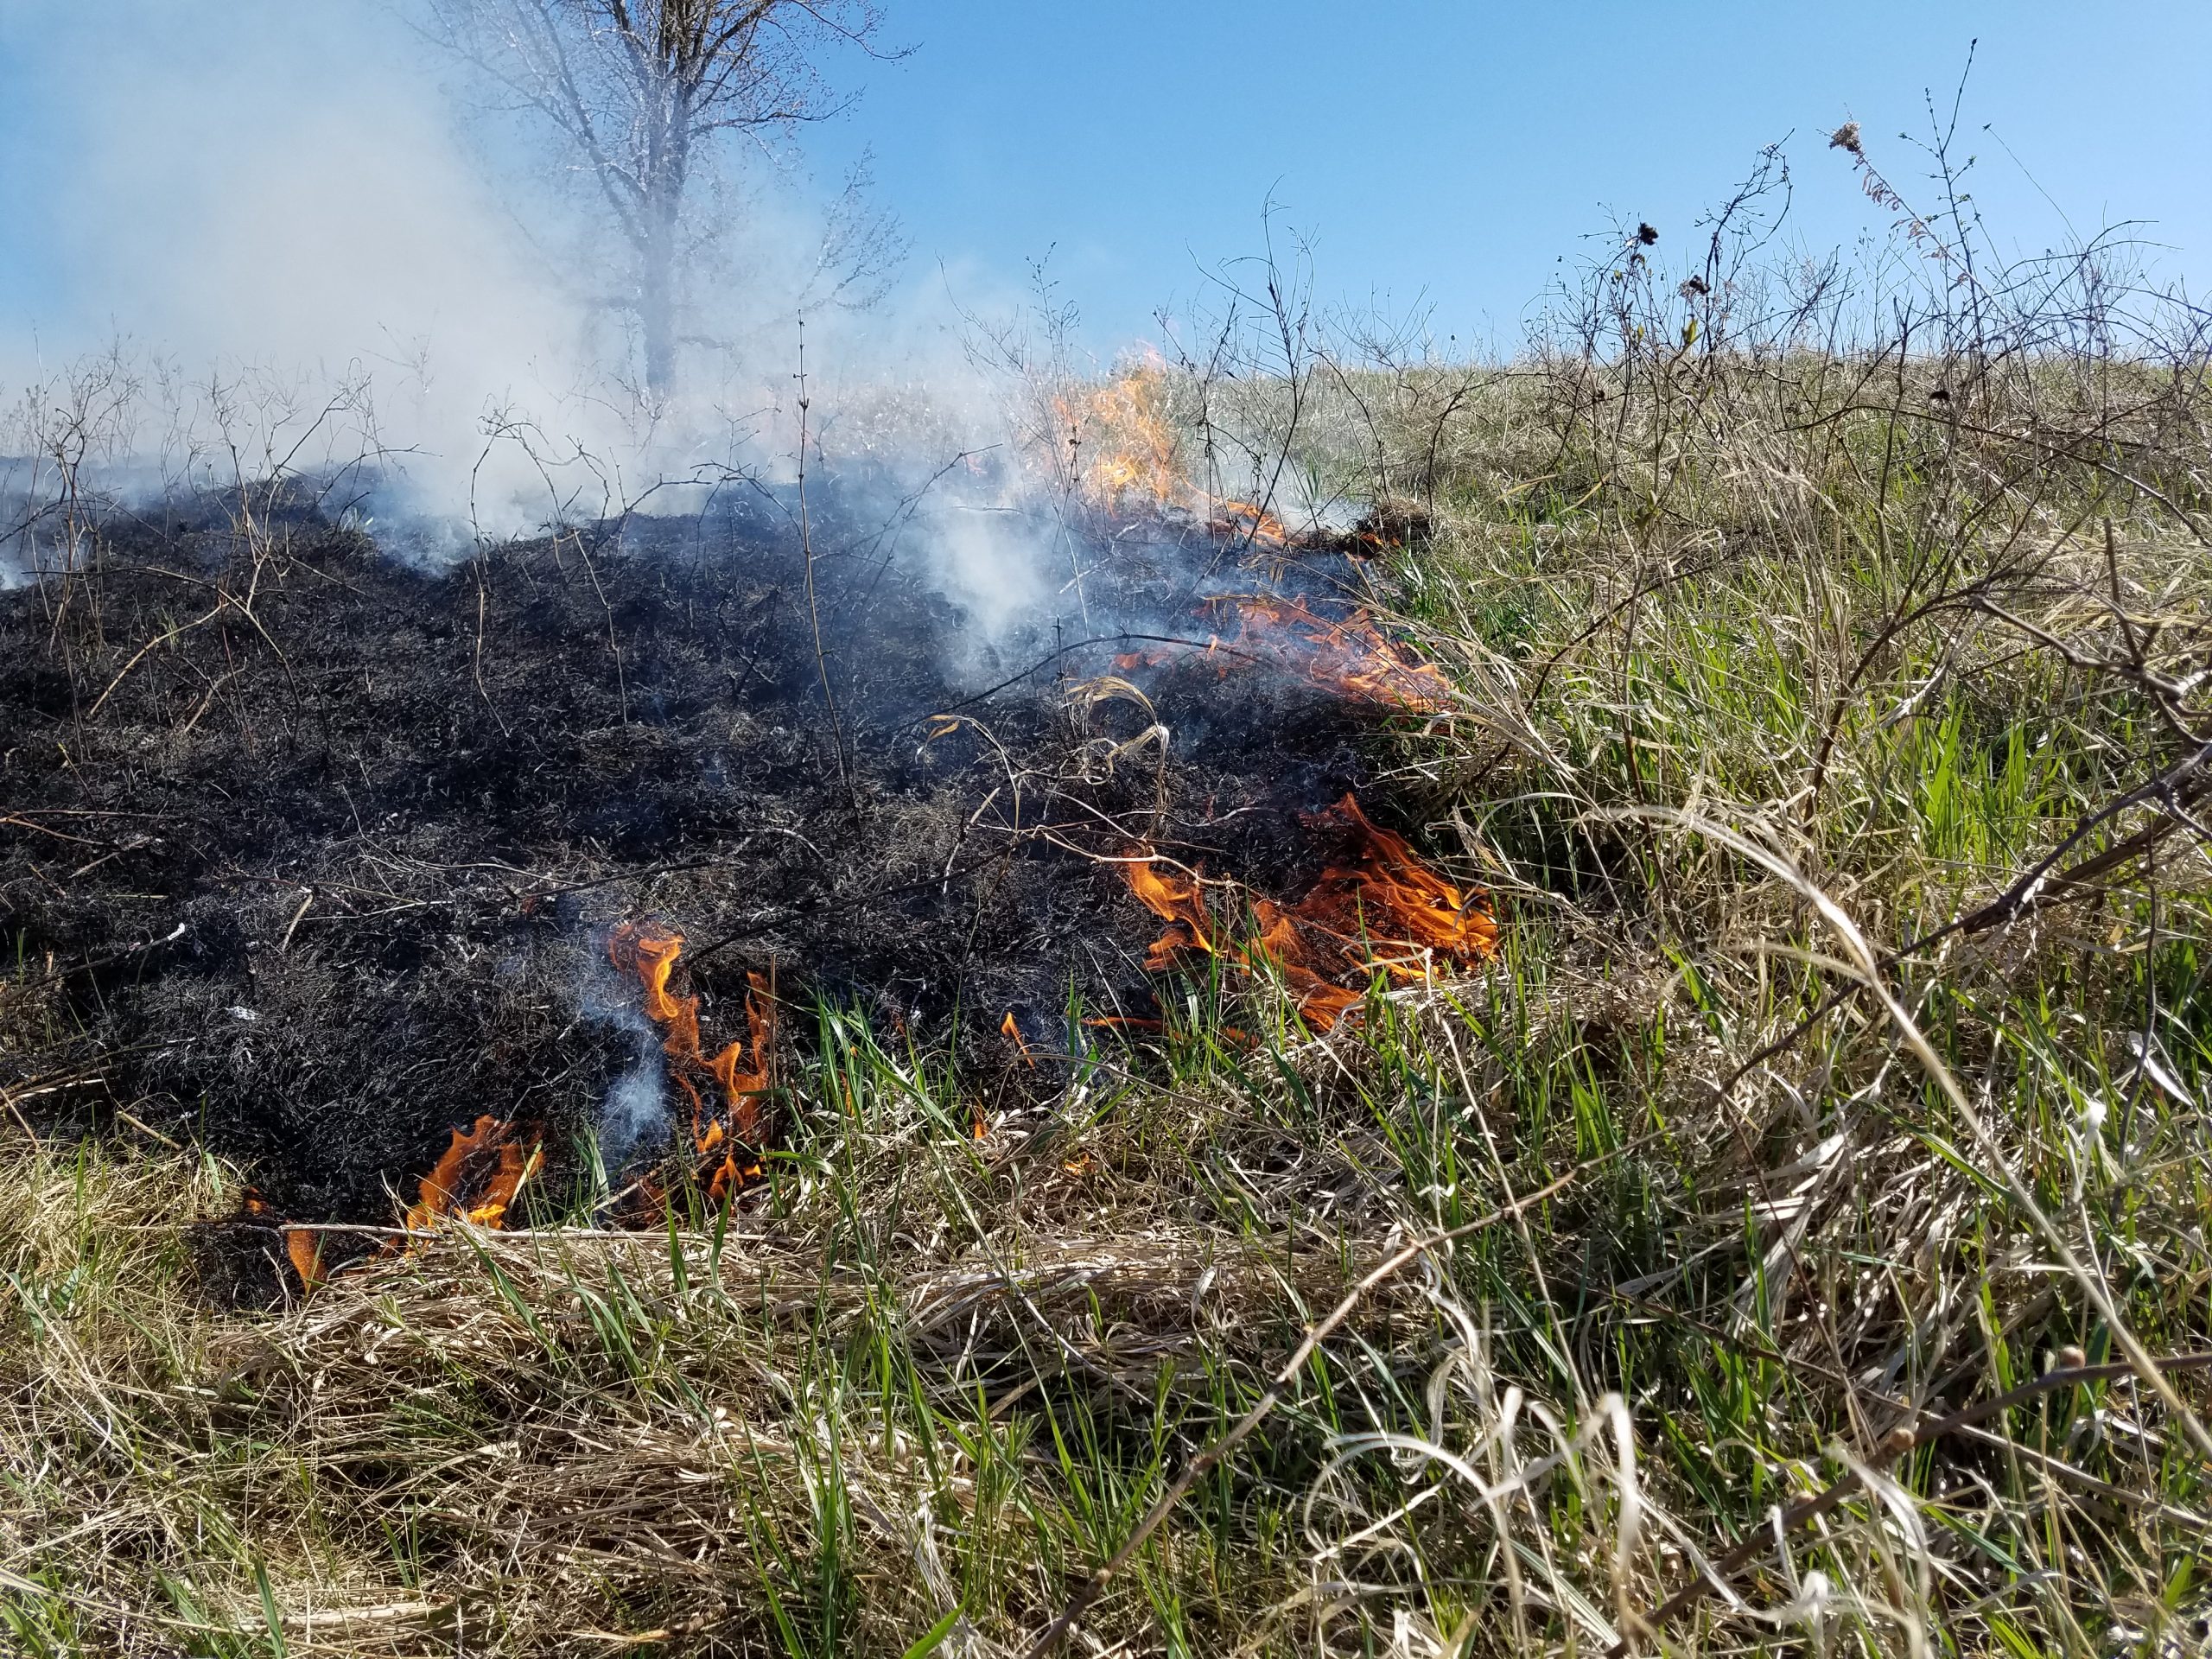
Cool sequence of photos illustrating the progress of the burn. Notice the south wind pushing smoke to the north but then the smoke rising vertically towards the end of the burn as the backing and head fire meet to produce tons of convection. Thanks Joyce!
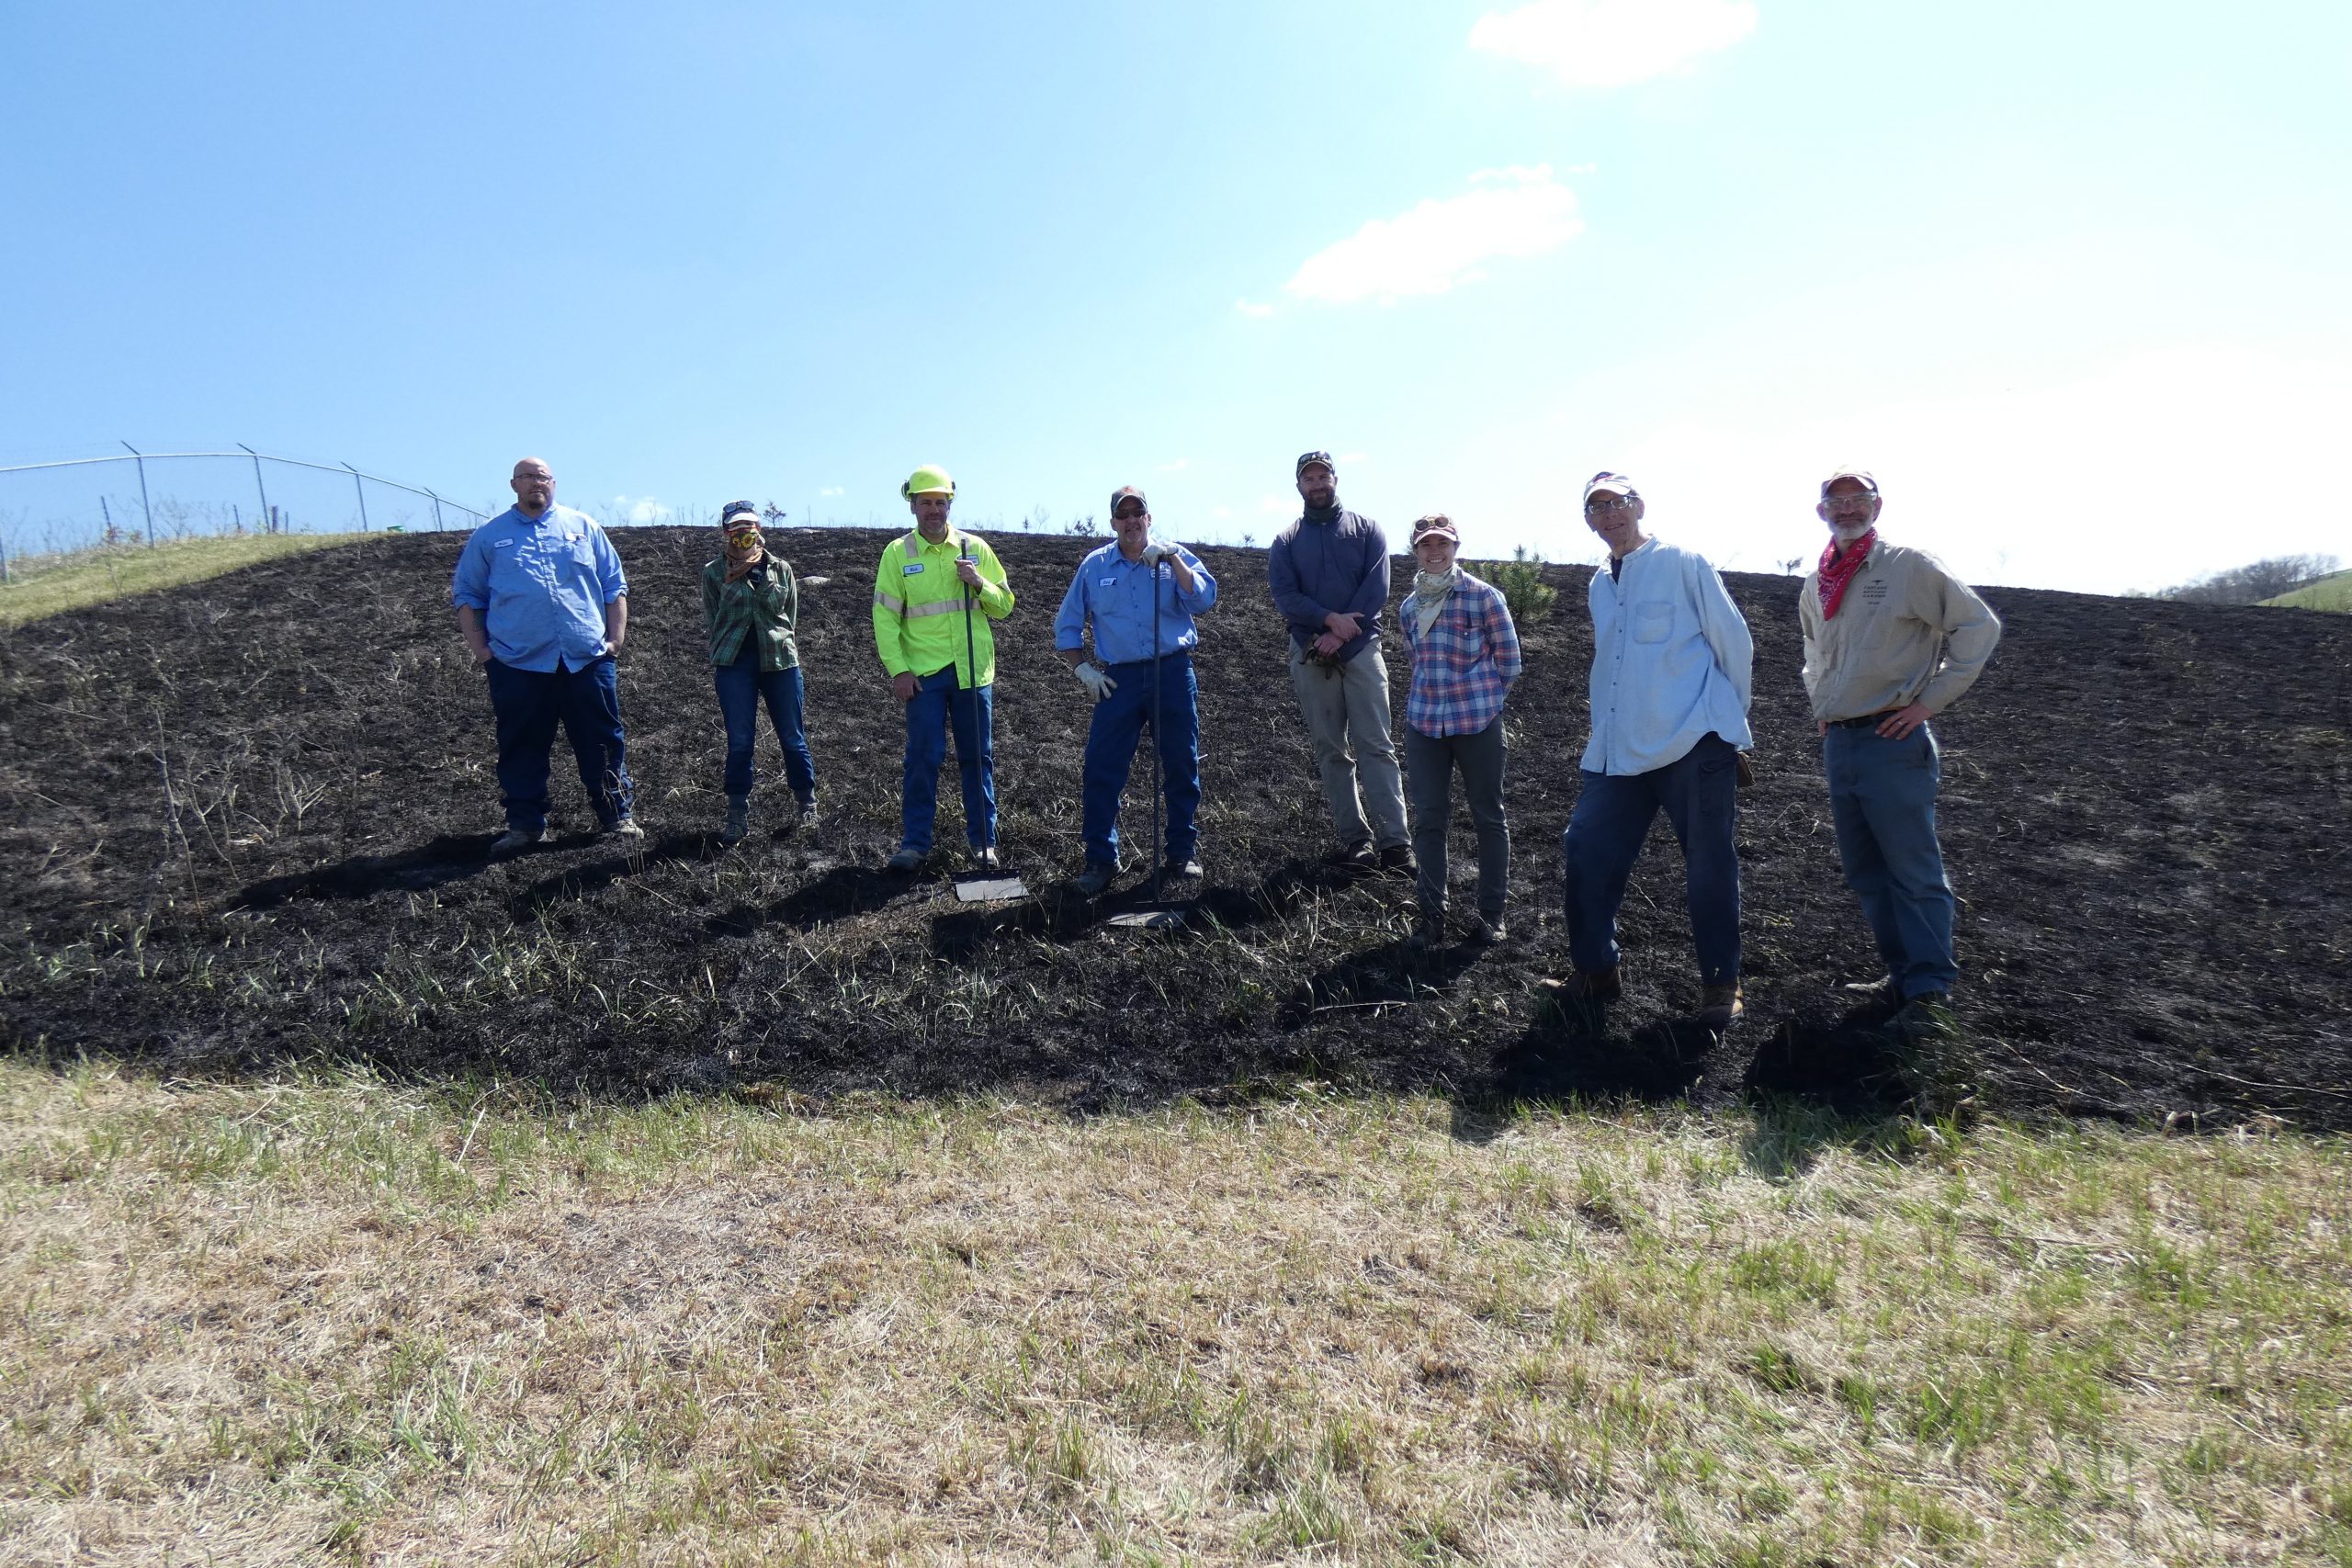
The prescribed burn at landfill east went flawlessly. Although the size of our burn crew, the resources we prepared, and the intensity of our preparations were overkill, we would not change any aspect of our preparations or burn plan. Conducting prescribed burns safely is our #1 priority. Having contingencies in place just in case a prescribed fire does not go as planned is a must. Huge thanks to Brad D., Amy W., Julia B., Karl, Nick, and Brian for their help! And thanks to PDSWM for collaborating with us on this project!
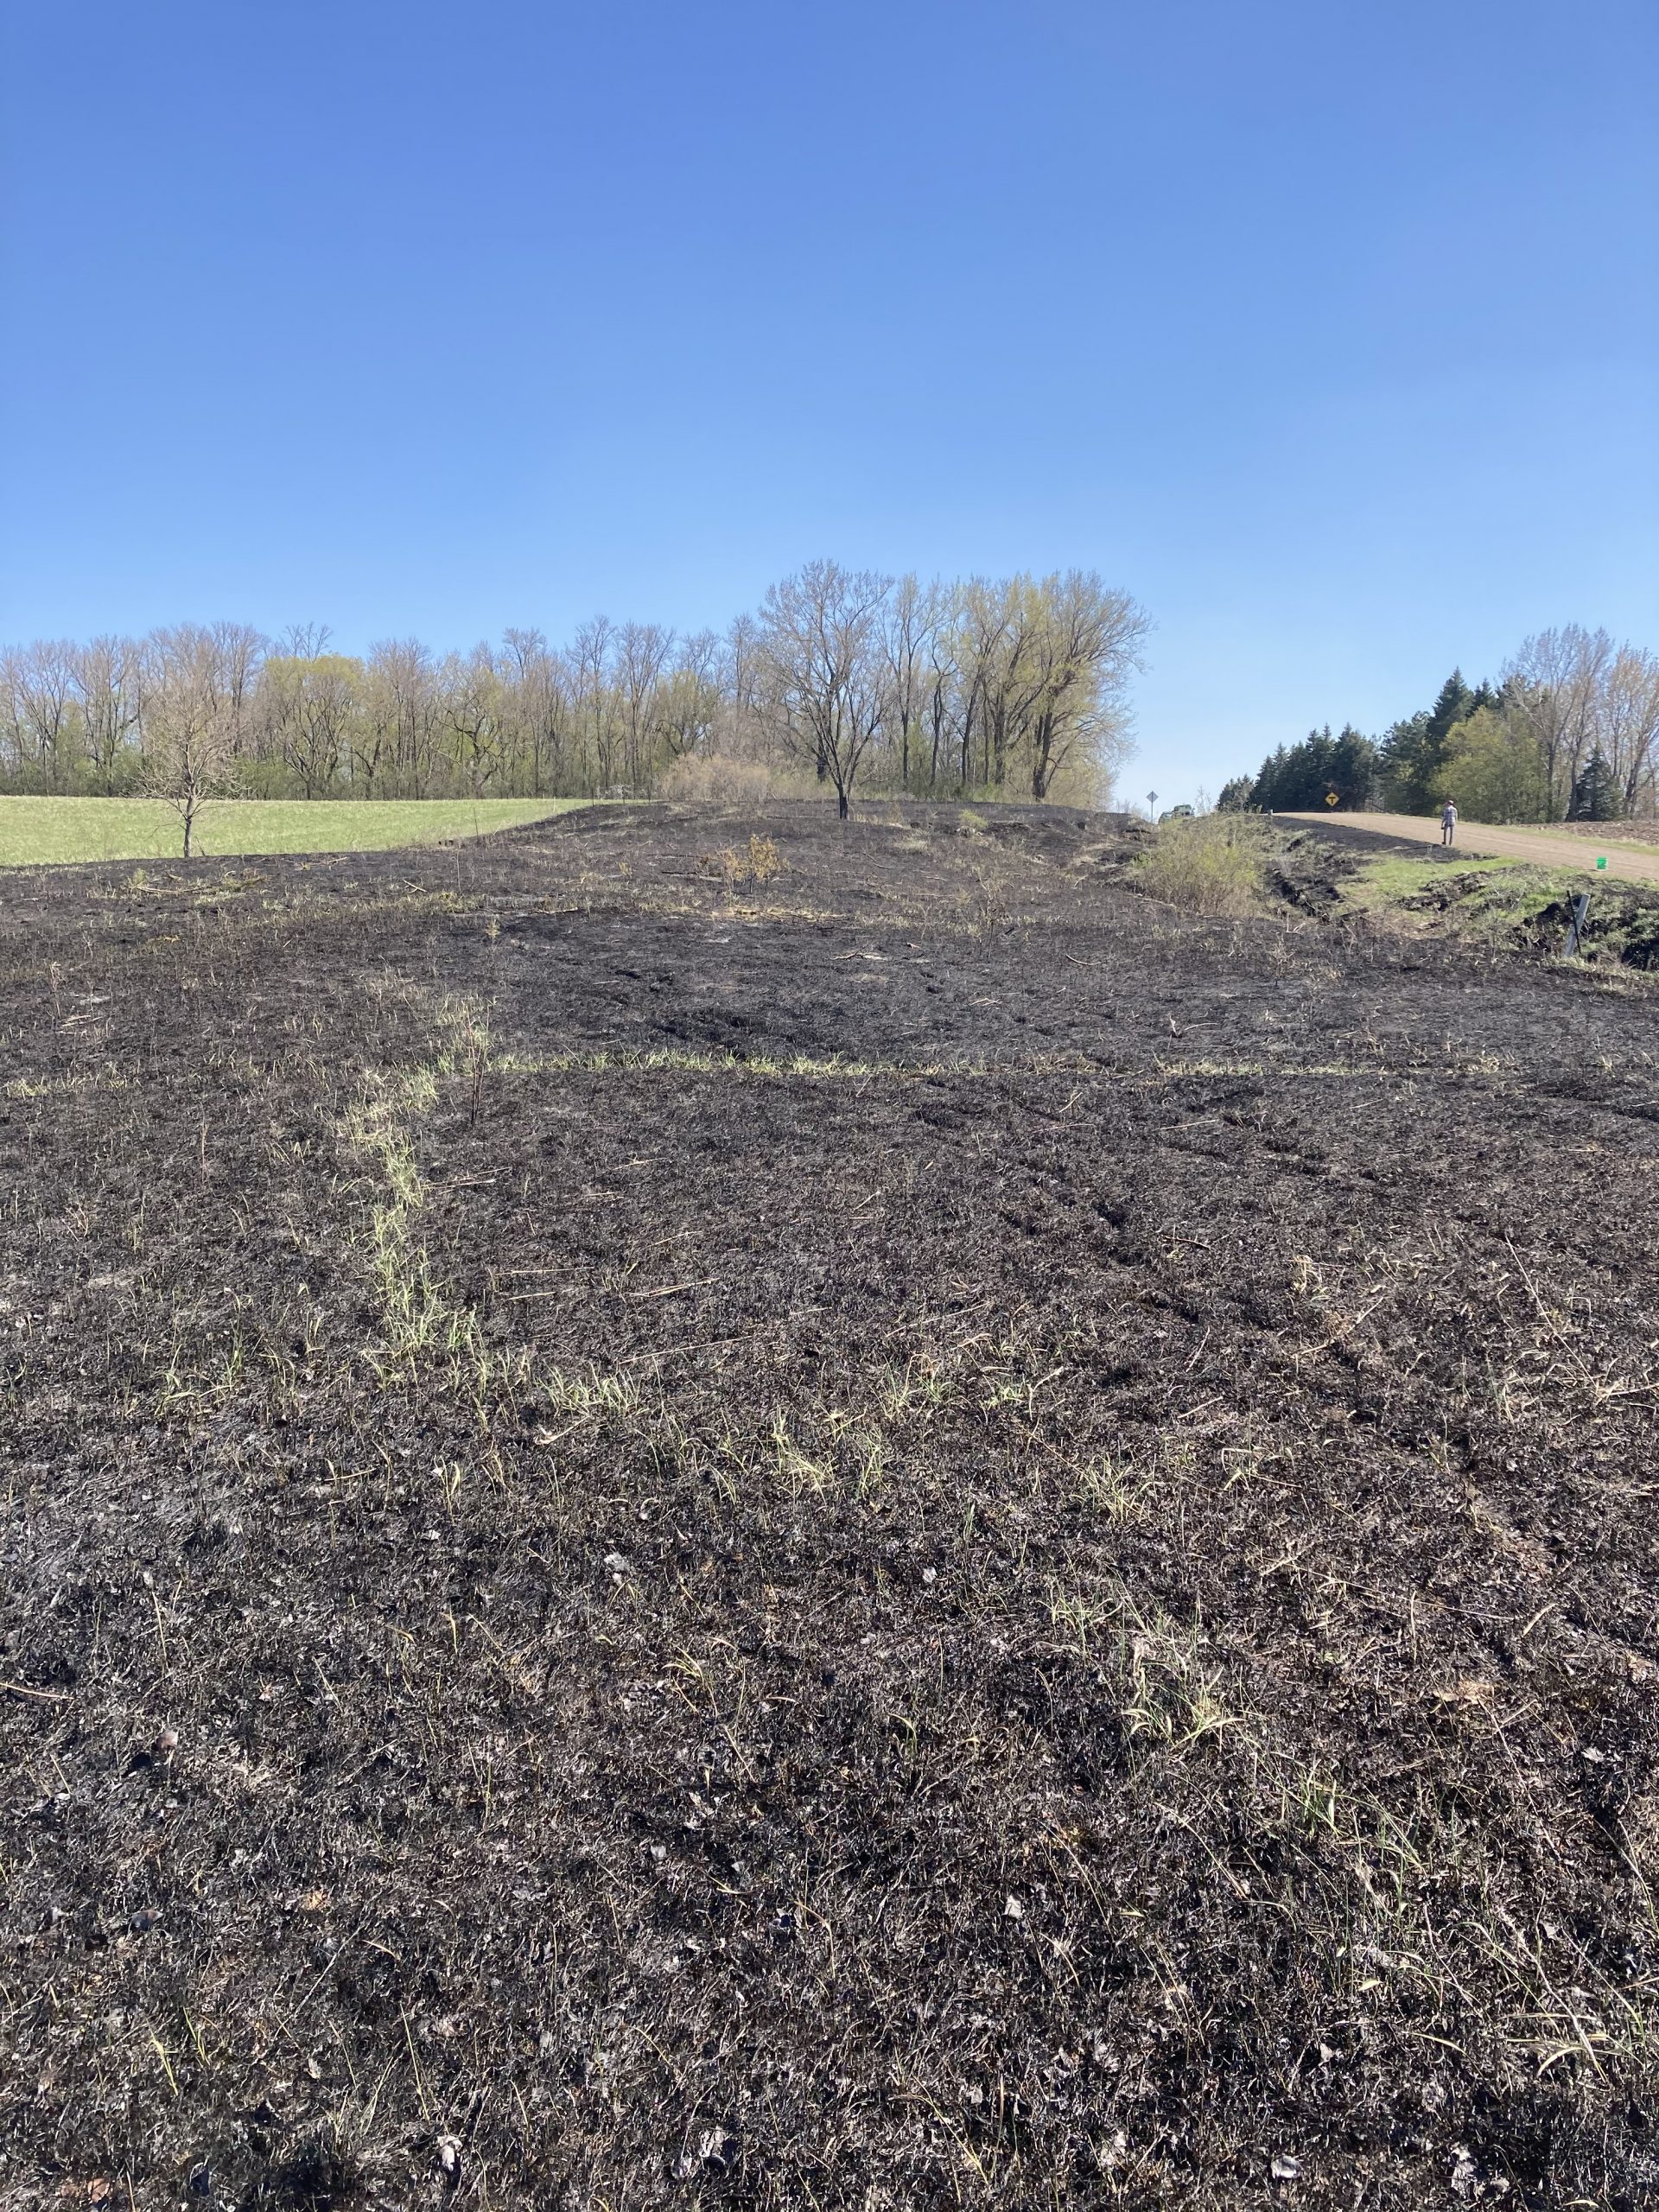
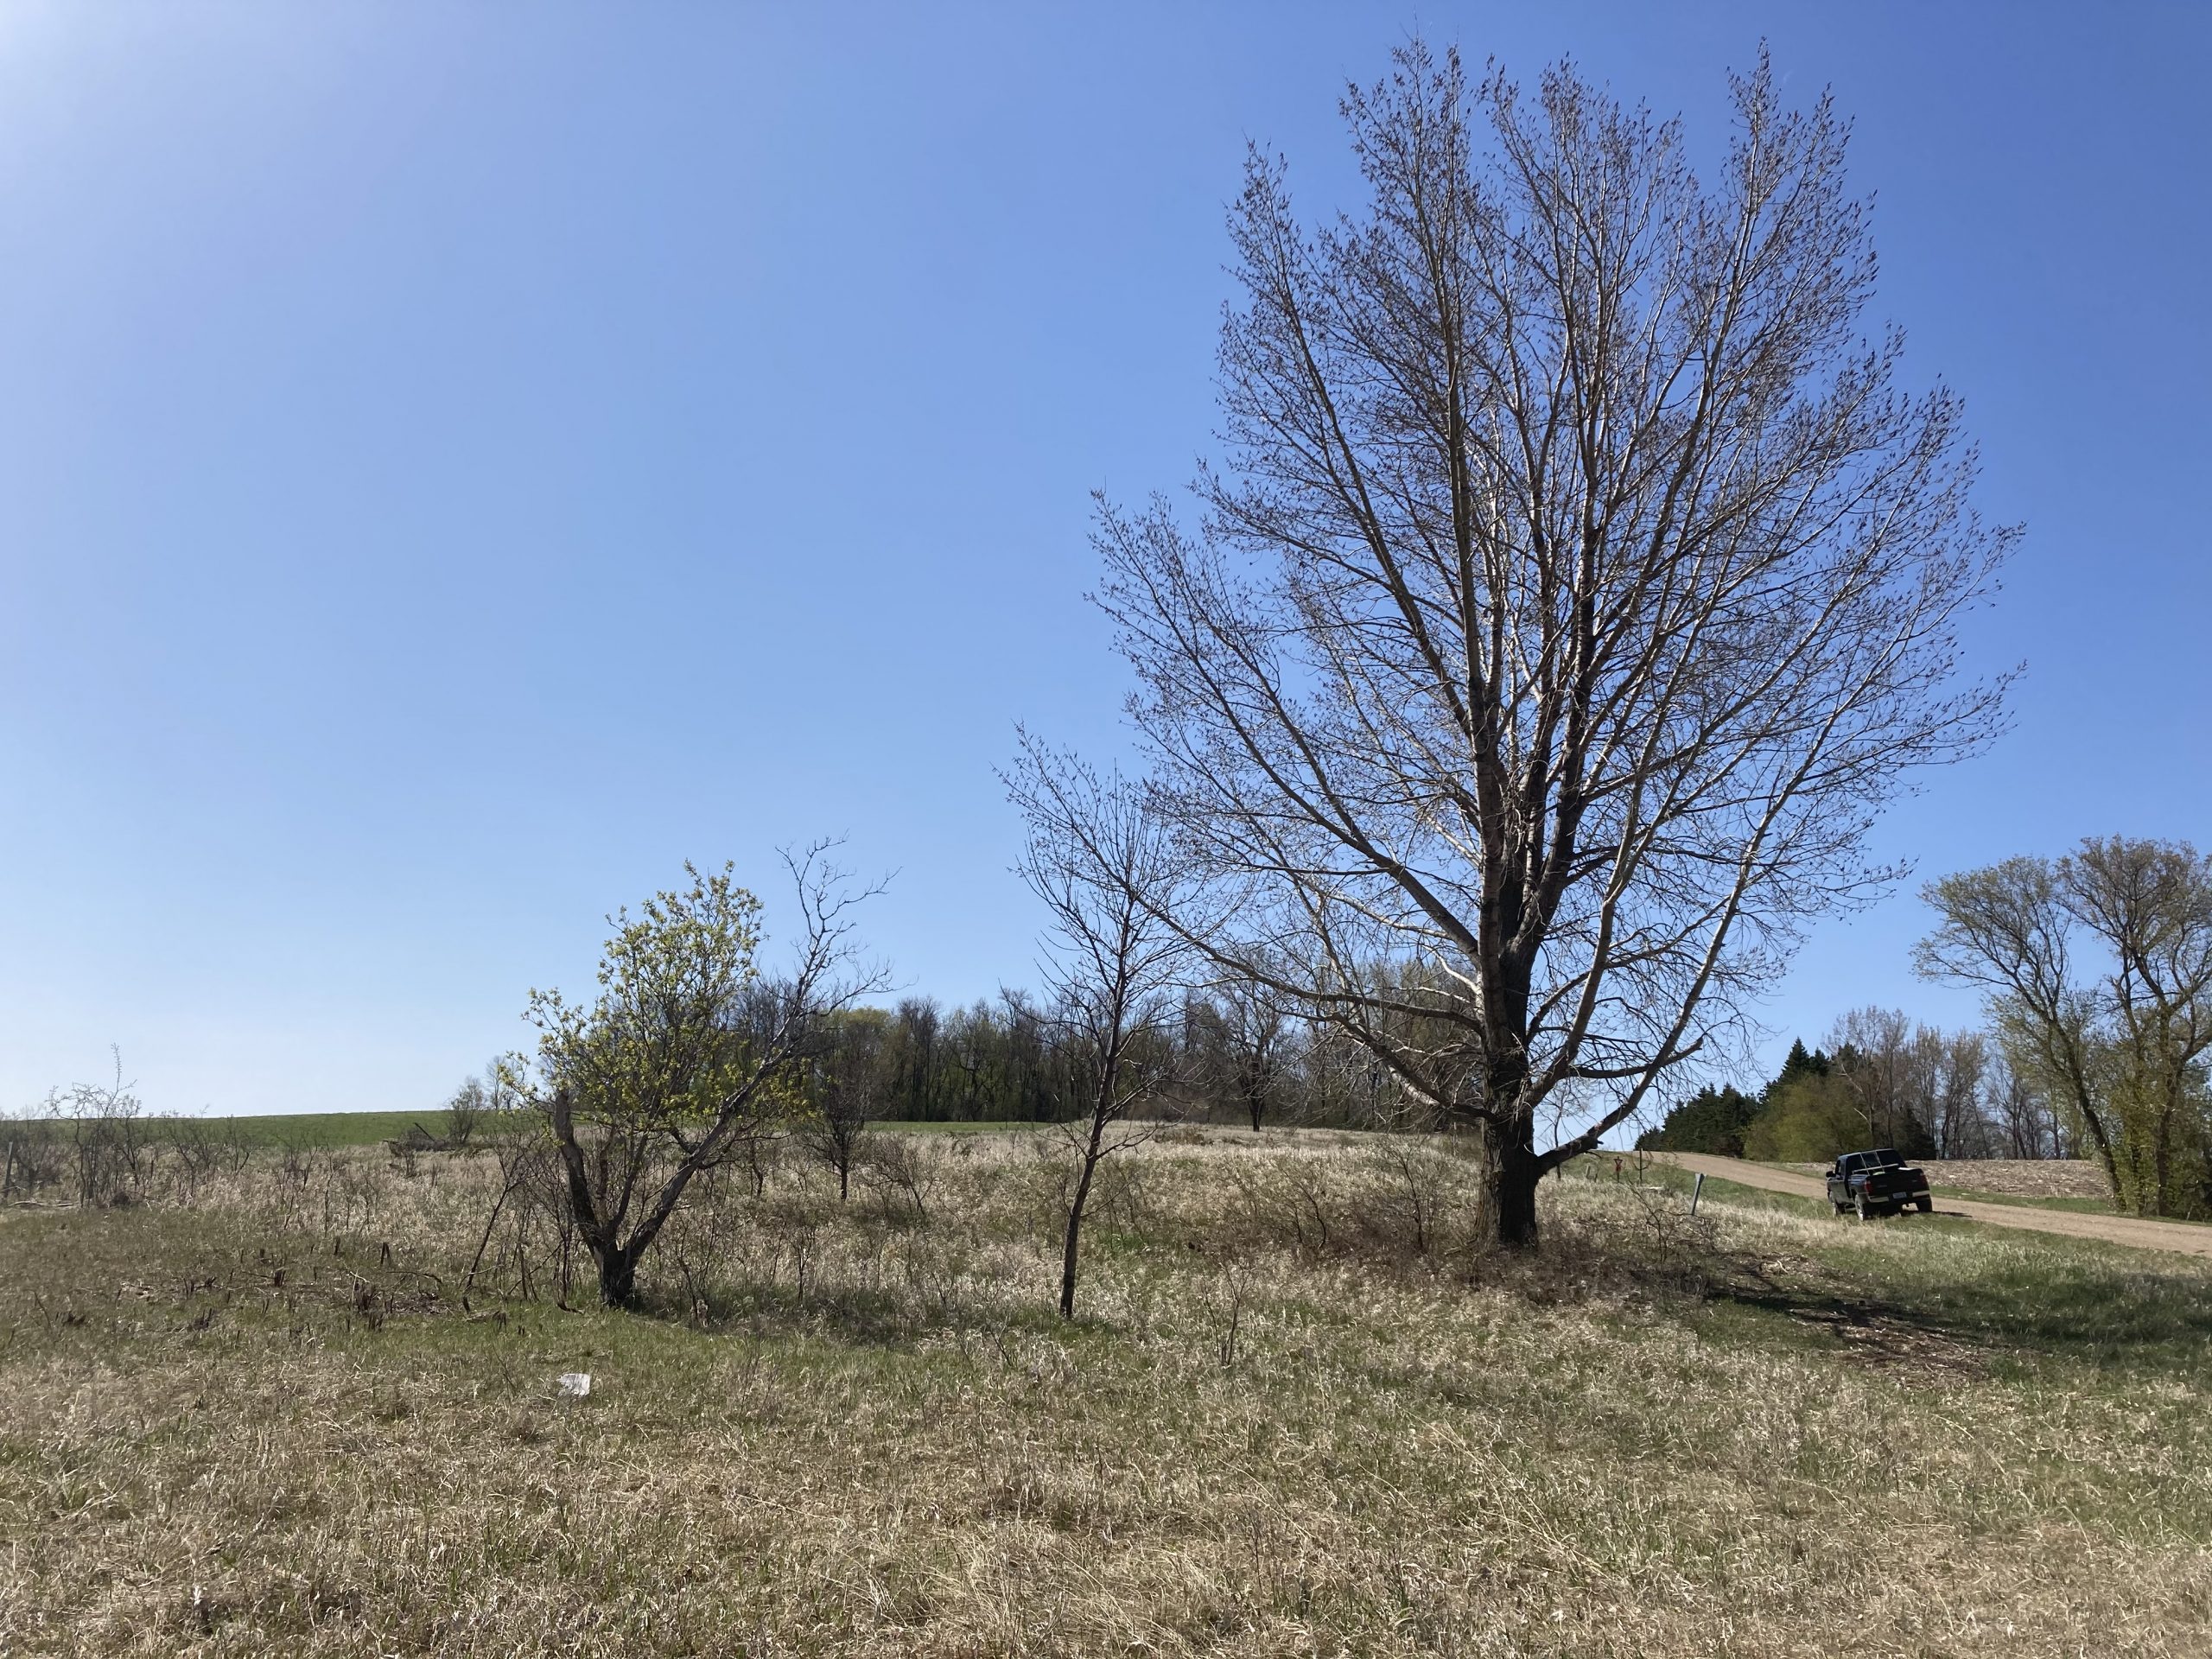
As the smoke dissipated over the east landfill prairie hill, I was elated. The burn went better than I could have imagined and excitement was building for summer research. At the same time, I couldn’t help but smile at the thought of this hillside blanketed by wildflowers in just a few short months. It is unlikely this prairie has experienced fire in more than 60 years. Returning fire to the landscape can transform neglected prairie hills like this from grassy slopes dominated by non-native brome grass (Bromus inermis) to beautiful prairie covered in wildflowers and native grasses in just a few years. The landfill hills are already fascinating with many native prairie plant species clinging to the hillside. Before the burn, I saw a couple prairie smoke (Geum triflorum) and heart-leaved alexanders (Zizia aptera) flowering. What plants will show up after we burn? We also observed a handful of bumblebees cruising in search of flowers and several other native bees zipping around (I am not especially adept at identifying these). Will more flowers after this burn mean more bees and butterflies?
What about birds? I observed several clay-colored sparrows which utilize this grassland habitat for breeding and I heard a bobolink fly overhead (one of my personal favorites). Could these and other grassland birds return to nest and take advantage of the post-fire insect buffet? Bobolinks nested in the adjacent pasture (to the east) which is also owned by PDSWM back in 2014. I worry heavy grazing in the pasture may prevent these lively and charismatic grassland birds from returning to nest this year but perhaps they will take up residence nearby. My mind wanders thinking about a sea of purple coneflowers, lilies, sunflowers, and big bluestem swaying in the summer breeze. The landfill hills we study plus the adjacent pasture to the east and another prairie hill to the south could form an incredible block of grassland habitat supporting grassland birds; ducks, pheasants, and other game animals; prairie butterflies and bees; as well as hundreds of prairie plant species with a few more burns and a few less tree. Staring out across those picturesque golden hills silhouetted against a vivid blue sky just makes my imagination run wild. What an incredible place!
Temperature: 62 F Relative Humidity: 29 % Wind Speed: 10 mph Wind Direction: SW Ignition time: 10:34 AM End time: 11:14 AM Burn Crew: Jared, Stuart, Brad D., Amy W., Julia B., Karl, Nick, and Brian + Joyce (photographer)
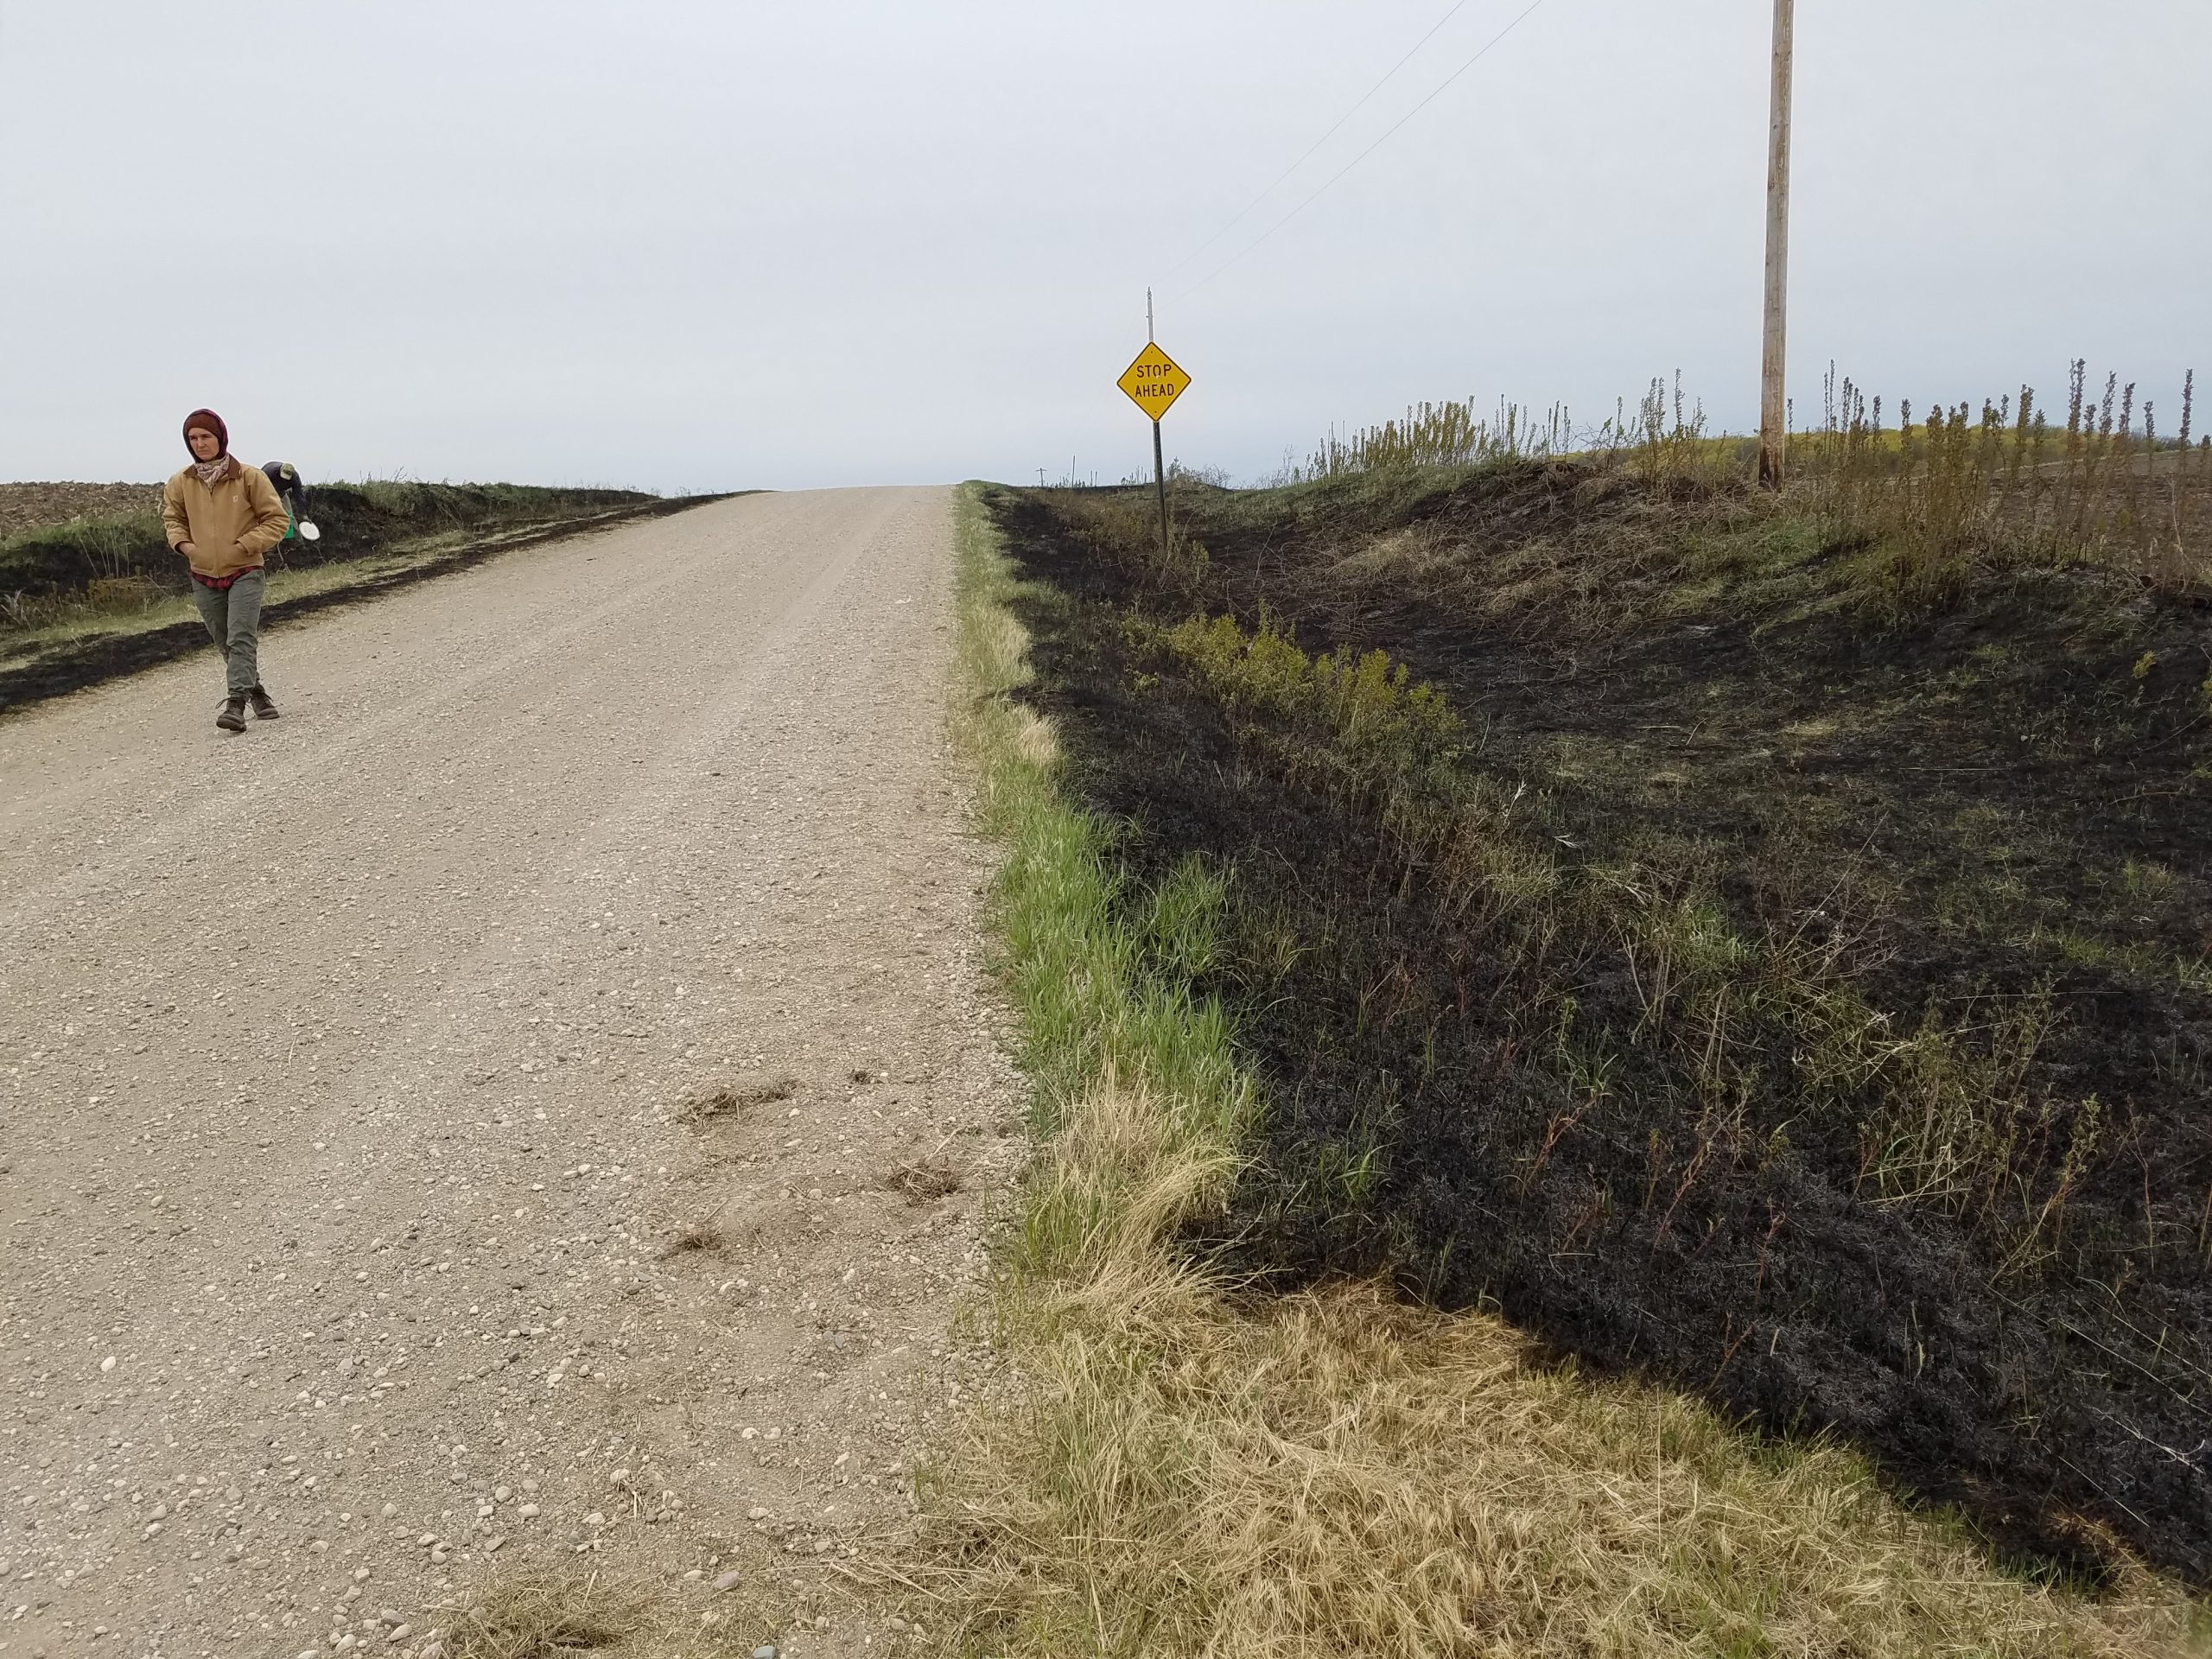
Saturday (May 8) brought overcast skies and east-southeast winds. Conditions were not ideal for burning but the winds, cloud cover, and relative humidity stabilized by mid-morning. Gretel, Stuart, and I thought we might be able to get a couple burns in. We decided to try Steven’s approach where I had mowed burn breaks Thursday. We loaded up backpack pumps, drip torches, water buckets, flappers, and other equipment and drove a short way east to the pair of burn units.
Starting with the west unit, we ignited a test fire in the northwest corner, secured the north burn break, and proceeded to ignited the western edge the unit. We ignited cautiously around two telephone poles but made quick work of igniting along the field edge. Towards the end of burning the west unit, winds became squirrelly shifting from southeast to east and back again (Stuart and I swear it was northeast for a minute or two). Nevertheless, the fire backed well across the western side of Wolley Lake Rd. Fire on the approach was a bit patchy but Jared was committed to emptying a drip torch. So Jared “painted” the approach with a drip torch producing an aesthetically pleasing mosaic of burned grasses and bare gravel.
Once the south end of the western unit had been secured by Stuart, Gretel and Jared scurried across the road and began igniting the east unit while Stuart kept vigilant watch of the western unit. Jared ignited a fire in the southeast corner of the east unit (as winds were more or less straight east at this moment). Once Gretel and Jared secured the southern edge of the unit, Jared ignited along Wolley Lake Rd moving north. Winds shifted back to the southeast so Jared quickly ignited the entire length of the unit. Gretel and Jared secured the northern end of the east unit while Stuart kept watch over the southern end. We proceeded mop up the units and extinguish any remaining woody debris that was still smoking. With unreliable winds, we decided to call it a day and returned to Echinacea Project home base for lunch.
Temperature – 52 F Relative humidity – 27 % Wind speed (max gusts) – 12 (18) mph wind direction – ESE Burn crew: Jared, Gretel, Stuart sap.w ignition time: 11:06 PM sap.w end time: 11:58 PM sap.e ignition time: 11:40 PM sap.e end time: 12:18 PM
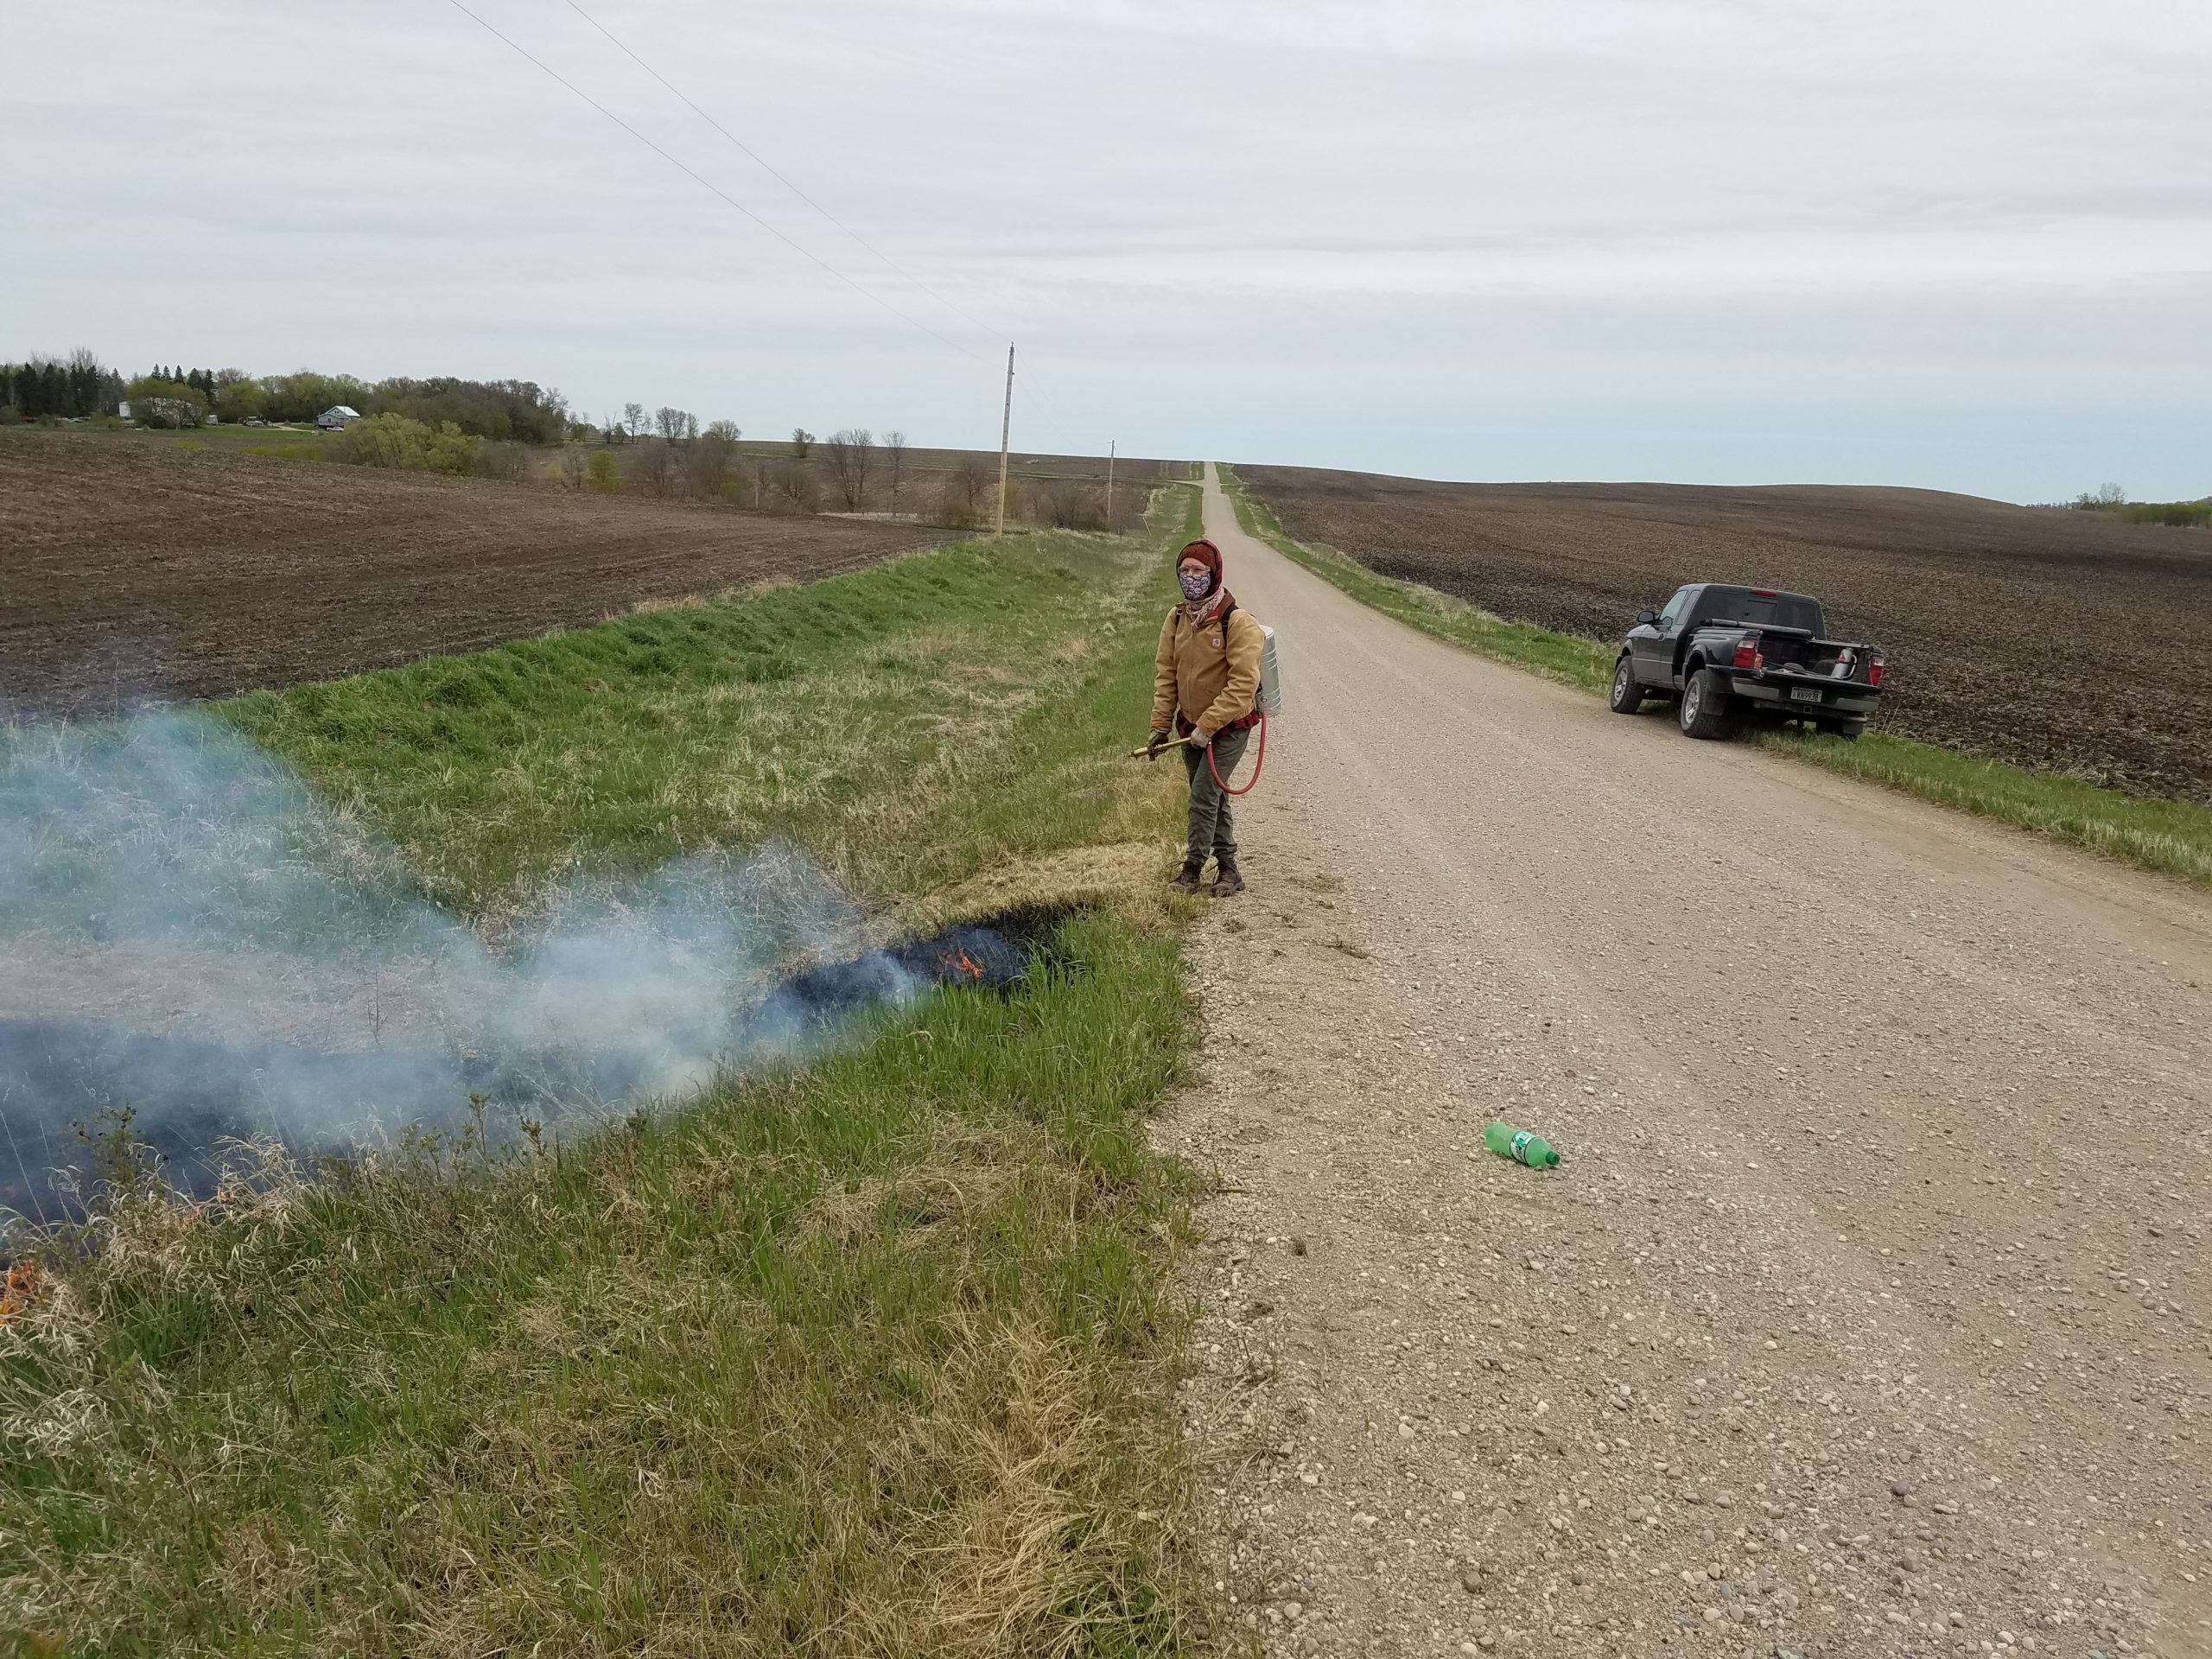
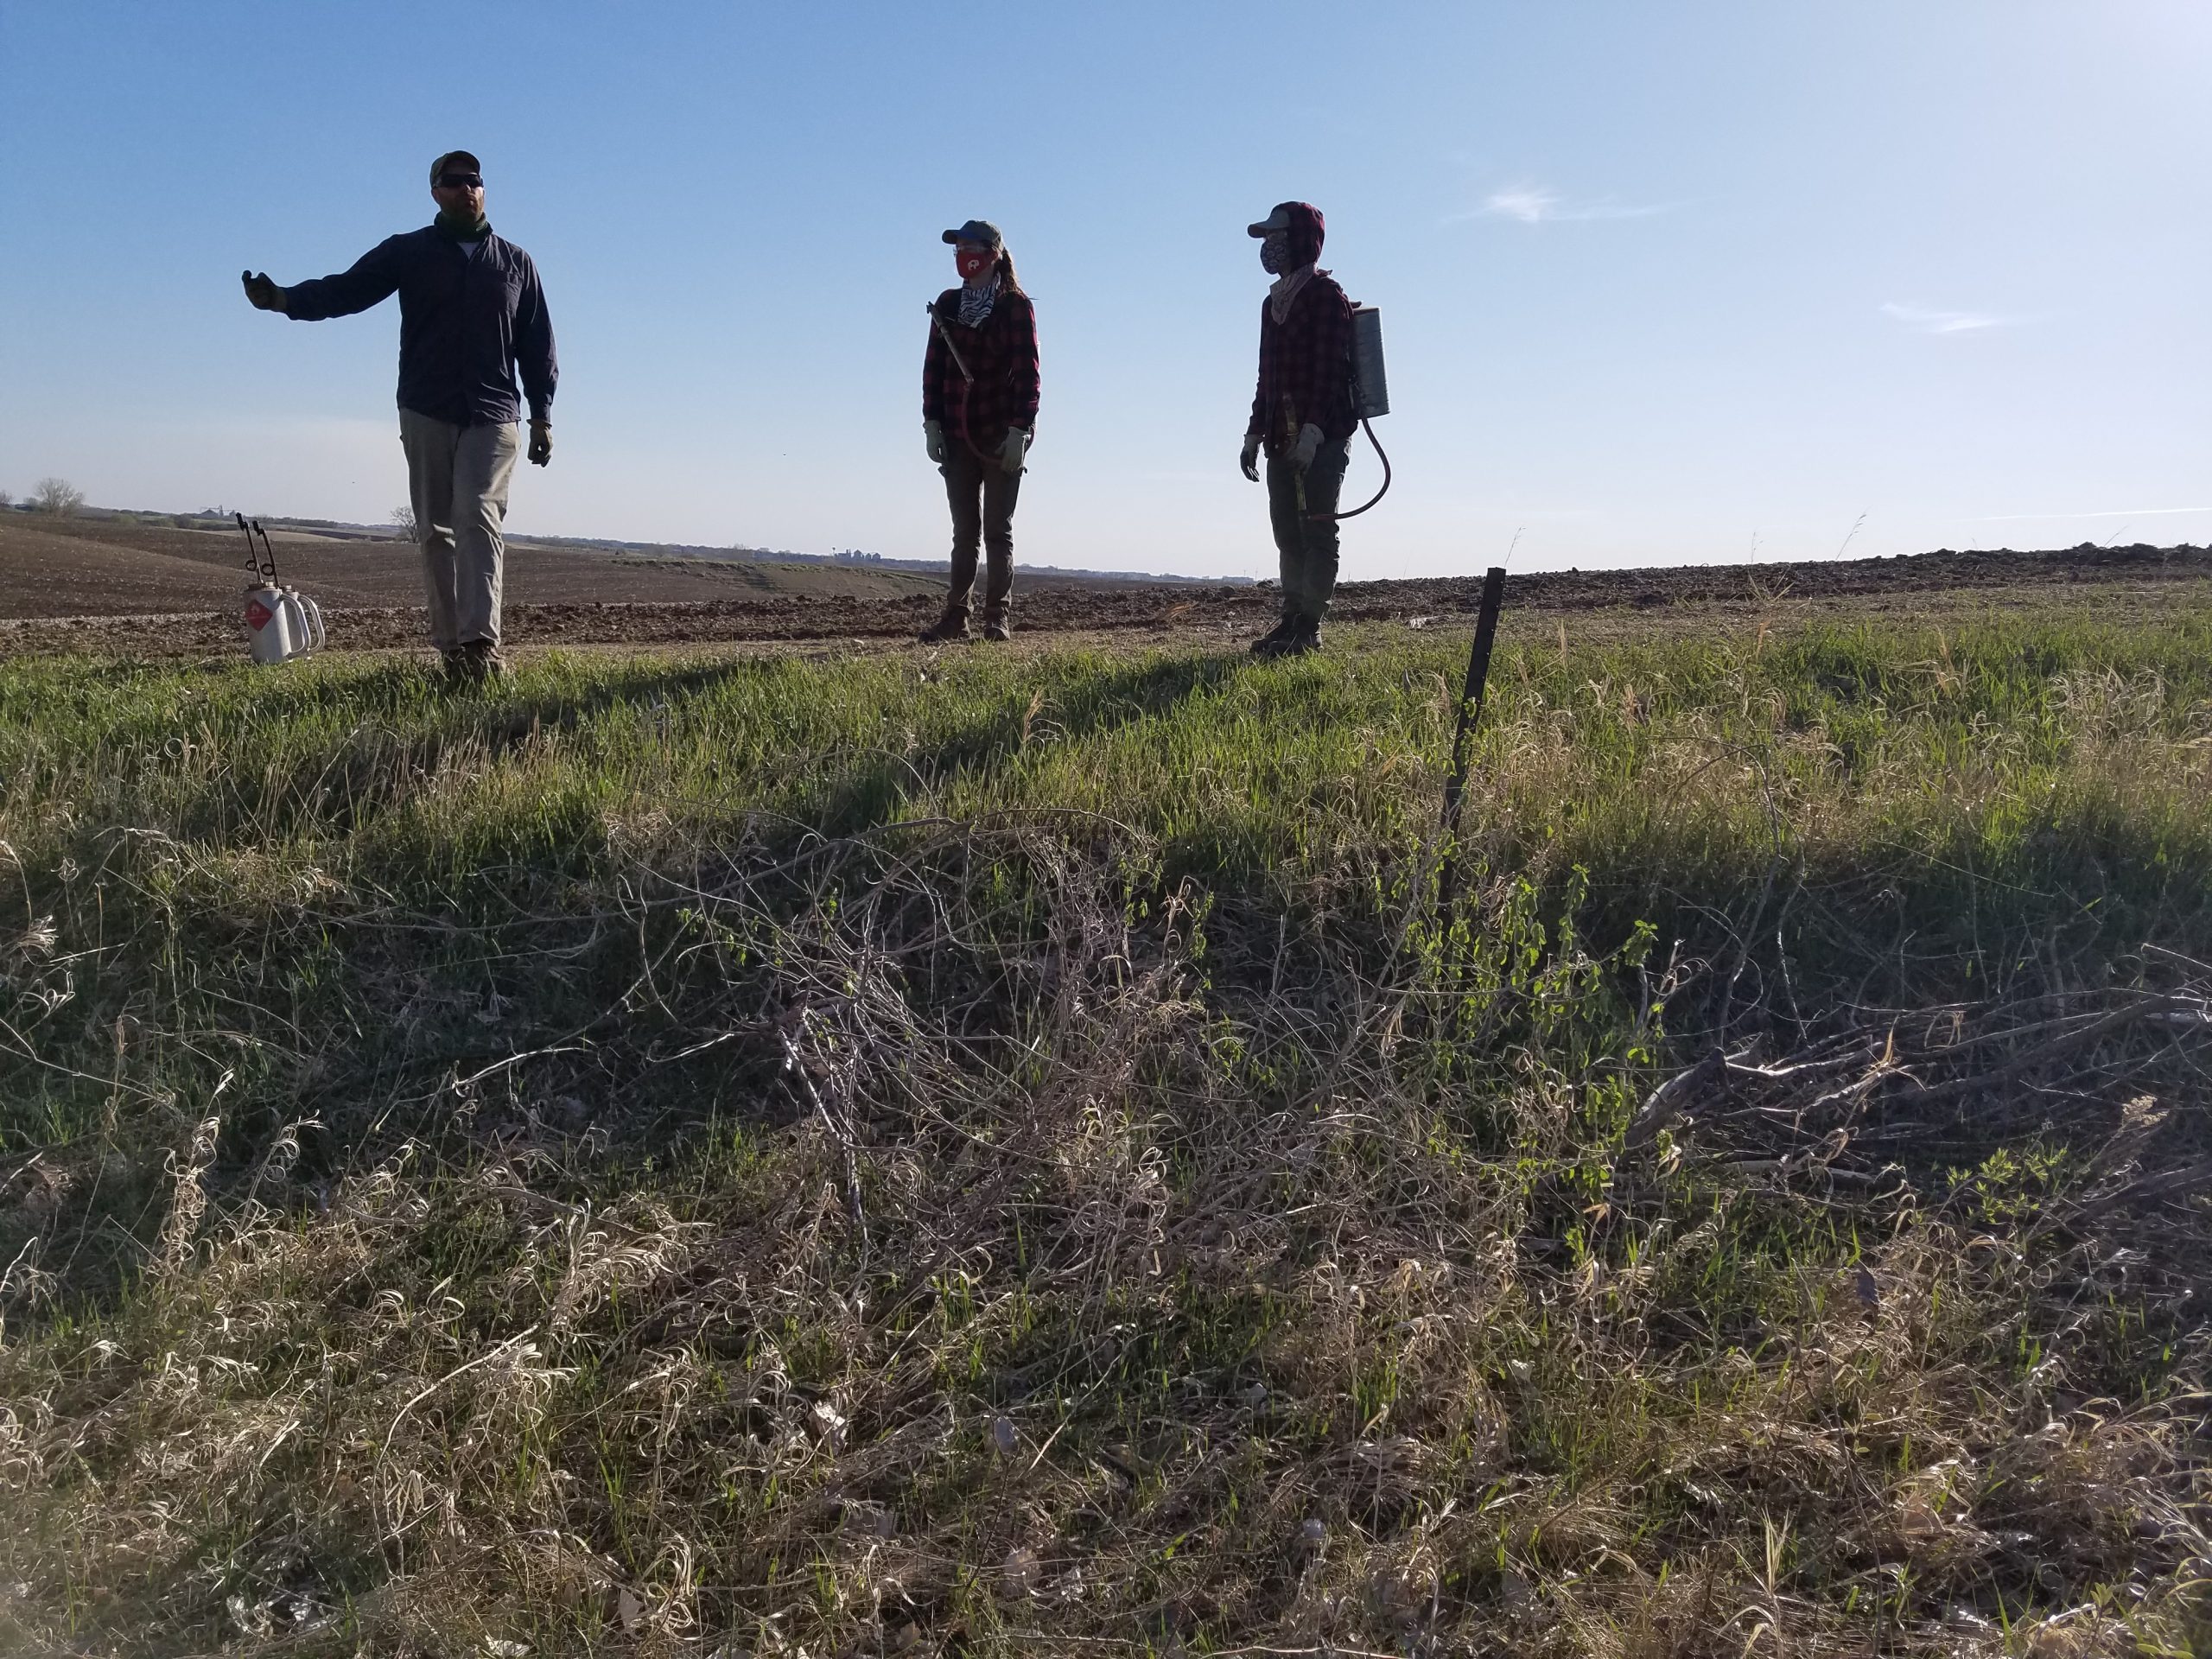
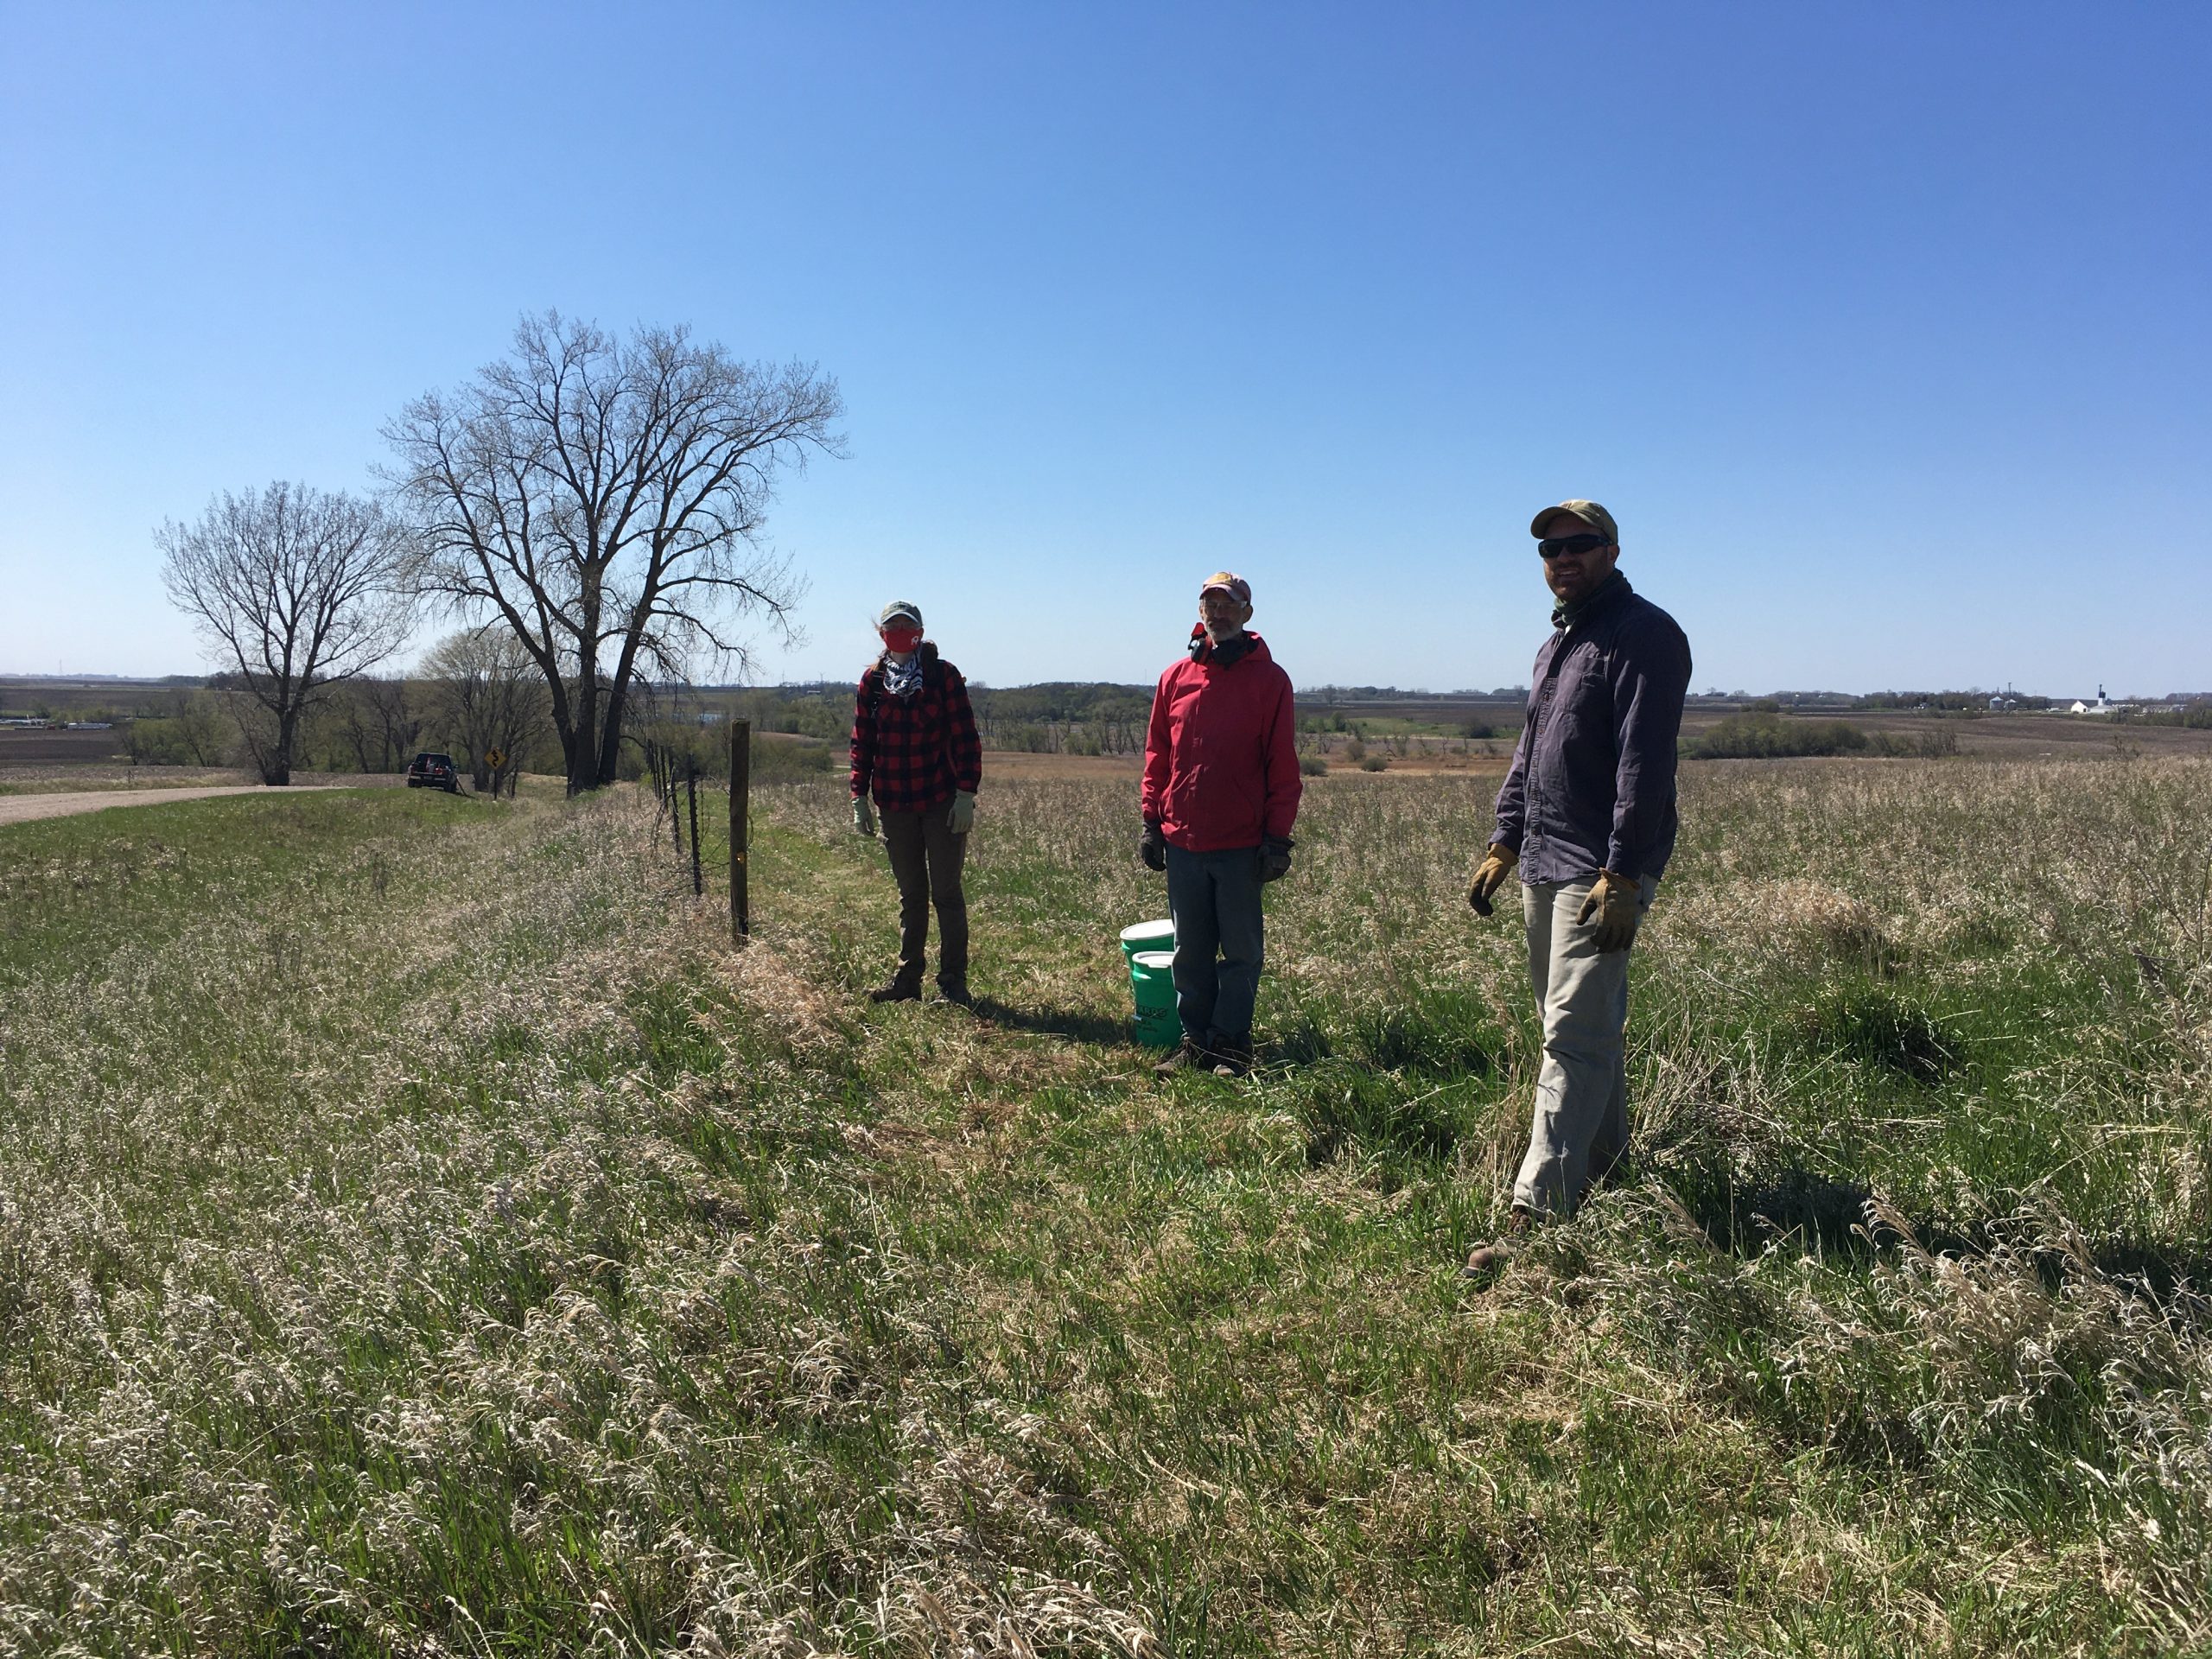
Weather conditions Friday (May 7) presented nearly ideal conditions for burning the east side of Loeffler’s corner. Because this patch of prairie is located immediately south of Hwy 55, our burn prescription calls for a stiff north wind to keep smoke off the highway. The weather forecast called for a high temperature in the mid 50s, an relative humidity to bottom out in the upper 20s, and north winds 10-15 mph. We couldn’t have asked for a better forecast. Amy W. and Matthew G. drove up from the Twin Cities to join Stuart, Gretel, and myself on our Friday burn crew.
Photos depicting preparations for the days burn at Loeffler’s corner east.
During the morning, we prepared equipment for the burn. We loaded equipment after lunch and drove south to the burn unit. Along the drive, we spotted a very large plume of smoke from a USFWS burn to the southwest and once at the site, another USFWS burn 10 miles. Stuart, Gretel, and I staged vehicles and water buckets. We placed orange traffic cones along the highway and Sandy Hill Rd to alert passing traffic. The whole burn crew walked the entire burn break while reviewing the burn plan and discussing hazards. The east edge of the burn unit (along Sandy Hill Rd) presented few challenges including a mass of woody debris, wooden fence posts with barbed wire, and a pile of wood chips.
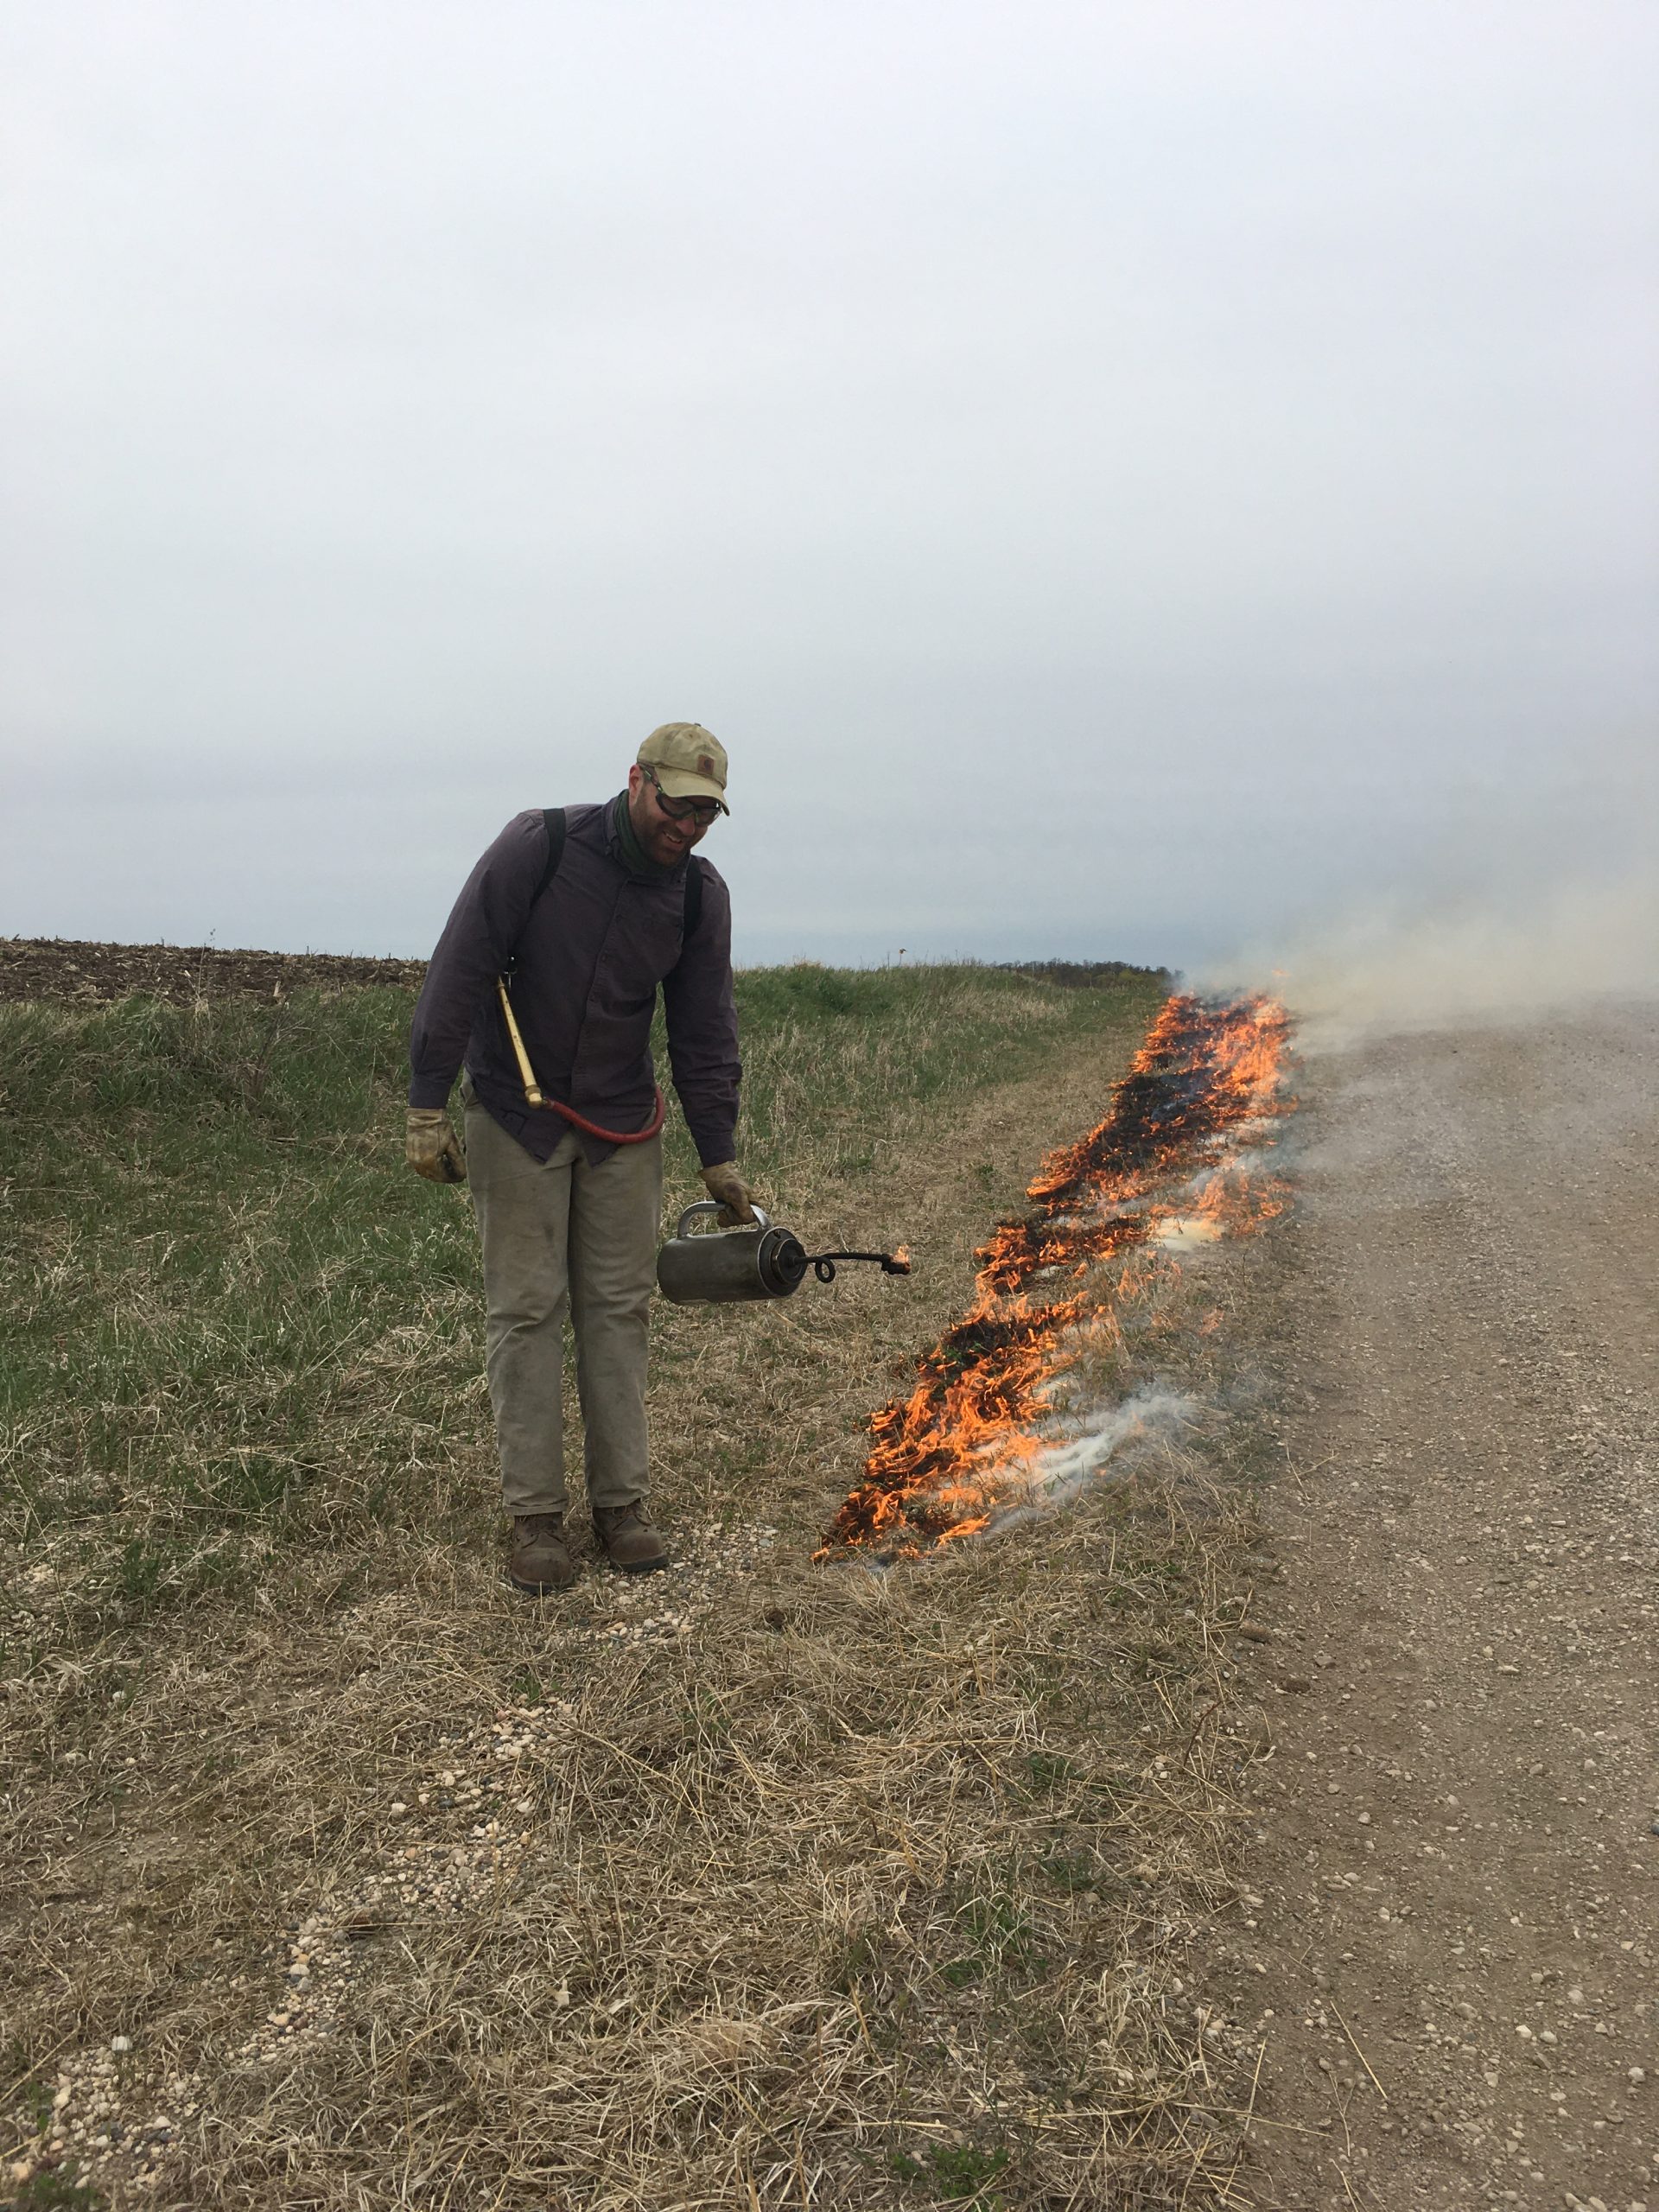
Sequence of photos illustrating test fire and the crew securing the southern burn break.
We ignited a test fire in the southeast corner of the burn unit. Once we secured the southern edge of the burn unit, Stuart and I ignited in parallel directions moving north. Matthew and I patrolled the eastern edge while Stuart, Gretel, and Amy did most of the hard work along the troublesome western edge. The eastern edge of the burn unit (along agricultural field) was very civilized. Matthew and I ignited along the fence line. The fire essentially put itself out. The western edge of the unit required more effort. Stuart ignited carefully around a brush pile, around fence posts, and around the large cottonwood while Gretel and Amy diligently kept watch to ensure none of the hazards caught fire. Realized winds 30 minutes into the burn were lighter and more variable than forecast, argggh… We started with steady N winds but wind direction wobbled with NW, N, and NE gusts alongside a couple short-lived E and W gusts. With topography and the dominant wind in our favor, Stuart and I kept in contact with radios. We adjusted our pacing to accommodate the fickle winds and complete the burn safely. While Amy and Stuart tended to wood chips around the cottonwood, I lit the head fire with help from Matthew and Gretel to hold the northern burn break. The head fire was not terribly exciting. We ended up igniting more slowly than anticipated and back burning ~90 percent of the burn unit. Though slower, this contributed to a consistently blackened unit. The wood chips were a hassle. Tiny plumes of smoke occasionally popped up demanding our attention. With the fire contained, we returned to the research base for dinner. Stuart, Gretel, and I then returned to the site after dinner to check on and extinguish any remaining logs/woodchips that were smoking.
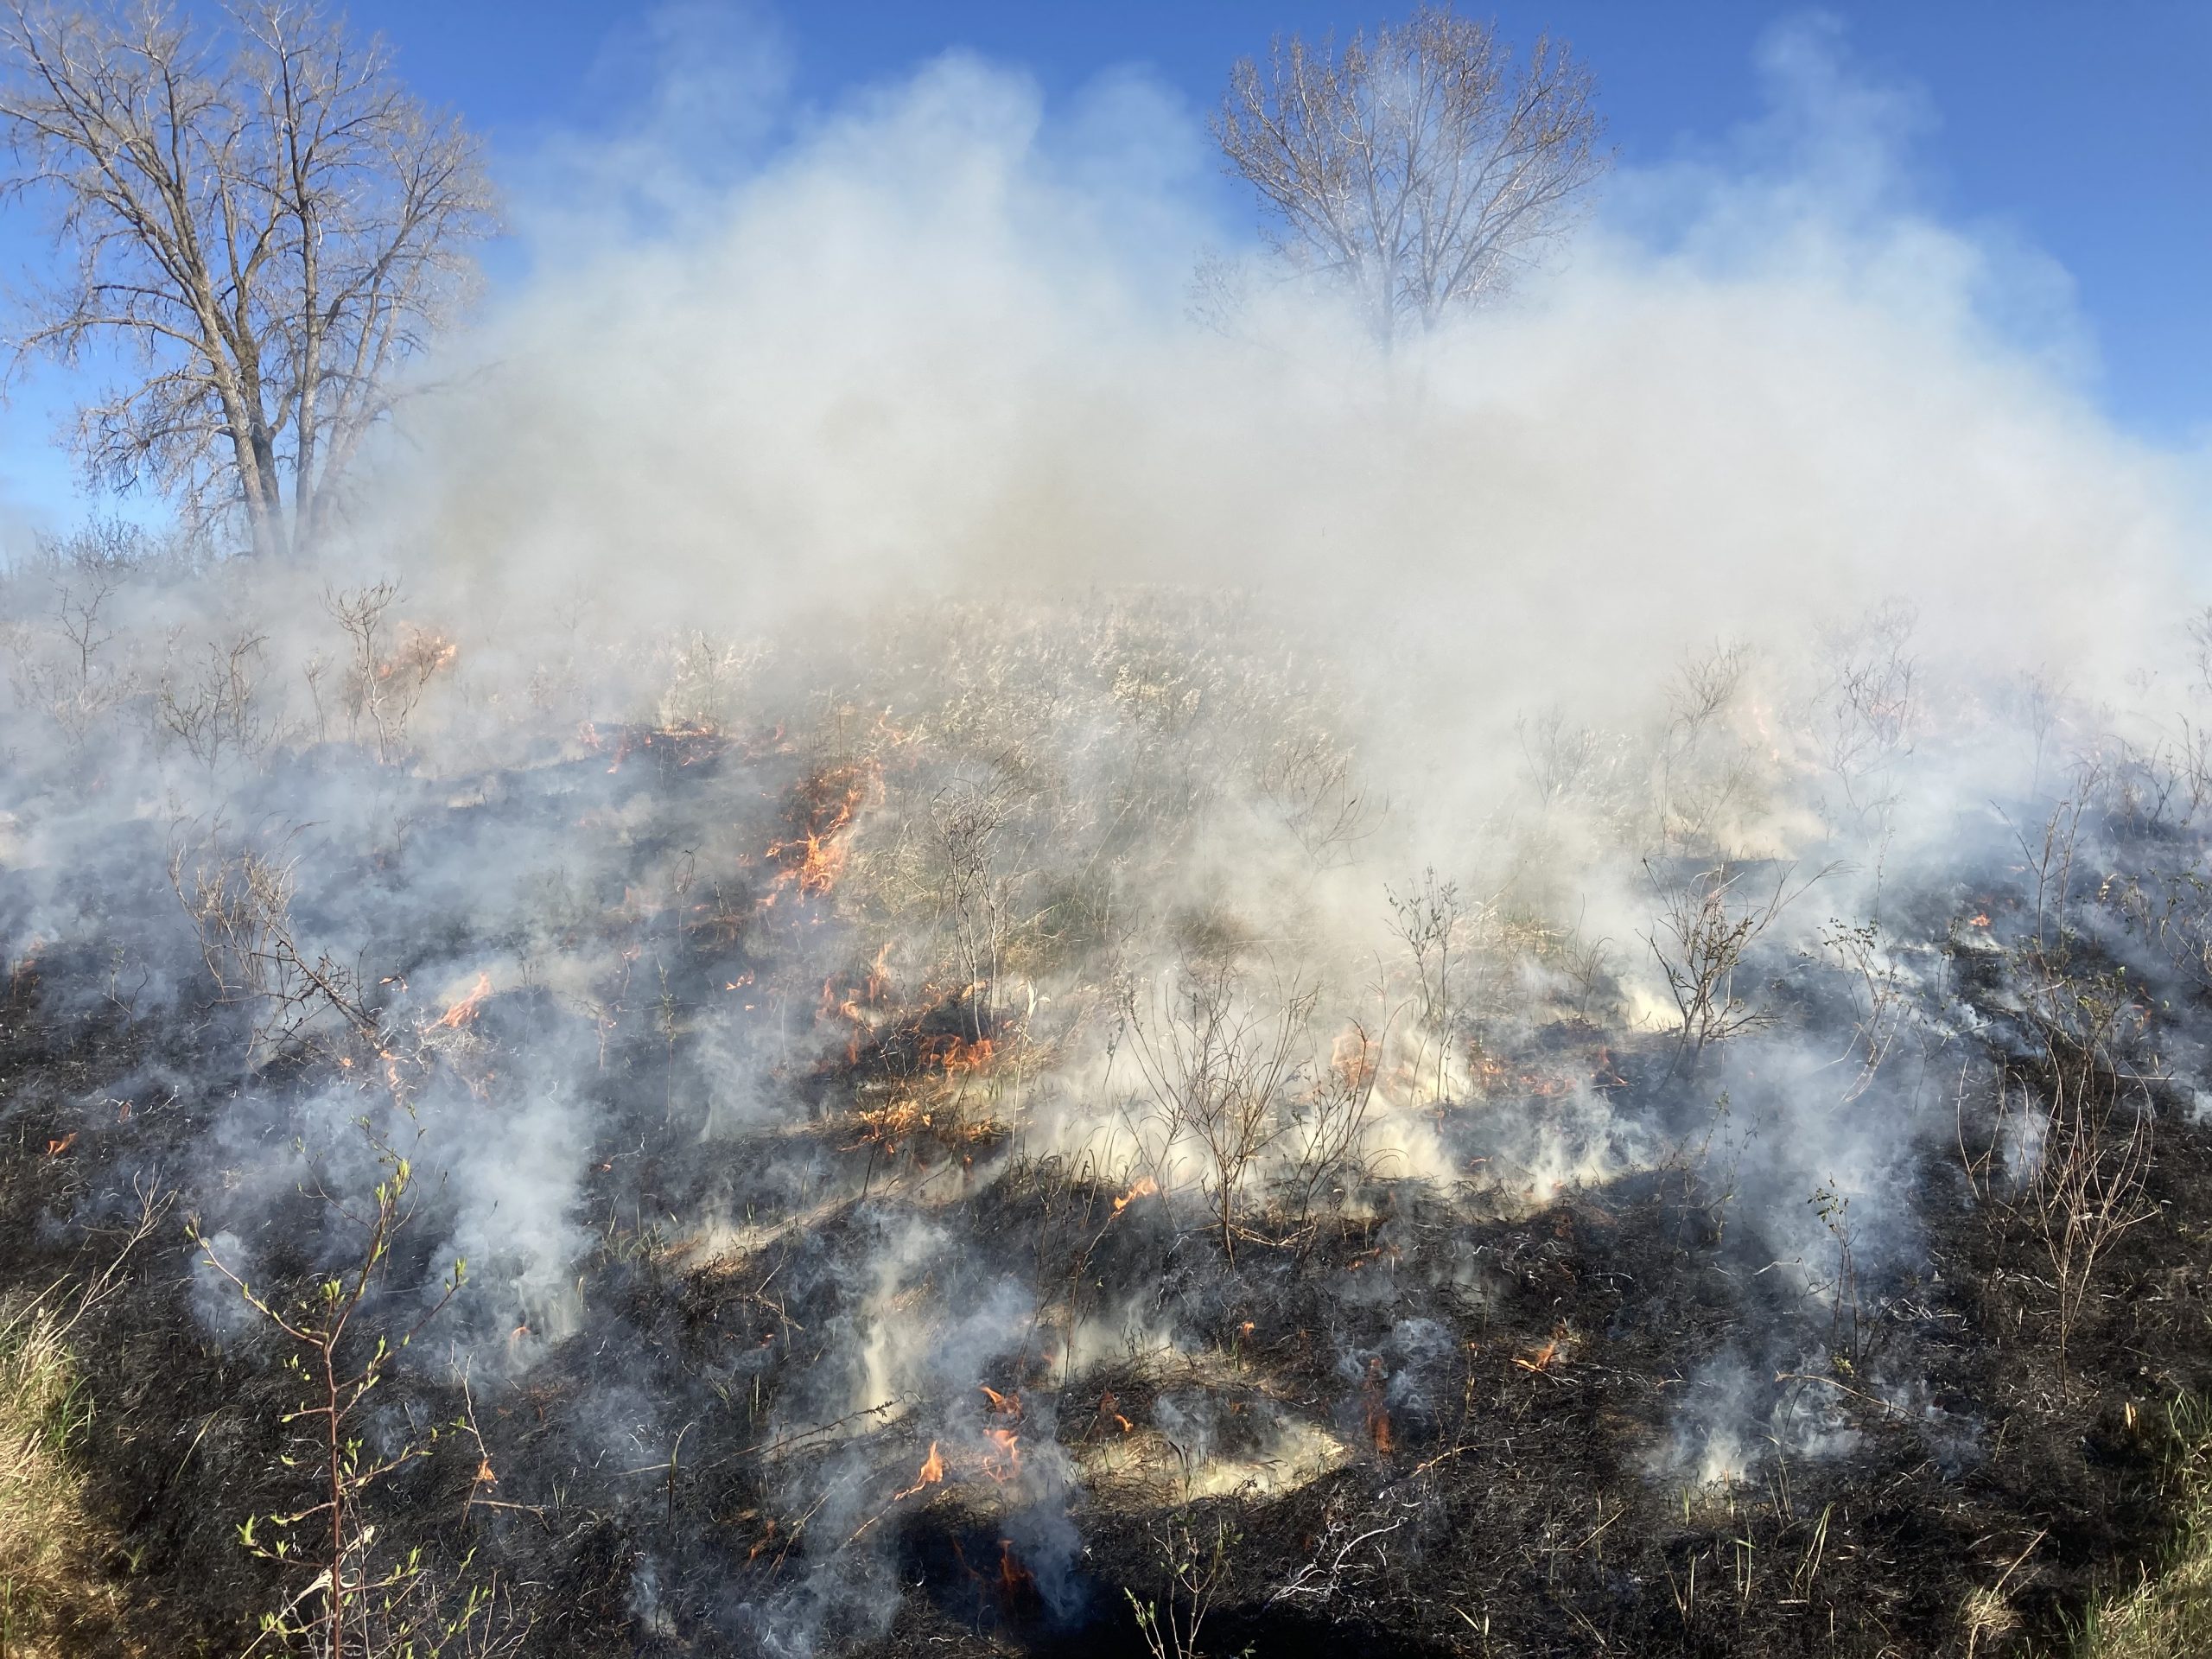
Photos from the burn.
Temperature – 52 F Relative humidity – 32% Wind speed (max gusts) – 10 (22) mph wind direction – N Ignition time: 2:06 PM End time: 3:44 PM Burn crew: Jared, Gretel, Stuart, Amy W., Matthew G.
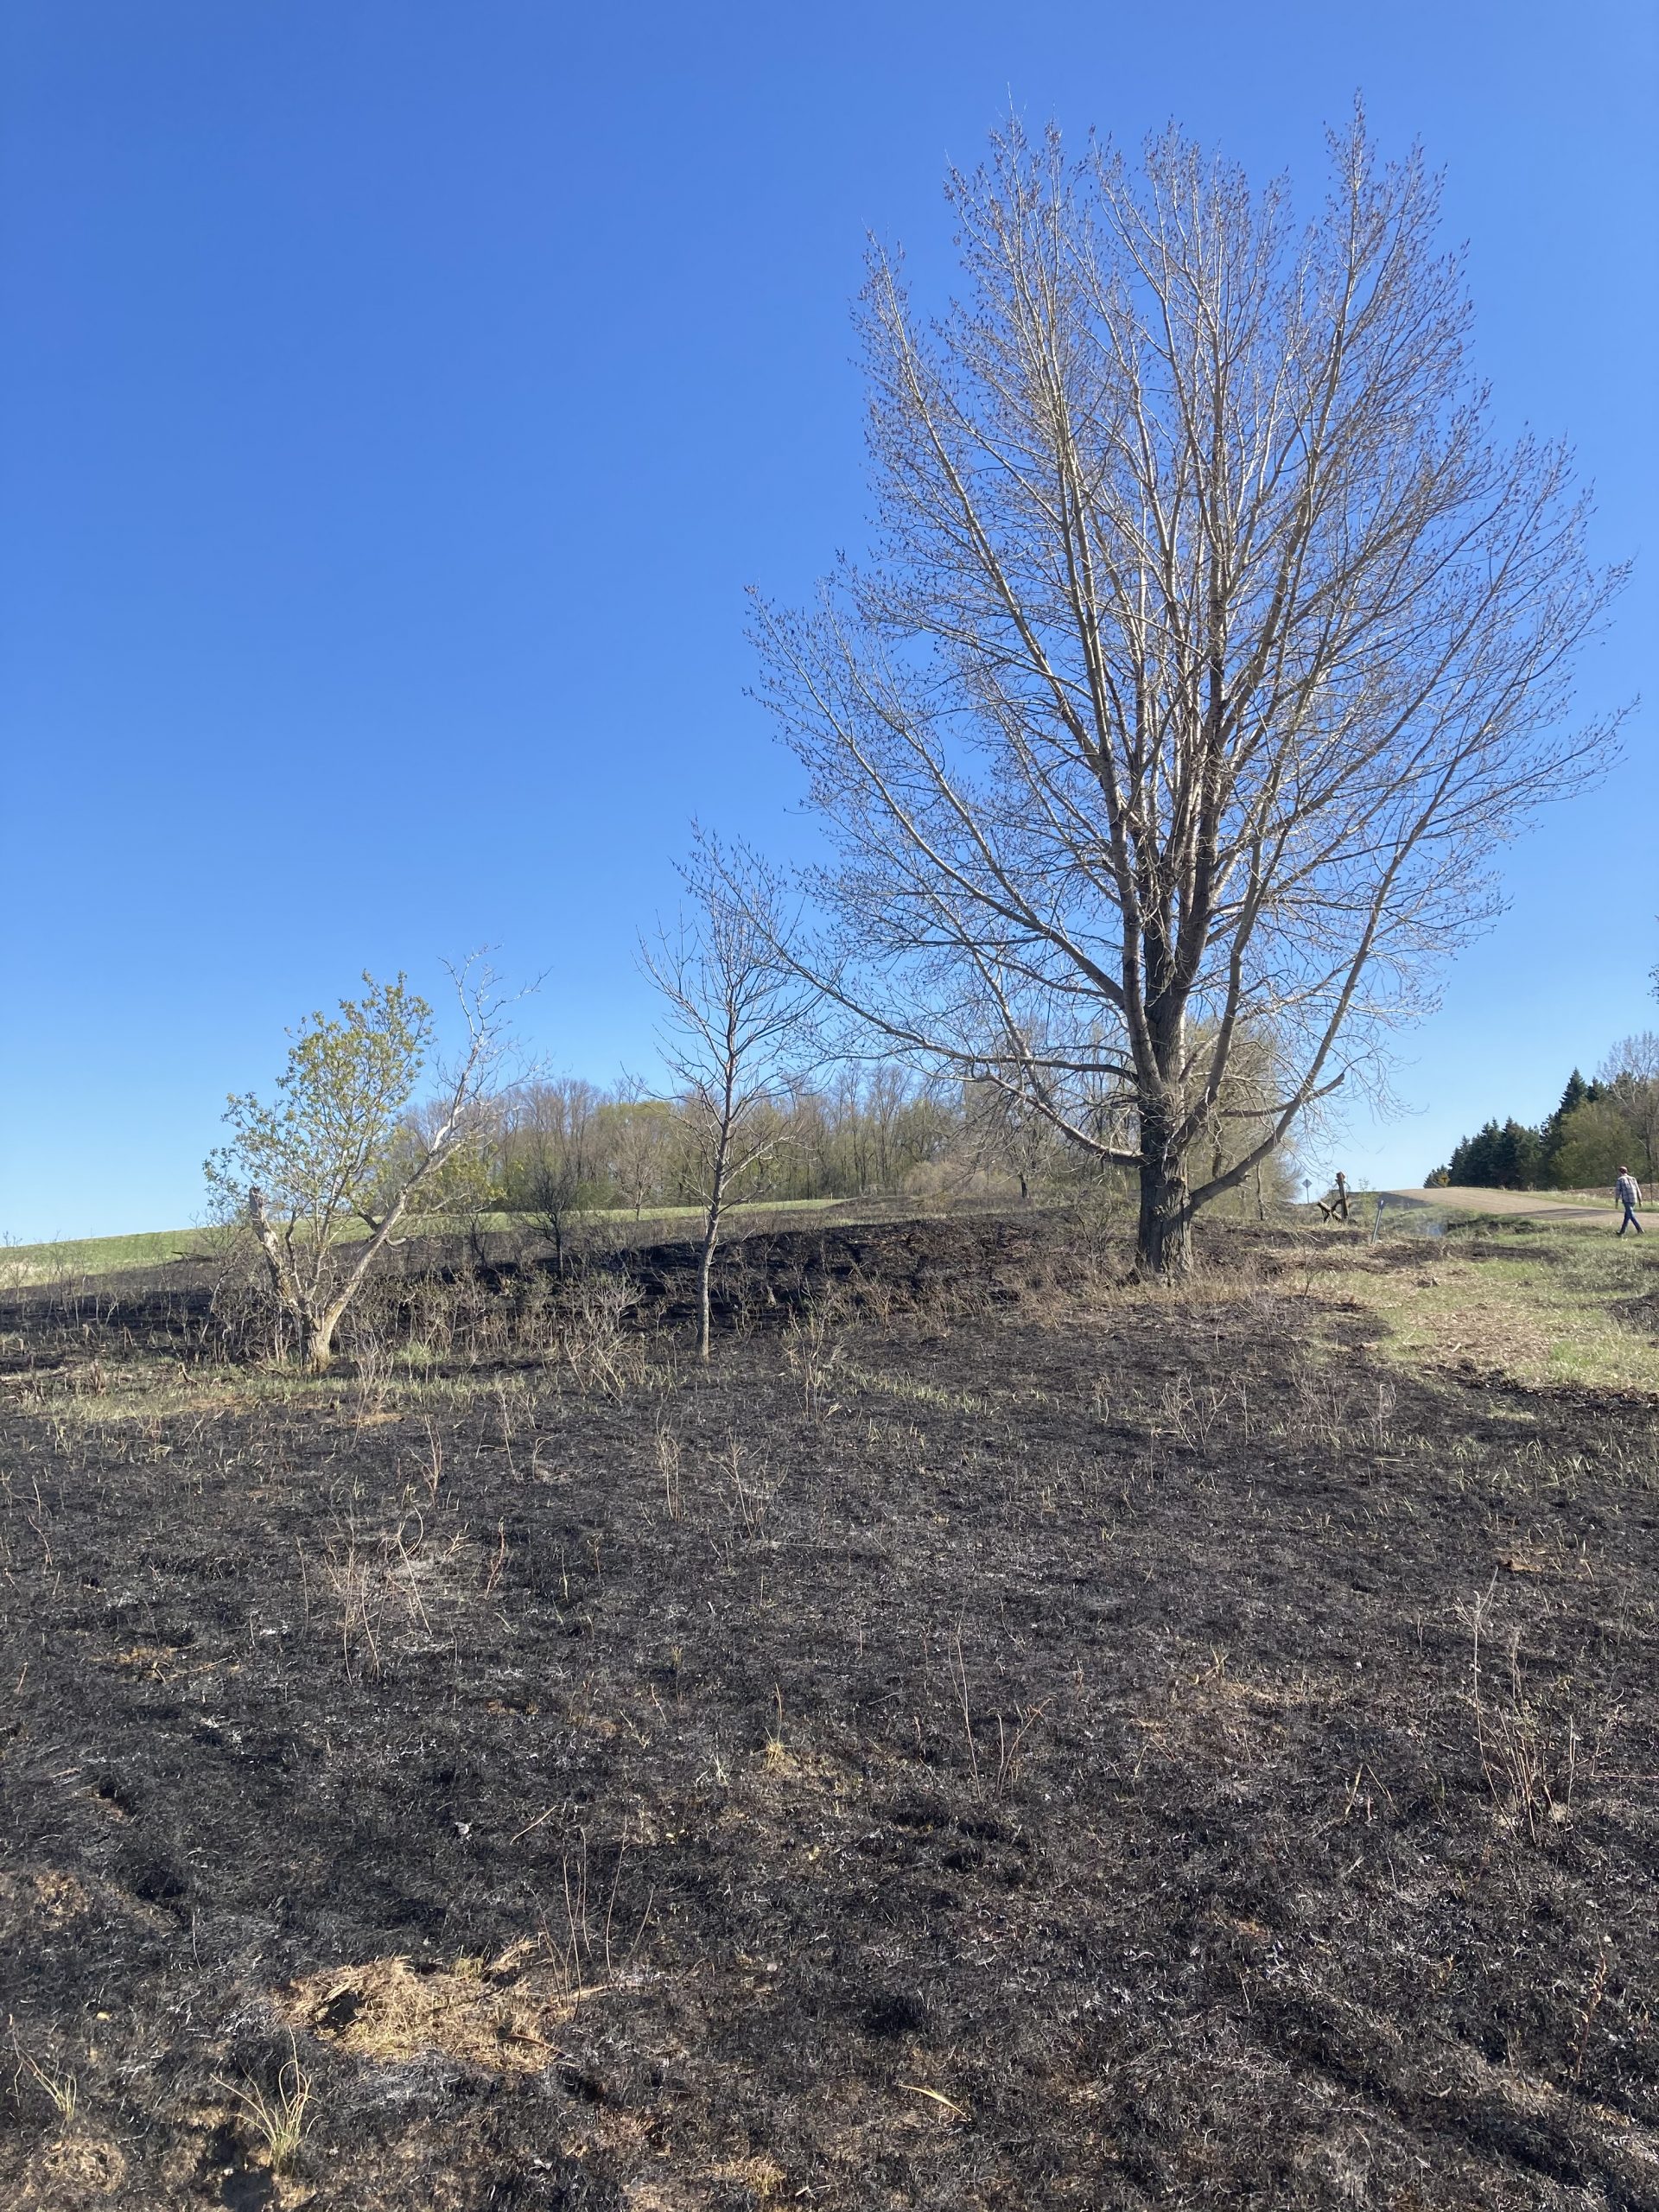
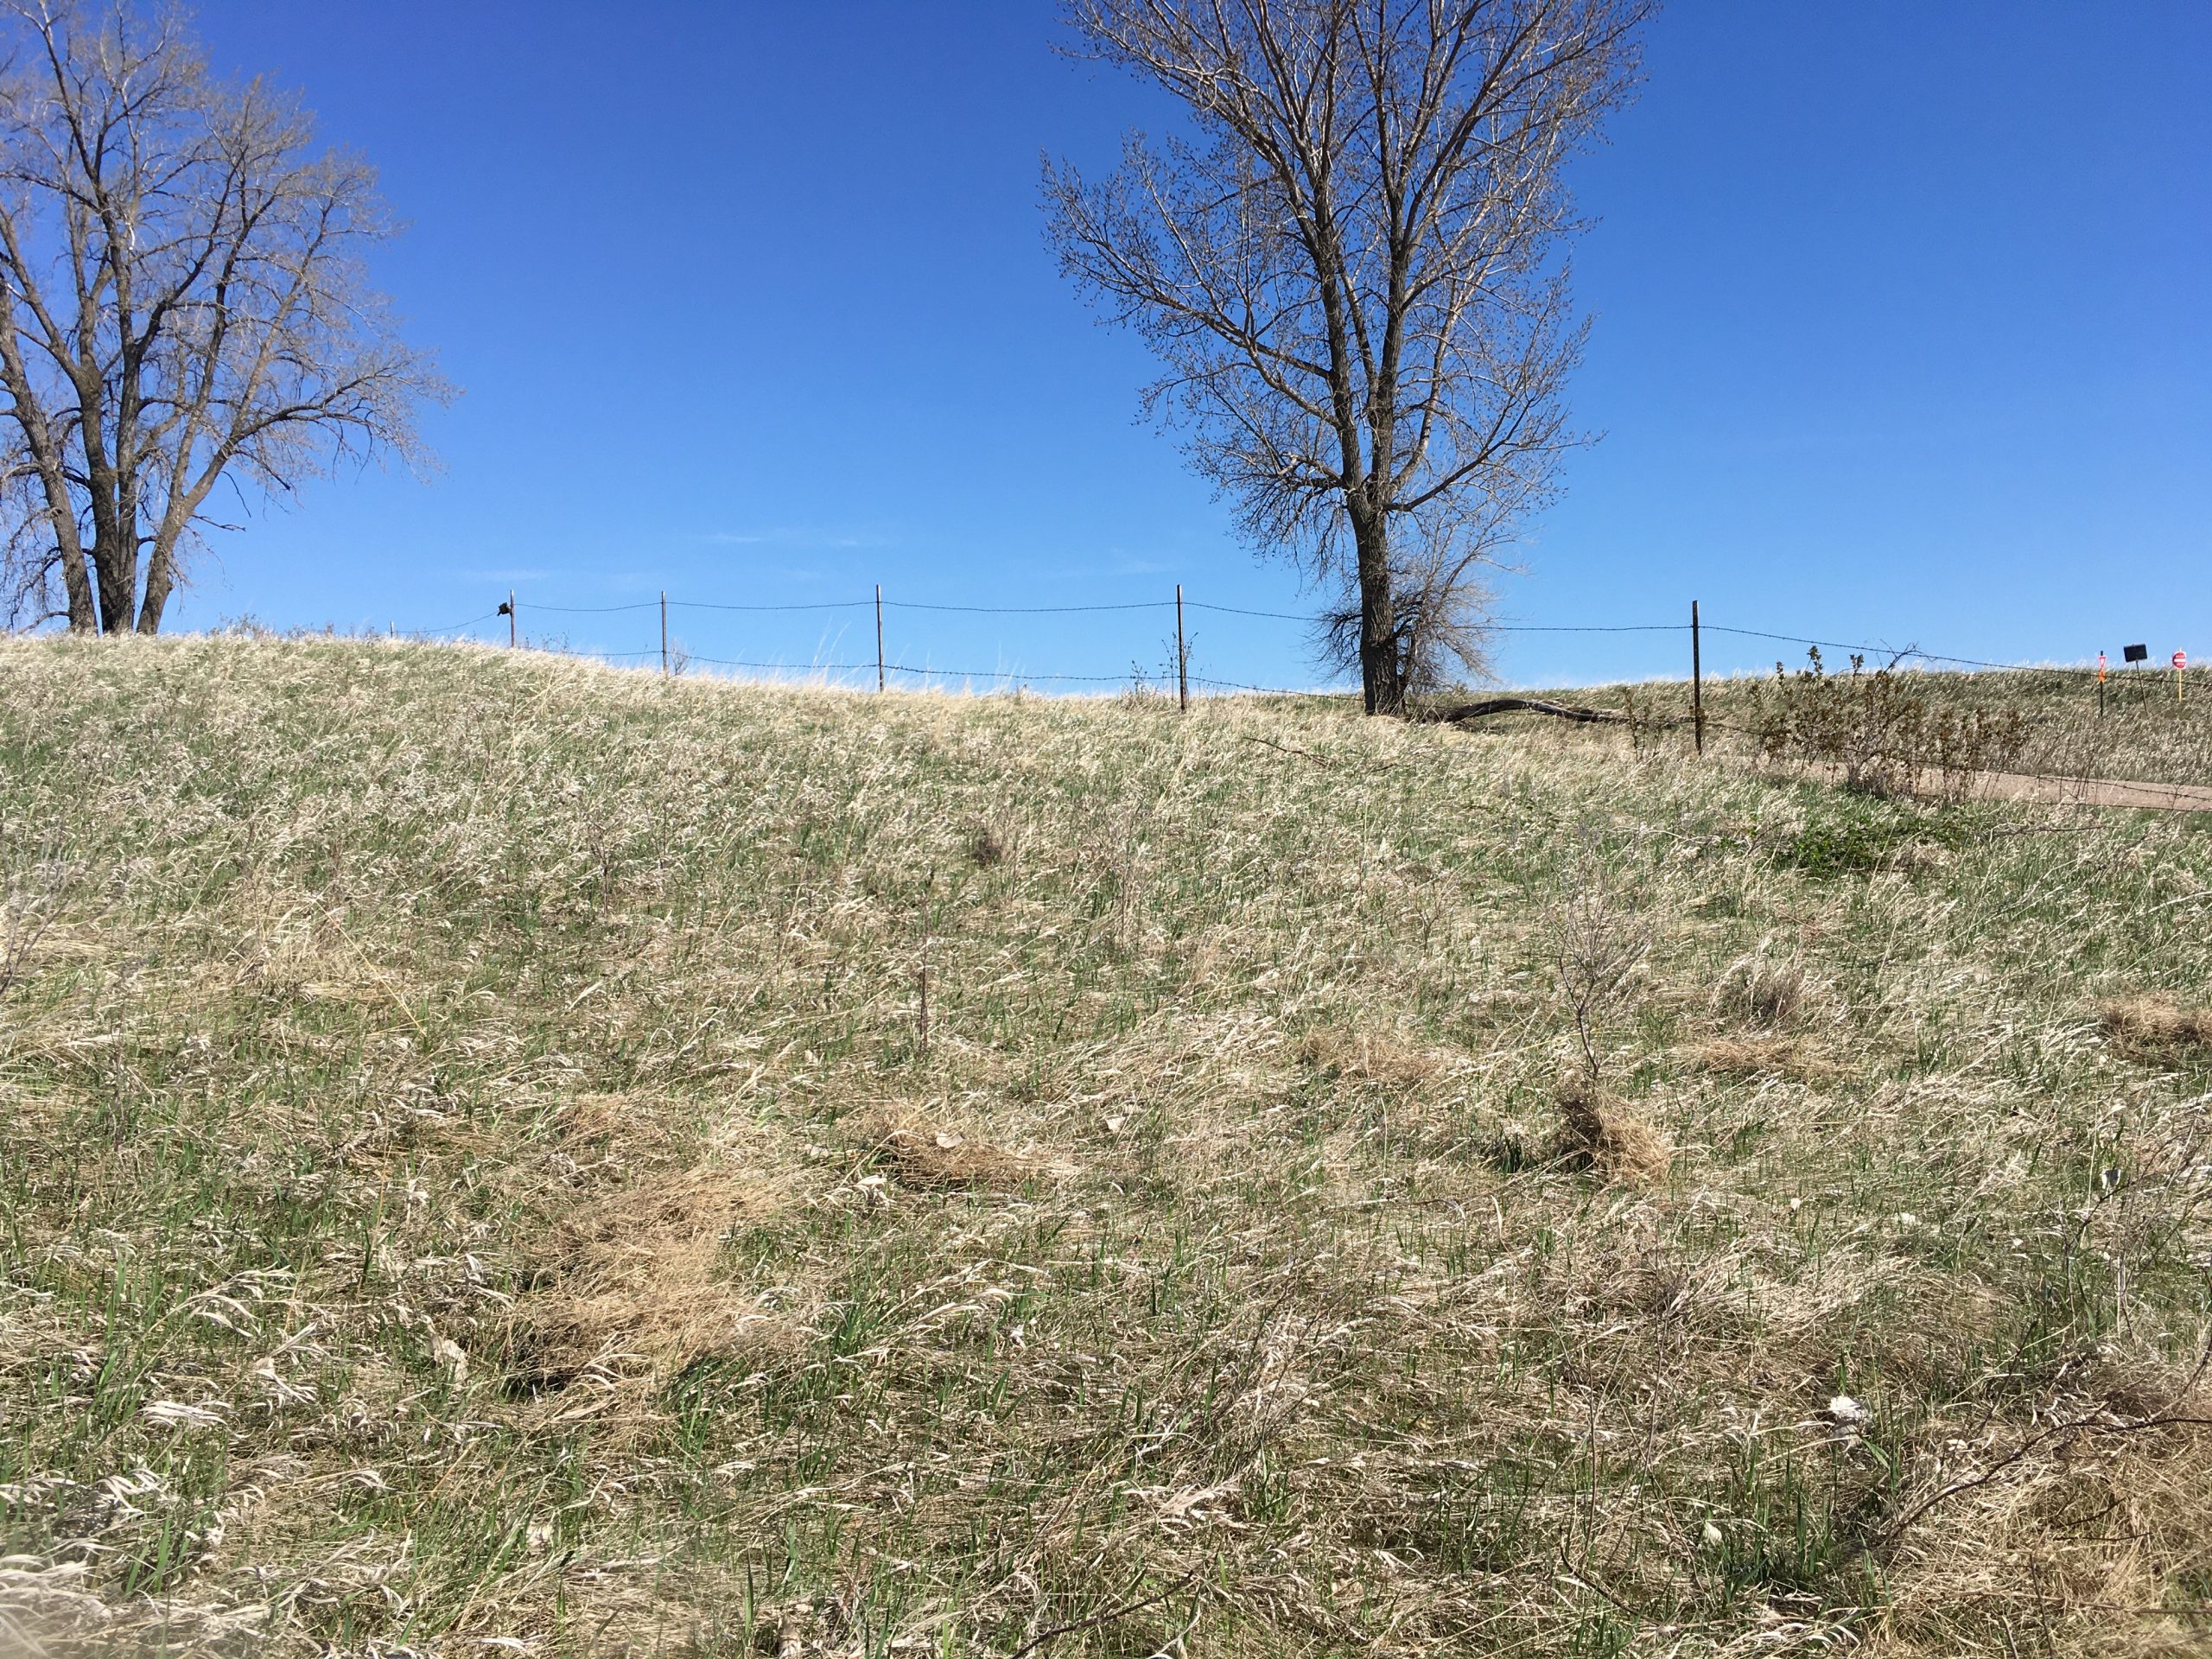
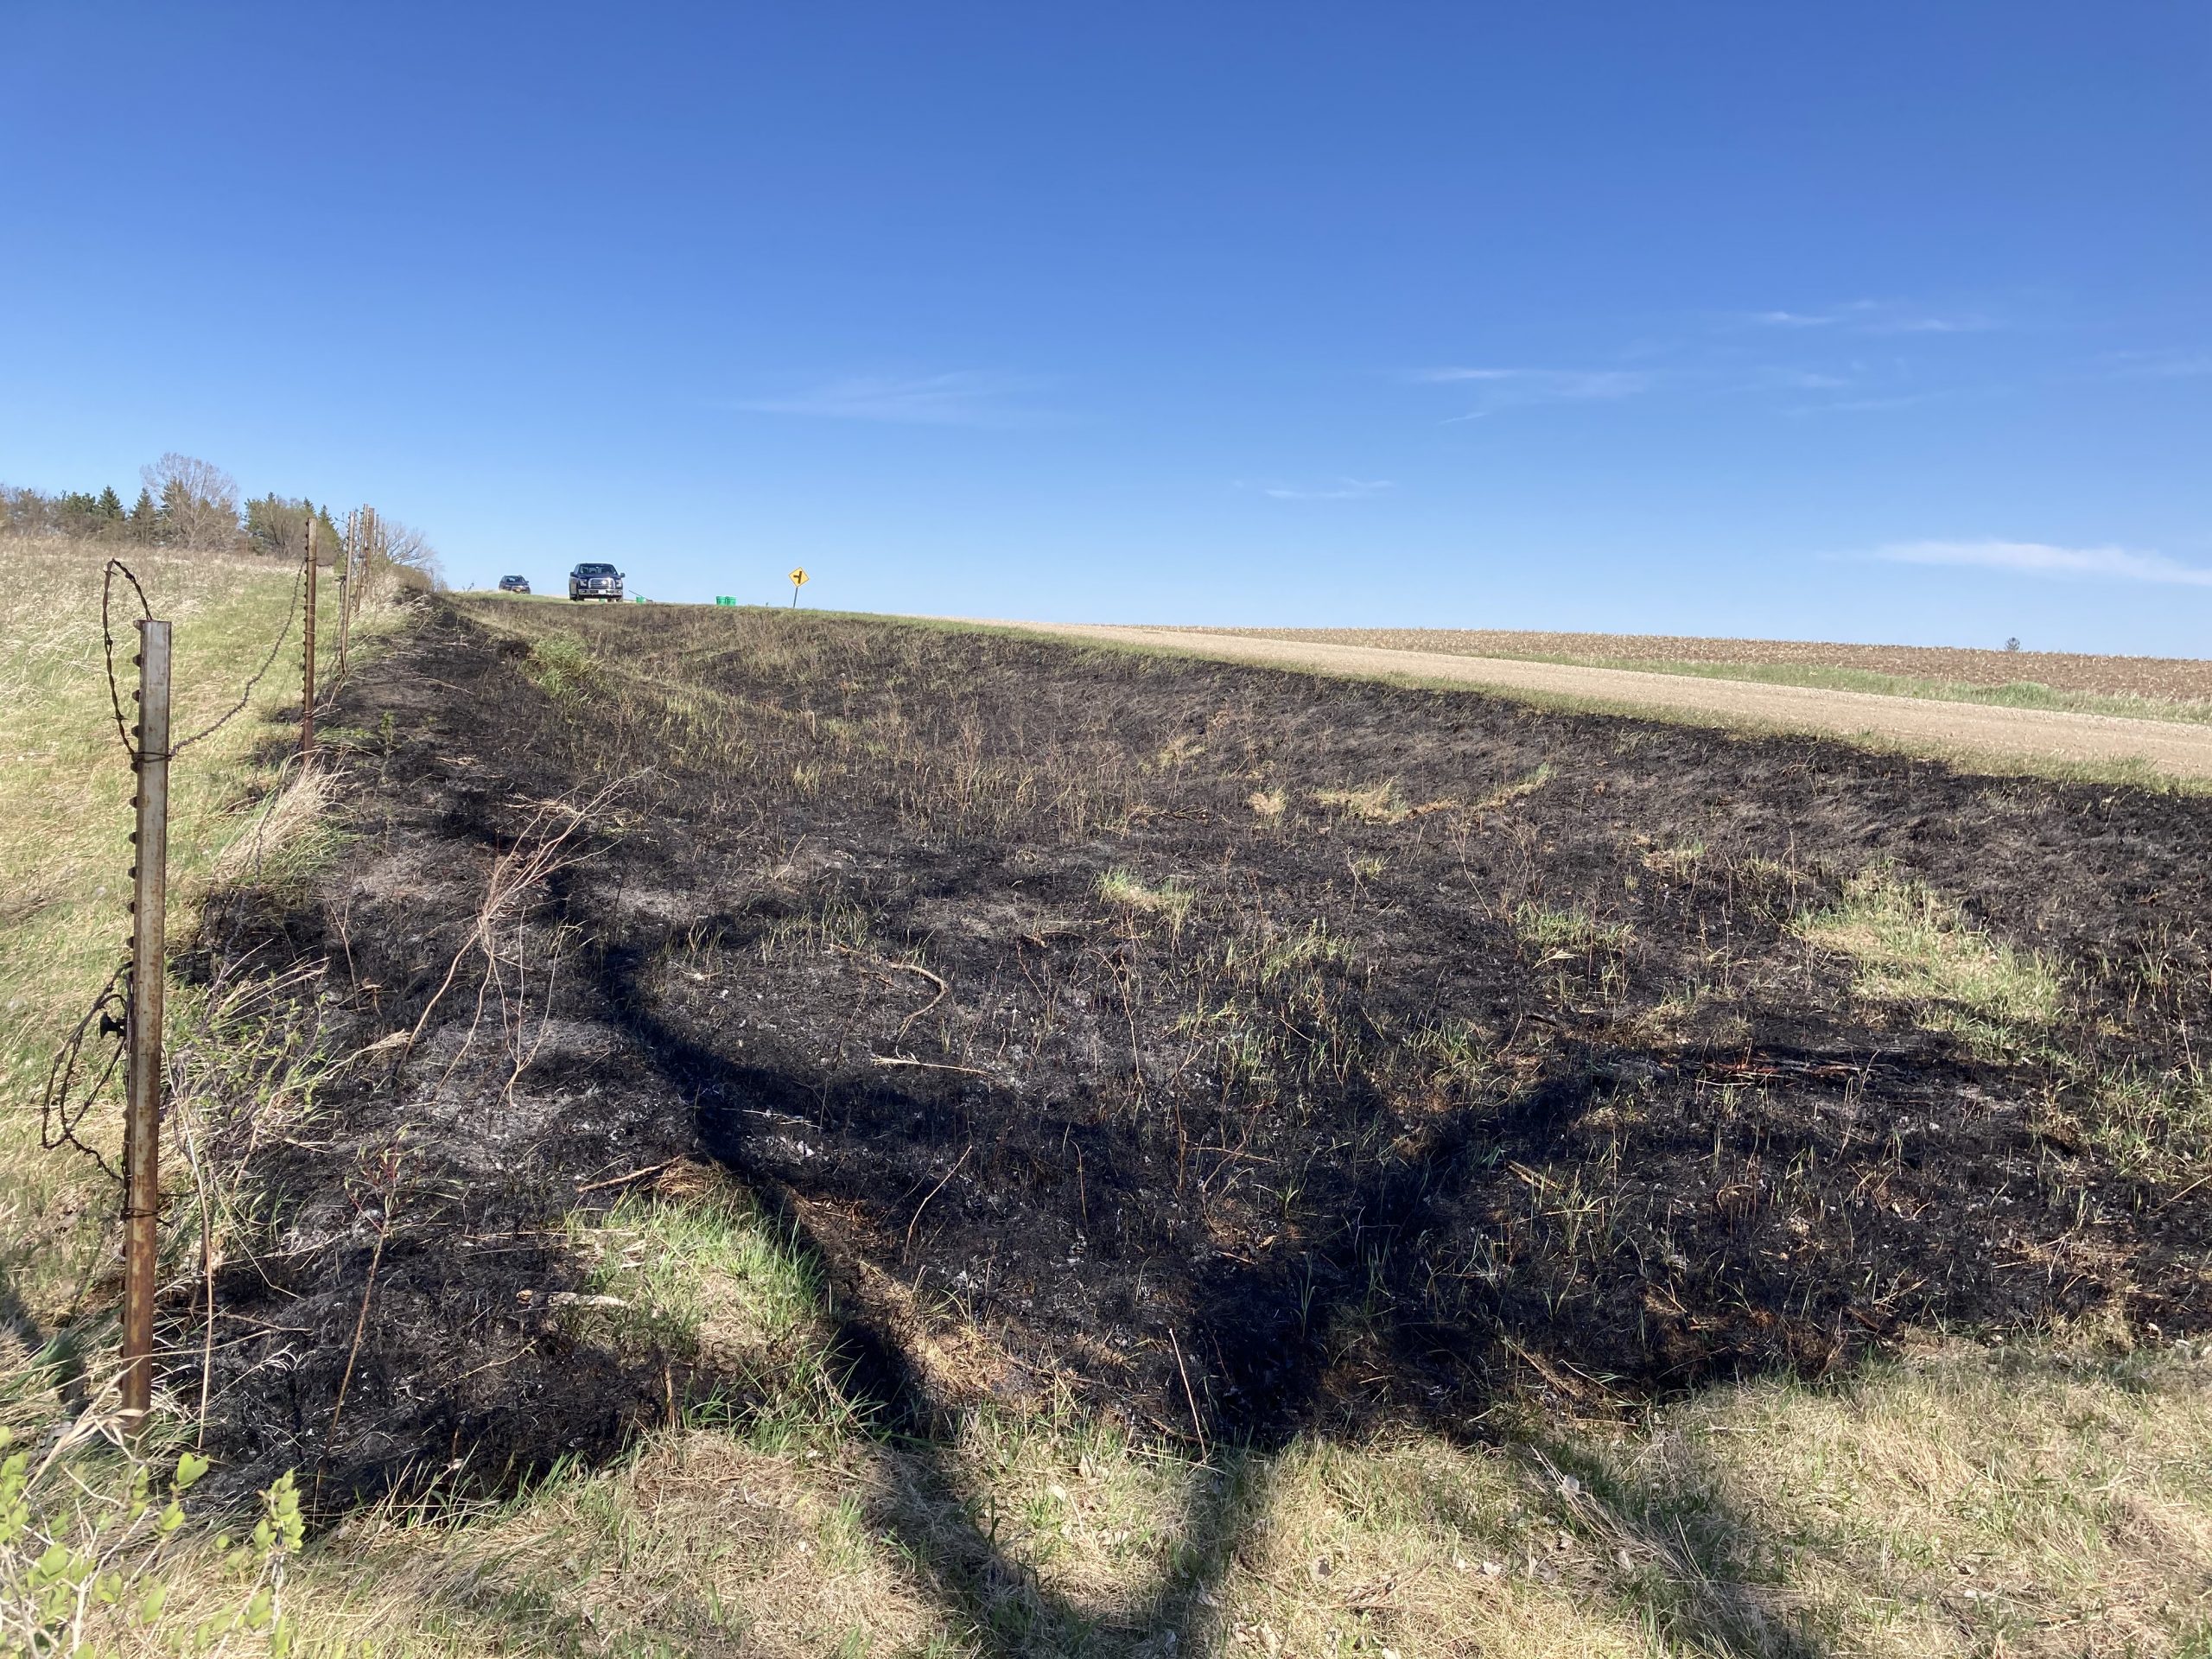
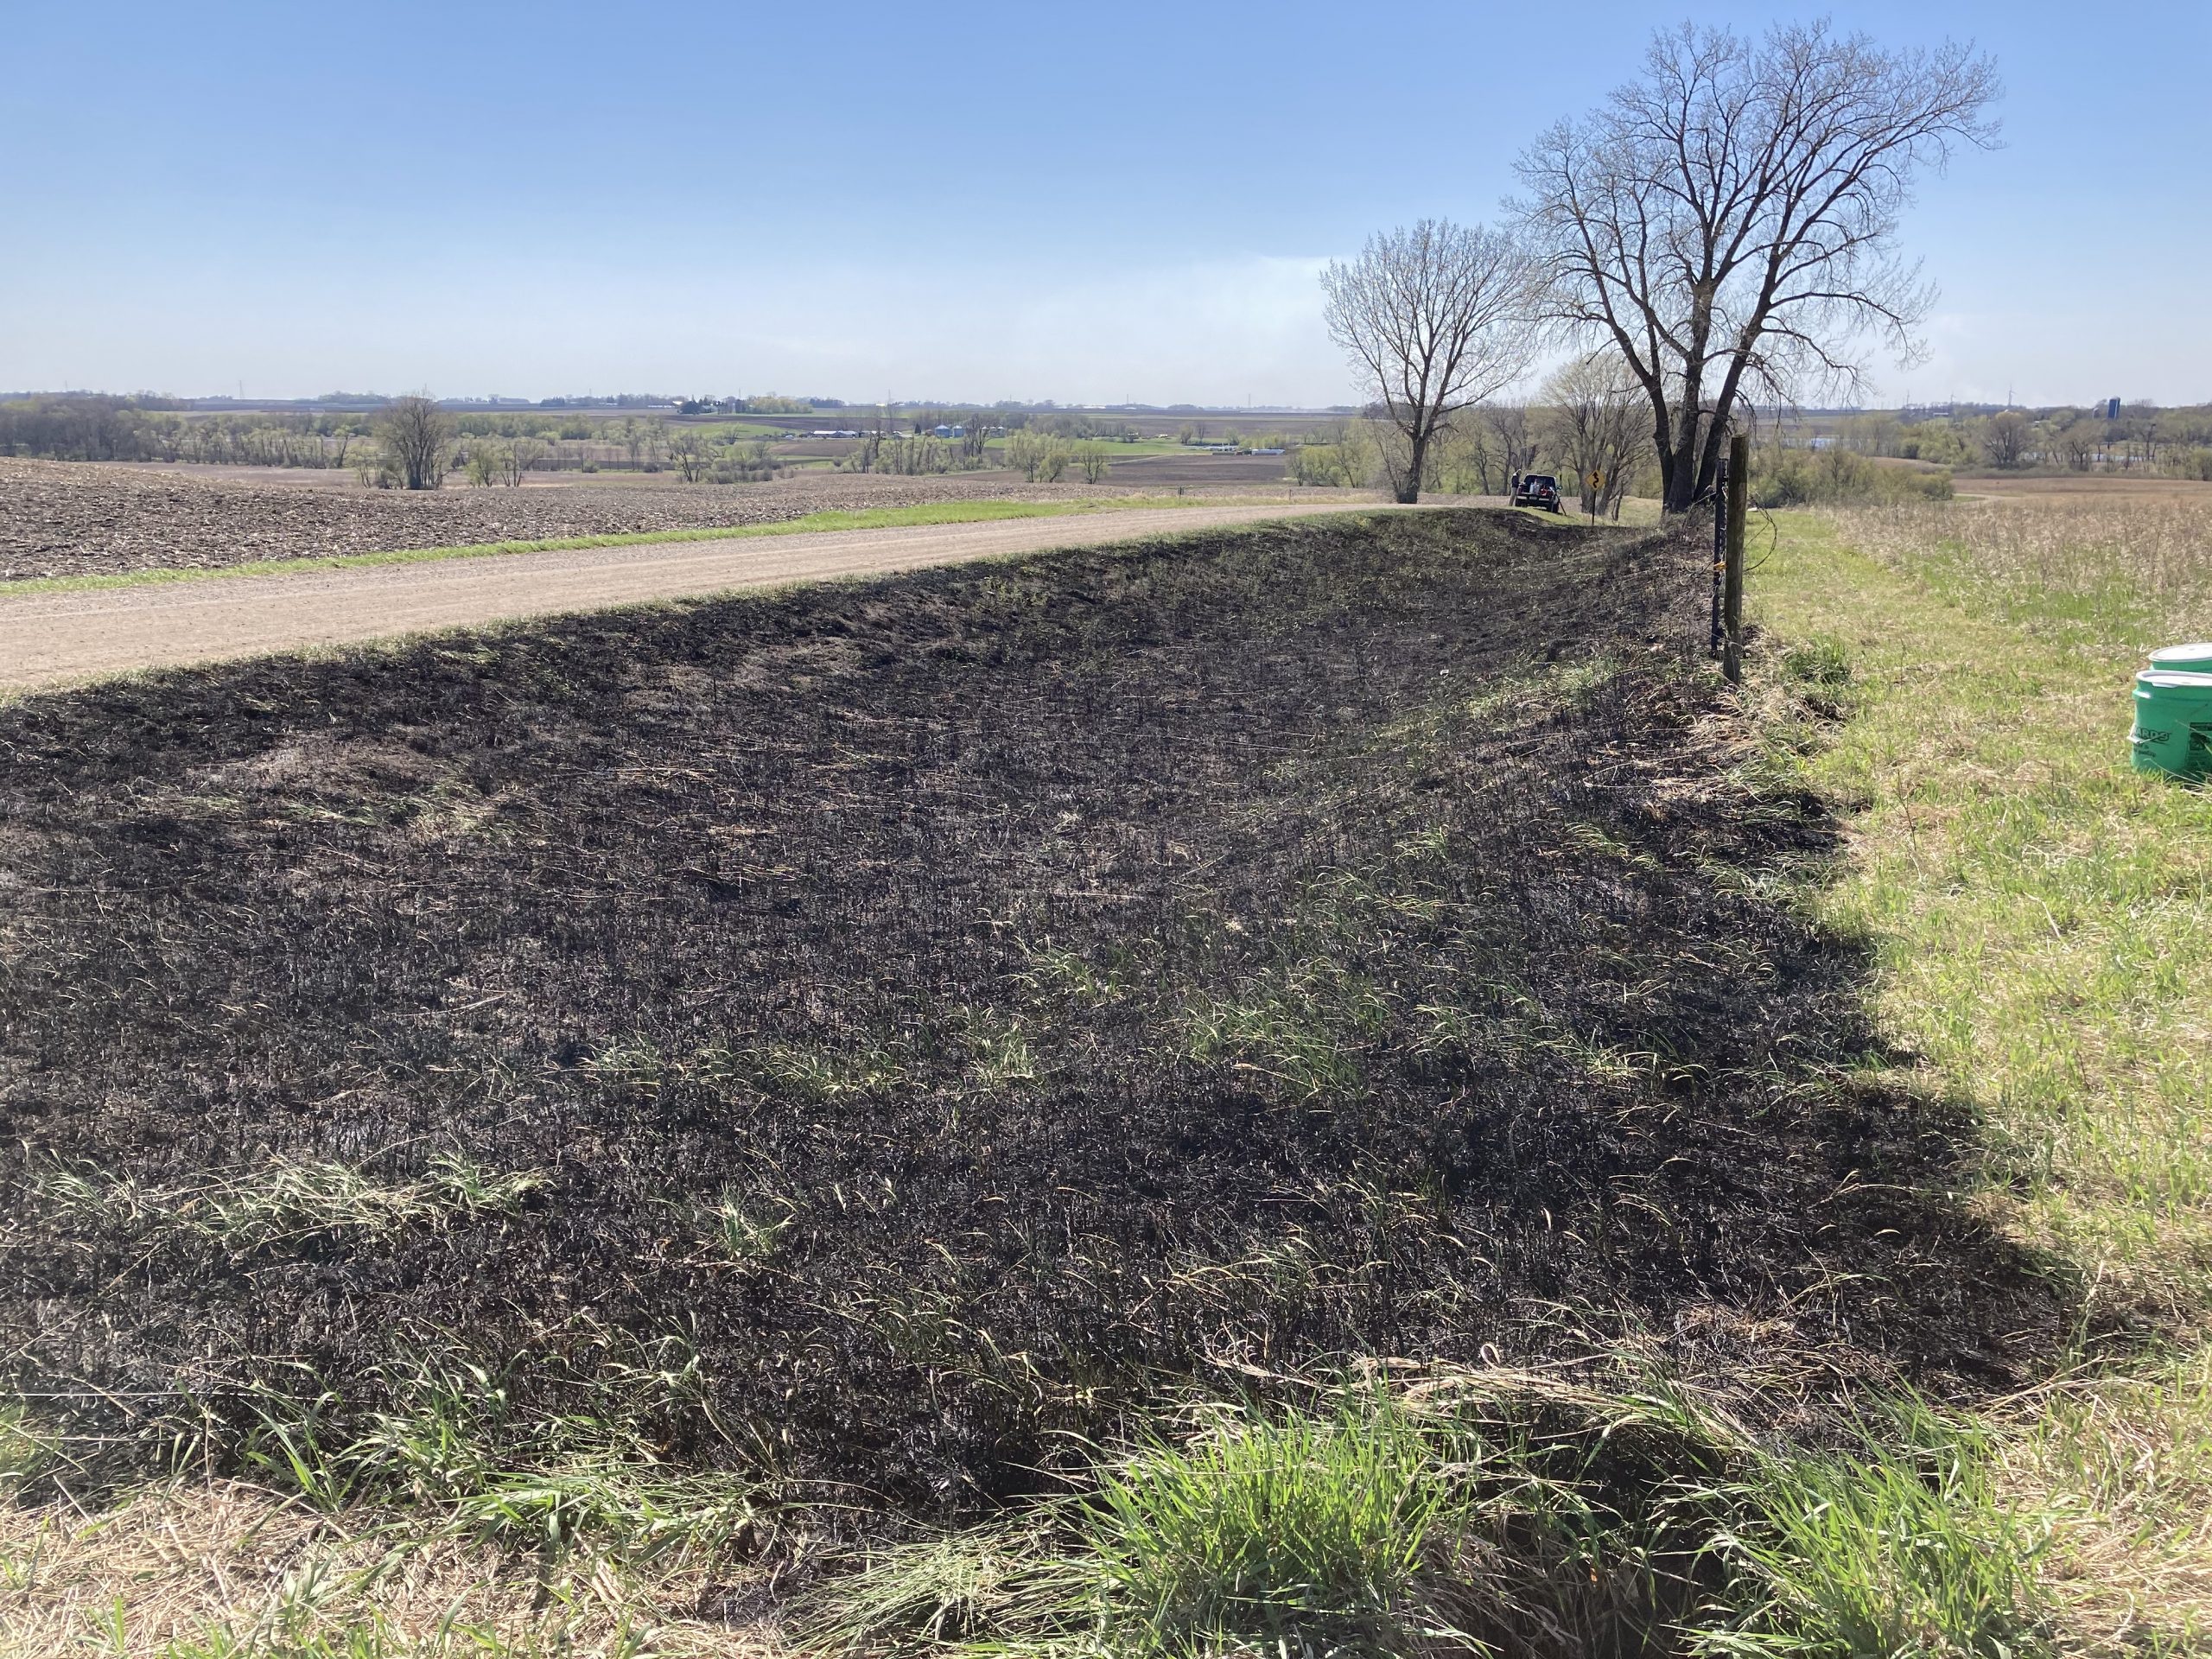
Before and after photos from our prescribed burn at Loeffler’s corner east.
For our fourth and final burn of the afternoon on May 4, 2021, we ventured back into Douglas County for a burn at kjs. Earlier in the day, Mia and I prepared burn breaks by cutting woody plants and mowing burn breaks. Despite increasing humidity and less consistent winds, the prescribed burn at kjs proceeded quickly and produced a beautifully consistent burn. We ignited a mowed a line in the southeast corner along our mowed burn break. Once the line was secure and we had 5-10 feet of black (burned area downwind), the crew split with one line lighting along Elk Lake Rd and the other along the dirt access road. Realized winds midway through the burn were lighter and more variable than anticipated. A couple ENE/NE wind gusts turned our backing fire into 5 second headfires (not part of the plan!) so we made a quick decision to ignite around the remaining perimeter and finish up the burn while avoiding any further unexpected wind shifts. We extinguished a couple remaining hotspots, packed up our equipment, and returned to the Echinacea Project research base for dinner after a successful day of burning.
While the prescribed burn at kjs was completed in just over 15 minutes, this and other burns are the culmination of weeks if not months of planning and preparation. Safety is our #1 priority when conducting prescribed burns. We developed written burn plans for each unit outlining the conditions (e.g. temperature, humidity, wind speed and direction, fuel conditions, etc.) when fire should behave predictibly and a burn can be conducted safely. This is the prescribed part of prescribed burns. Our burn plan also includes a step-by-step plan for igniting a fire and keeping it contained within the burn unit.
Stay tuned for more prescribed burns and our research investigating the effects of fire on plant reproduction and population dynamics in fragmented prairies!
Temperature – 53 F Relative humidity – 26% Wind speed (max gusts) – 8 (16) mph wind direction – NNW Ignition time – 6:11 PM End time – 6:27 PM Burn crew: Jared, Stuart, Gretel, Mia
Upon completion of the prescribed burn at yellow orchid hill east we moved equipment and staged vehicles just a short stroll down Wennersborg Rd at yellow orchid hill west. Gretel finished mowing and the entire crew walked the mowed burn break. We discussed the plan for ignition, raked around several wooden fence posts, and wet down the wooden posts with a backpack pump.
We ignited a test fire in the southeastern corner of the burn unit. The test fire behaved as predicted so we slowly extended the ignition line along the downwind side of the unit (up the steep south-facing side of the ditch and back down the more gentle north slope across the fence line). Once the downwind fire break of the burn unit had been secured, Gretel and Mia set about igniting along the base of the ditch while Jared and Stuart slowly rounded northeast corner of the burn unit. Jared and Stuart held their position at the northeast corner until Gretel and Mia reached the wooden fence posts in the southwest corner of the burn unit. At this point, Jared and Gretel ignited the north and west edges of the burn unit respectively while Stuart and Mia expertly kept fire from creeping across our mowed breaks. The whole crew met in the northwest corner and paused to watch the headfire dash uphill to complete another successful prescribed burn.
Temperature – 54 F Relative humidity – 28% Wind speed (max gusts) – 15 (19) mph wind direction – NNW Ignition time – 5:01 PM End time – 5:27 PM Burn crew: Jared, Stuart, Gretel, Mia
Before and after photos illustrating the burn at yoh.w.
After wrapping up our first remnant burn of the season at east riley, the crew ventured into the wild western prairies of Grant County. Earlier in the day, Mia mowed burn breaks at yellow orchid hill east. This roadside patch had considerably more fuel than east riley and NW winds remained stiff when we arrived. Once water buckets had been staged and the crew briefed, we ignited a test fire in the southeast corner. This fire backed beautifully against the wind, moving steadily and burning fuel completely. One of my takeaways from burns this spring is that prescribed burns in a little lower relative humidity (RH = 25-30) and a little higher winds (12-18 mph sustained) seem to produce great results in burn units where brome is the primary fuel.
A nice sequence of photos illustrating how the burn at yoh.e progressed. We started with a test fire and observed that small fire before proceeding to burn the entire unit. We decided to ignite the downwind edge of the burn unit and allow that fire to back against the stiff wind. Looking at the fourth and fifth photos, you can see the wind push smoke to the south as the fire backs slowly against the wind moving north.
We decided to let the fire back against the wind across the entire burn unit. Once sufficient black had been established in the southeast corner of the unit, we ignited a backing fire along the entire southern edge of the unit along Wennersborg Rd. After fire lines were secured, Gretel grabbed the push power and finished mowing burn breaks at yellow orchid hill west while Jared, Stuart, and Mia extinguished any remaining hotspots. 30 minutes after ignition, we were left with an almost entirely blackened burn unit. Beautiful, predictable prescribed burn!
Temperature – 53 F Relative humidity – 30% Wind speed (max gusts) – 18 (21) mph wind direction – NNW Ignition time – 3:44 PM End time – 4:14 PM Burn crew: Jared, Stuart, Gretel, Mia
Before and after photos looking east along Wennersborg Rd
Before and after photos looking west along Wennersborg Rd