For the past several years we have been investigating effects of prescribed fire on native ground-nesting bees in remnant prairies and restorations across our fragmented prairie landscape. We have a paper about effects of fire on the abundance and diversity of nesting bees in prep for a peer-reviewed journal. We are posting recommendations from this investigation now as a one-page non-technical document.
Funding for this project was provided by the Minnesota Environment and Natural Resources Trust Fund as recommended by the Legislative-Citizen Commission on Minnesota Resources (LCCMR) and by the National Science Foundation.
For the past few years we have been studying effects of prescribed fire on pollination, pollinators, and plants across our fragmented prairie landscape. We have a paper about effects of fire on pollen that we are preparing to submit to a peer-reviewed journal. We are posting recommendations from this investigation now as a one-page non-technical document.
Funding for this project was provided by the Minnesota Environment and Natural Resources Trust Fund as recommended by the Legislative-Citizen Commission on Minnesota Resources (LCCMR) and by the National Science Foundation.
For the past few years we have been studying effects of prescribed fire on pollination, pollinators, and plants across our fragmented prairie landscape. We have three papers we are preparing for submission to peer-reviewed journals. From each, we have recommendations for land managers interested in conserving native prairie bees and plants. We are posting these recommendations now in a one-page non-technical format.
The first paper is about prescribed fire effects on pollination and pollinator visitation. Read the recommendations that are based on the paper.
Expect two more one-pagers tomorrow.
Funding for this project was provided by the Minnesota Environment and Natural Resources Trust Fund as recommended by the Legislative-Citizen Commission on Minnesota Resources (LCCMR) and by the National Science Foundation.
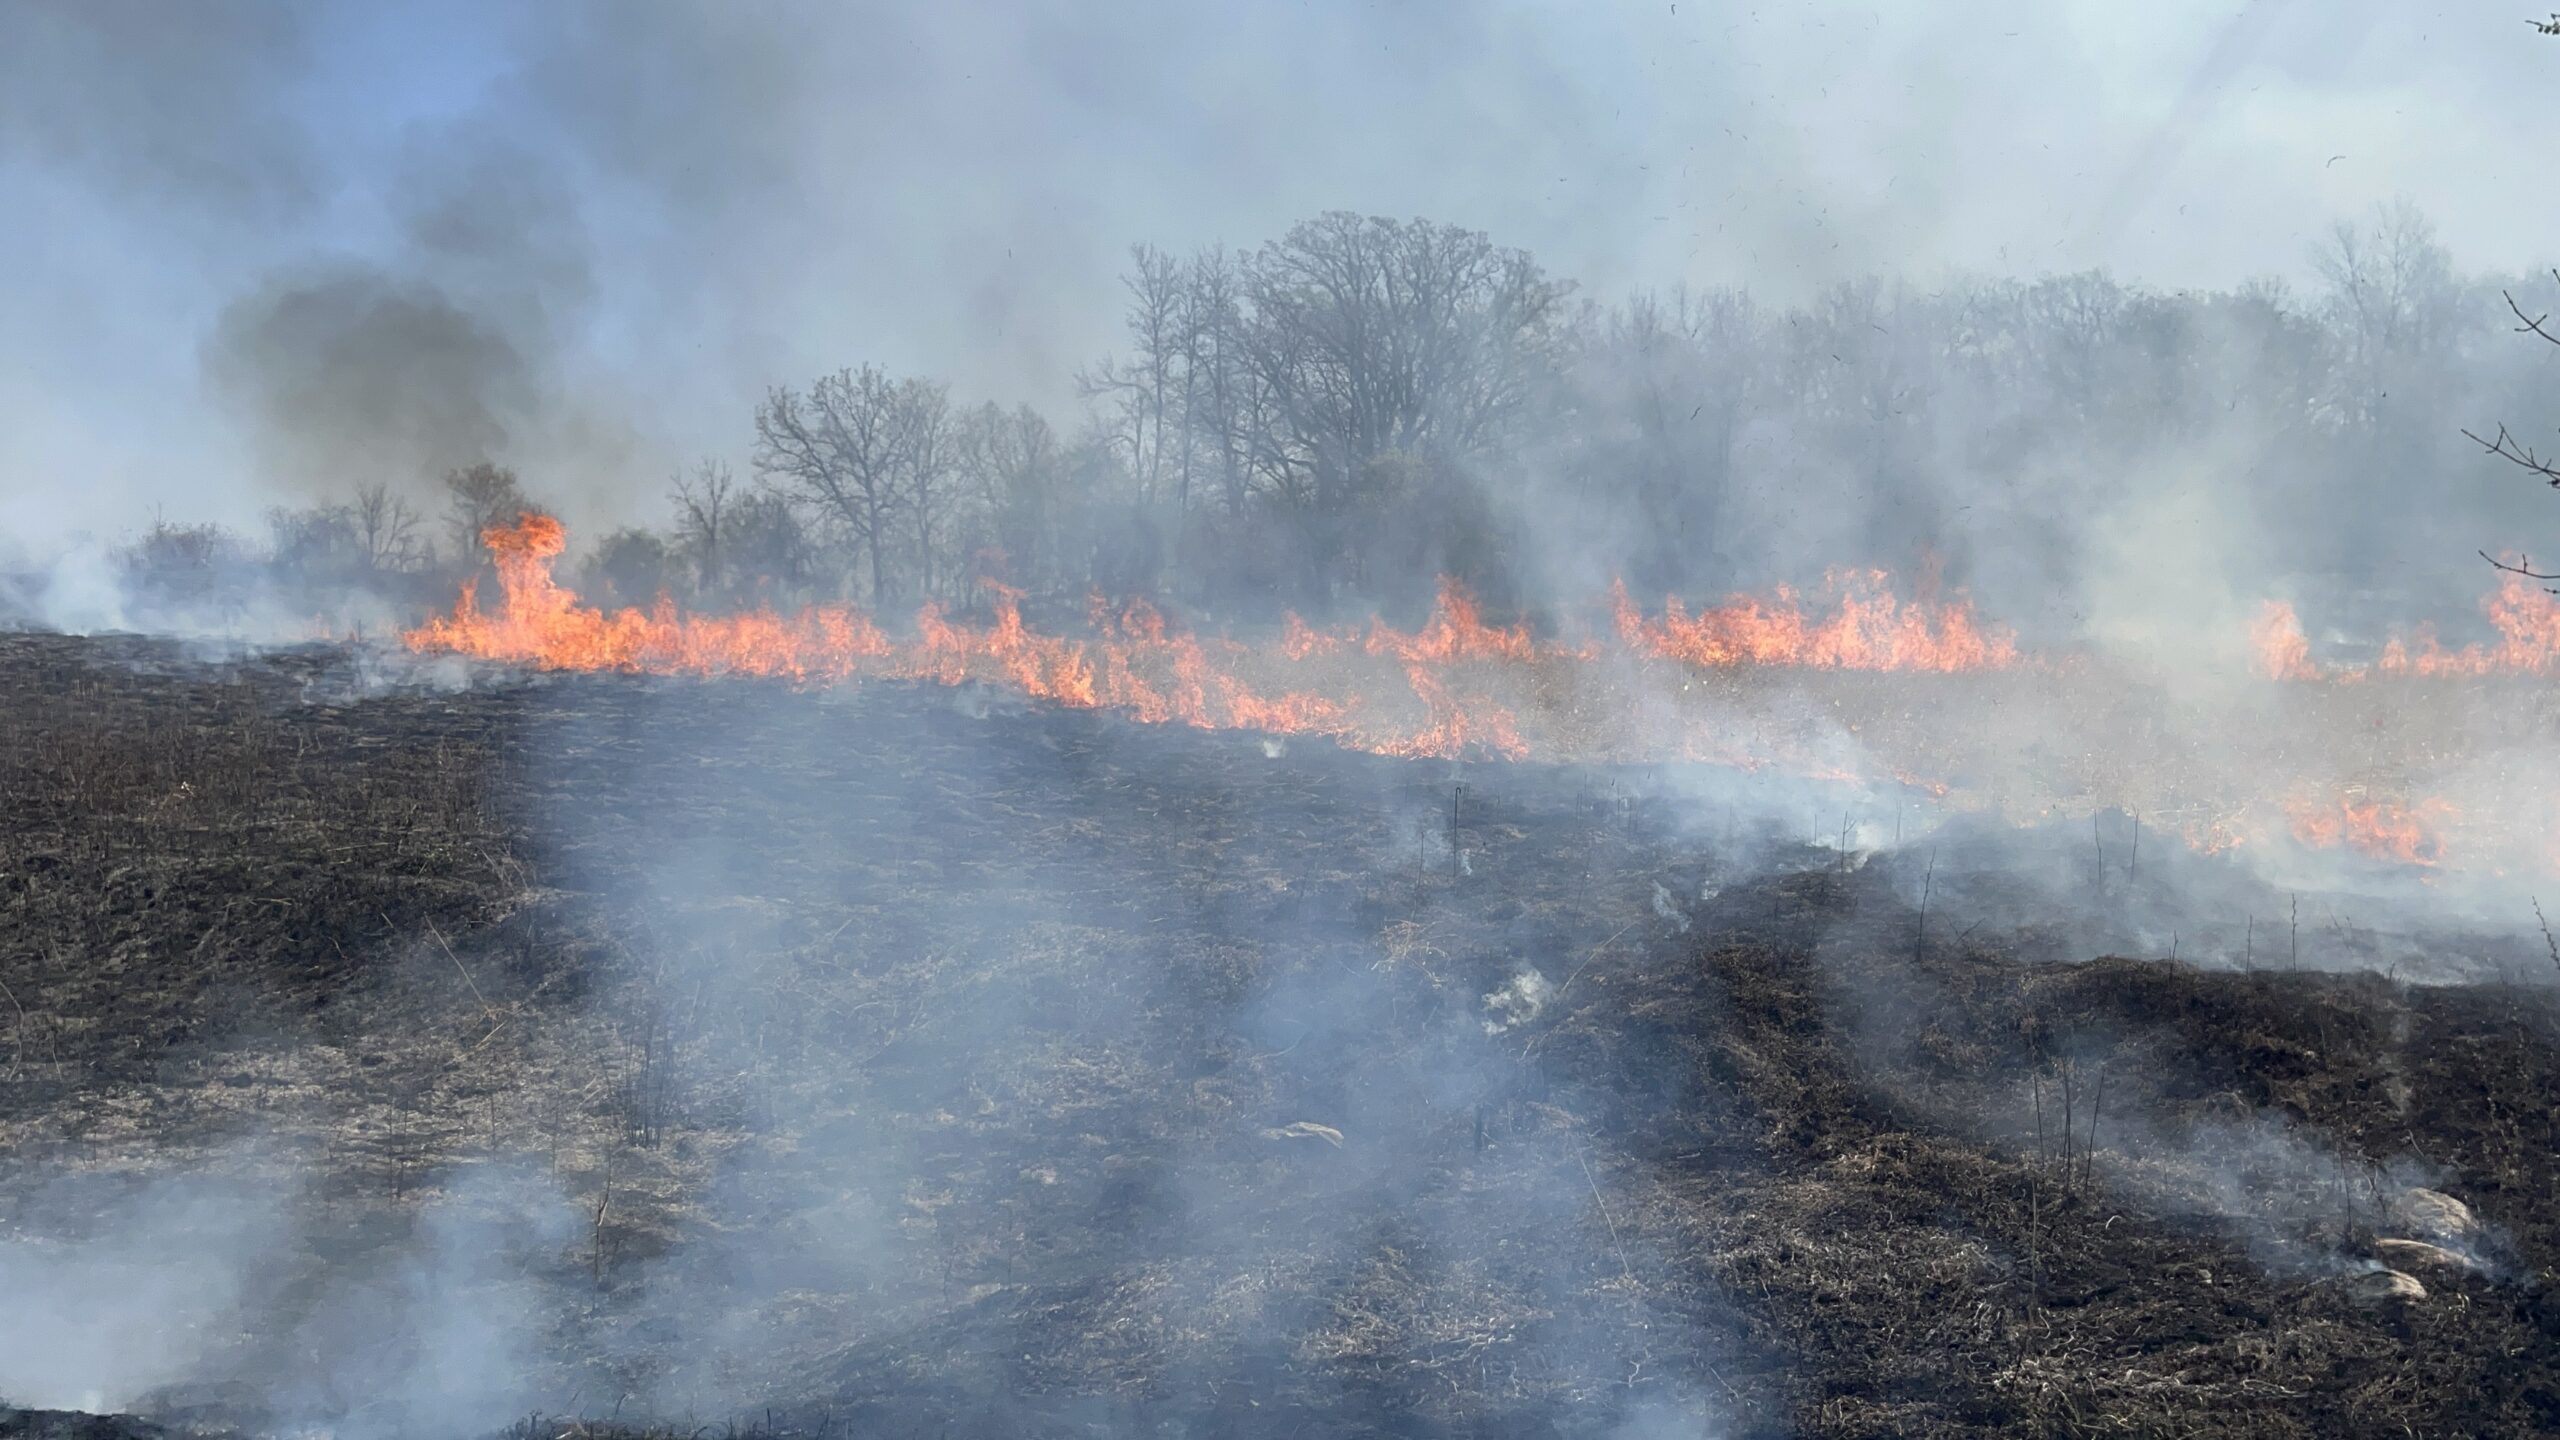
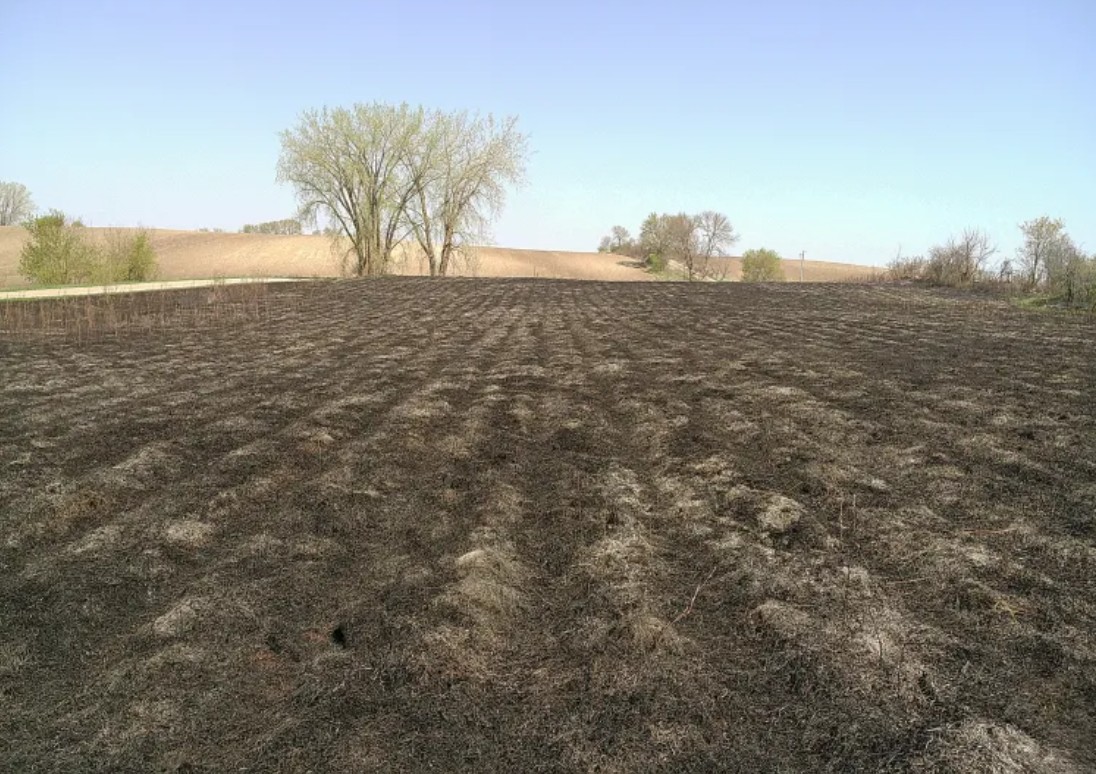
Team Echinacea has successfully completed some spring prescribed burns! Our mighty team of seven (Stuart, Gretel, Jared, Wyatt, Fannie, Brad, and I) took to Minnesota this past week to conduct a handful of spring prescribed burns. We set off bright and early on Sunday morning at around 9am to make the 9 hour drive from Chicago Botanic Garden to our study sites in Minnesota. Weather in Minnesota on Monday and Tuesday allowed us to get multiple different sites done including the coveted P1 and P8 experimental plots. The sun was shining, the sky was clear, humidity was low, the wind was blowing just enough, and the grass was very dry making it a perfect day. The days were long and the temperatures were high (in the 80’s), but we polished off both days with some great food and great conversations which are essential to any good burn trip to keep up morale.
Experimental plot p1 during the burn (left) and after the burn (right)
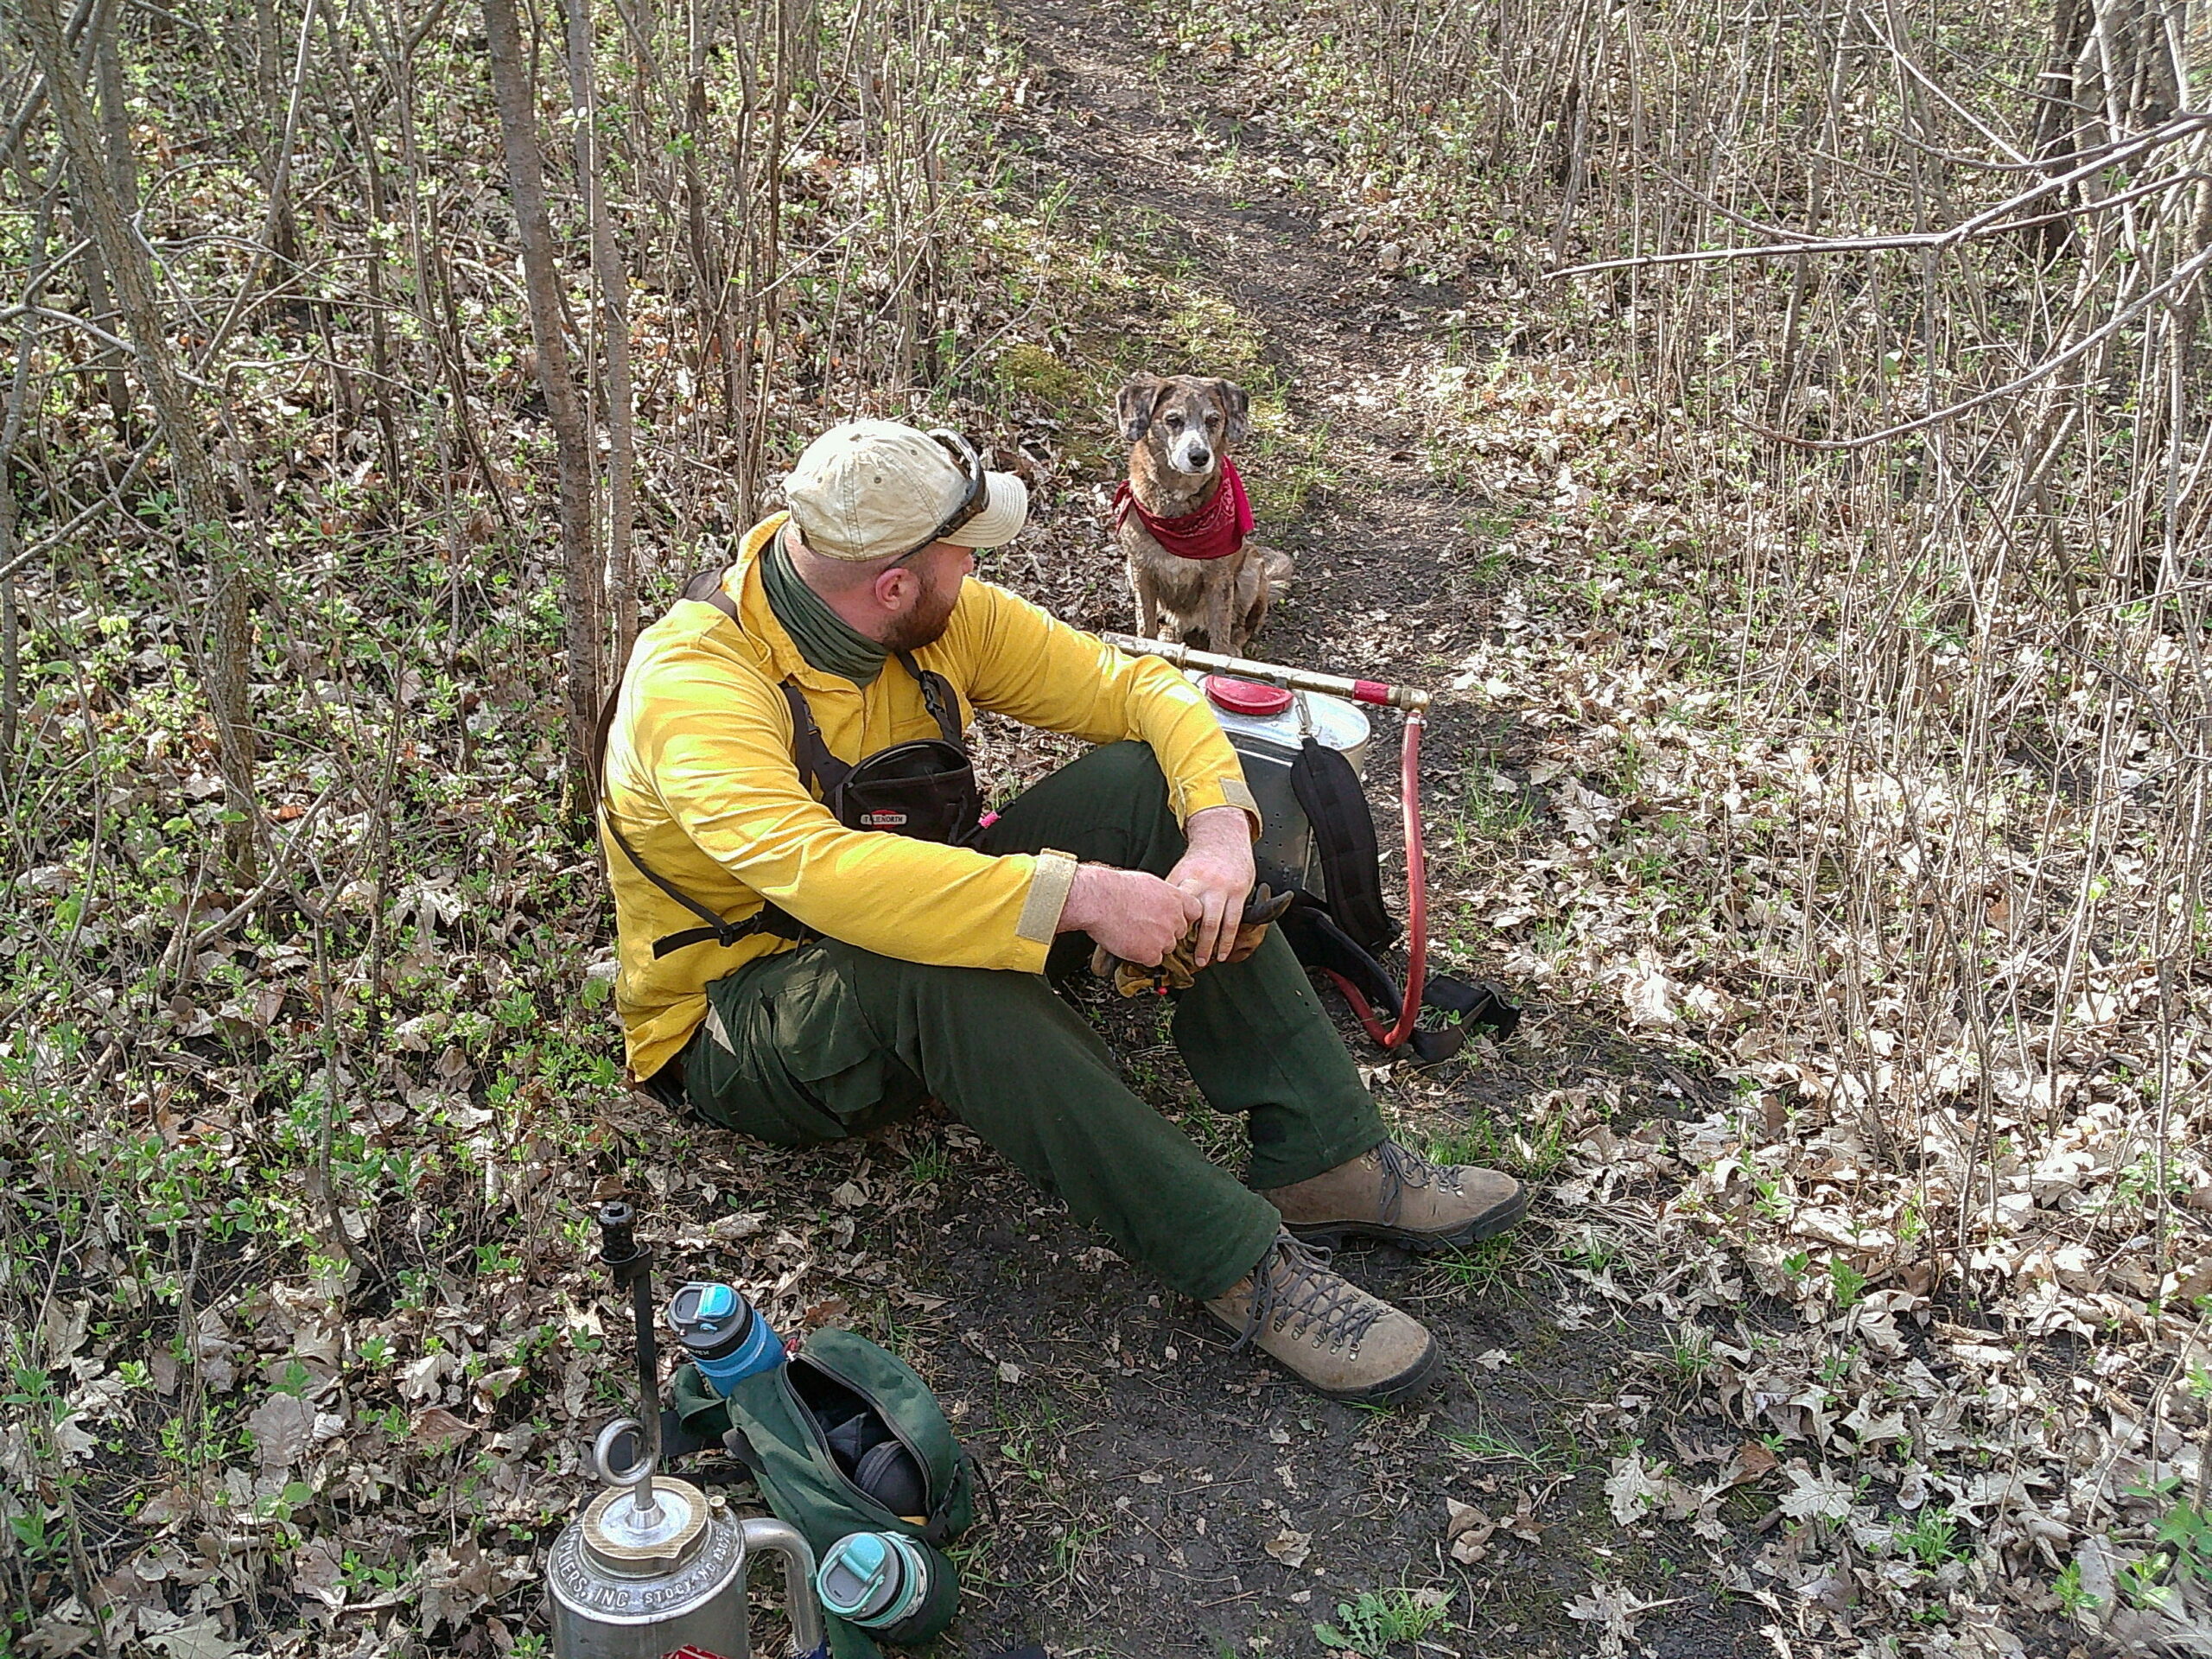
Fannie using the drip torch for the first time (left) and Jared lecturing Blue on the importance of fire safety (right)
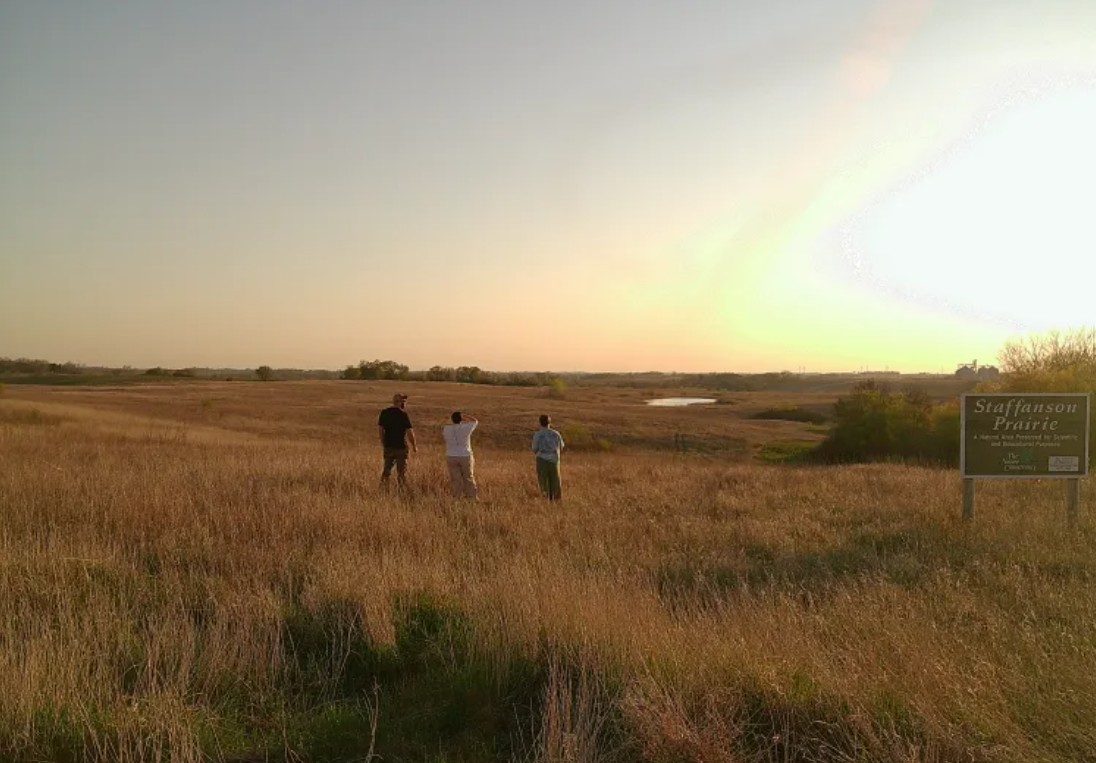
Not only did we get some good burns in, but we were able to visit Runestone County Park on Tuesday morning. We used this trip to see the current restoration work being done at the park, and it allowed us to find spots for potential signs discussing different topics such as why prescribed fire matters, the history of prairies, and more. We also used our time in MN to get many pictures and videos to be used for dissemination projects discussing why prescribed fire is important for native pollinators.
Of course it wouldn’t be a complete trip to Minnesota without a stop at Staffanson Prairie Preserve.
This is part of our project “How Do Prescribed Fires Affect Native Prairie Bees?”
Funding for this project was provided by the Minnesota Environment and Natural Resources Trust Fund as recommended by the Legislative-Citizen Commission on Minnesota Resources (LCCMR).
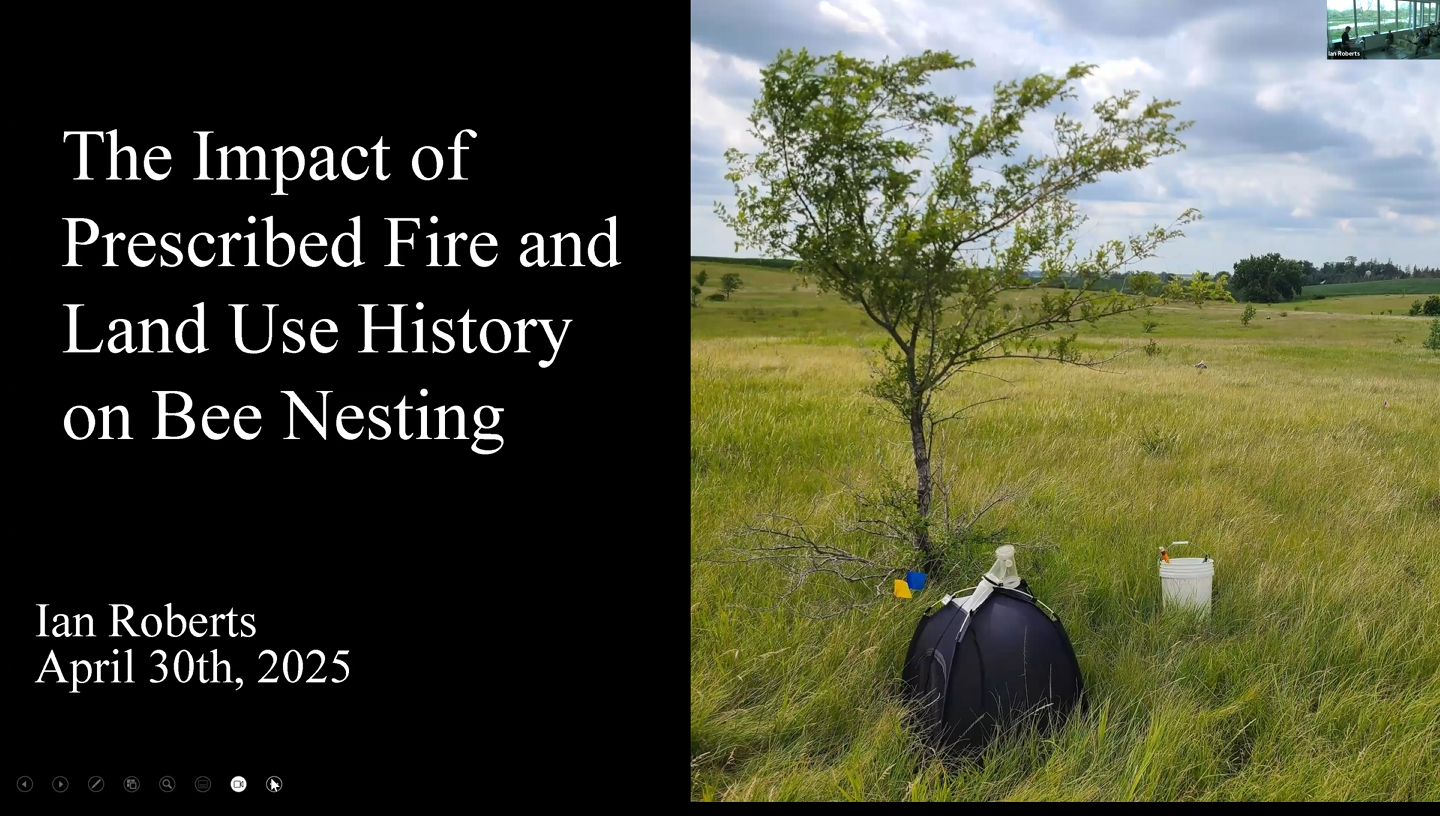
Ian Roberts presented his thesis research “Impacts of Prescribed Fire and Land Use History on Ground Nesting Bees” at the Chicago Botanic Garden on April 30th. The presentation was well received by those attendees in the room and those who attended via zoom. After the public presentation, Ian successfully defend his Masters thesis for the program in Plant Biology and Conservation at NU. Congratulations, Ian!
Ian’s research advances our understanding of ground nesting bees, prescribed fires, and nesting habitat for bees in remnant and restored tallgrass prairie. Stay tuned for a publication and recommendations for land managers!
This is part of our project “How Do Prescribed Fires Affect Native Prairie Bees?”
Funding for this project was provided by the Minnesota Environment and Natural Resources Trust Fund as recommended by the Legislative-Citizen Commission on Minnesota Resources (LCCMR).
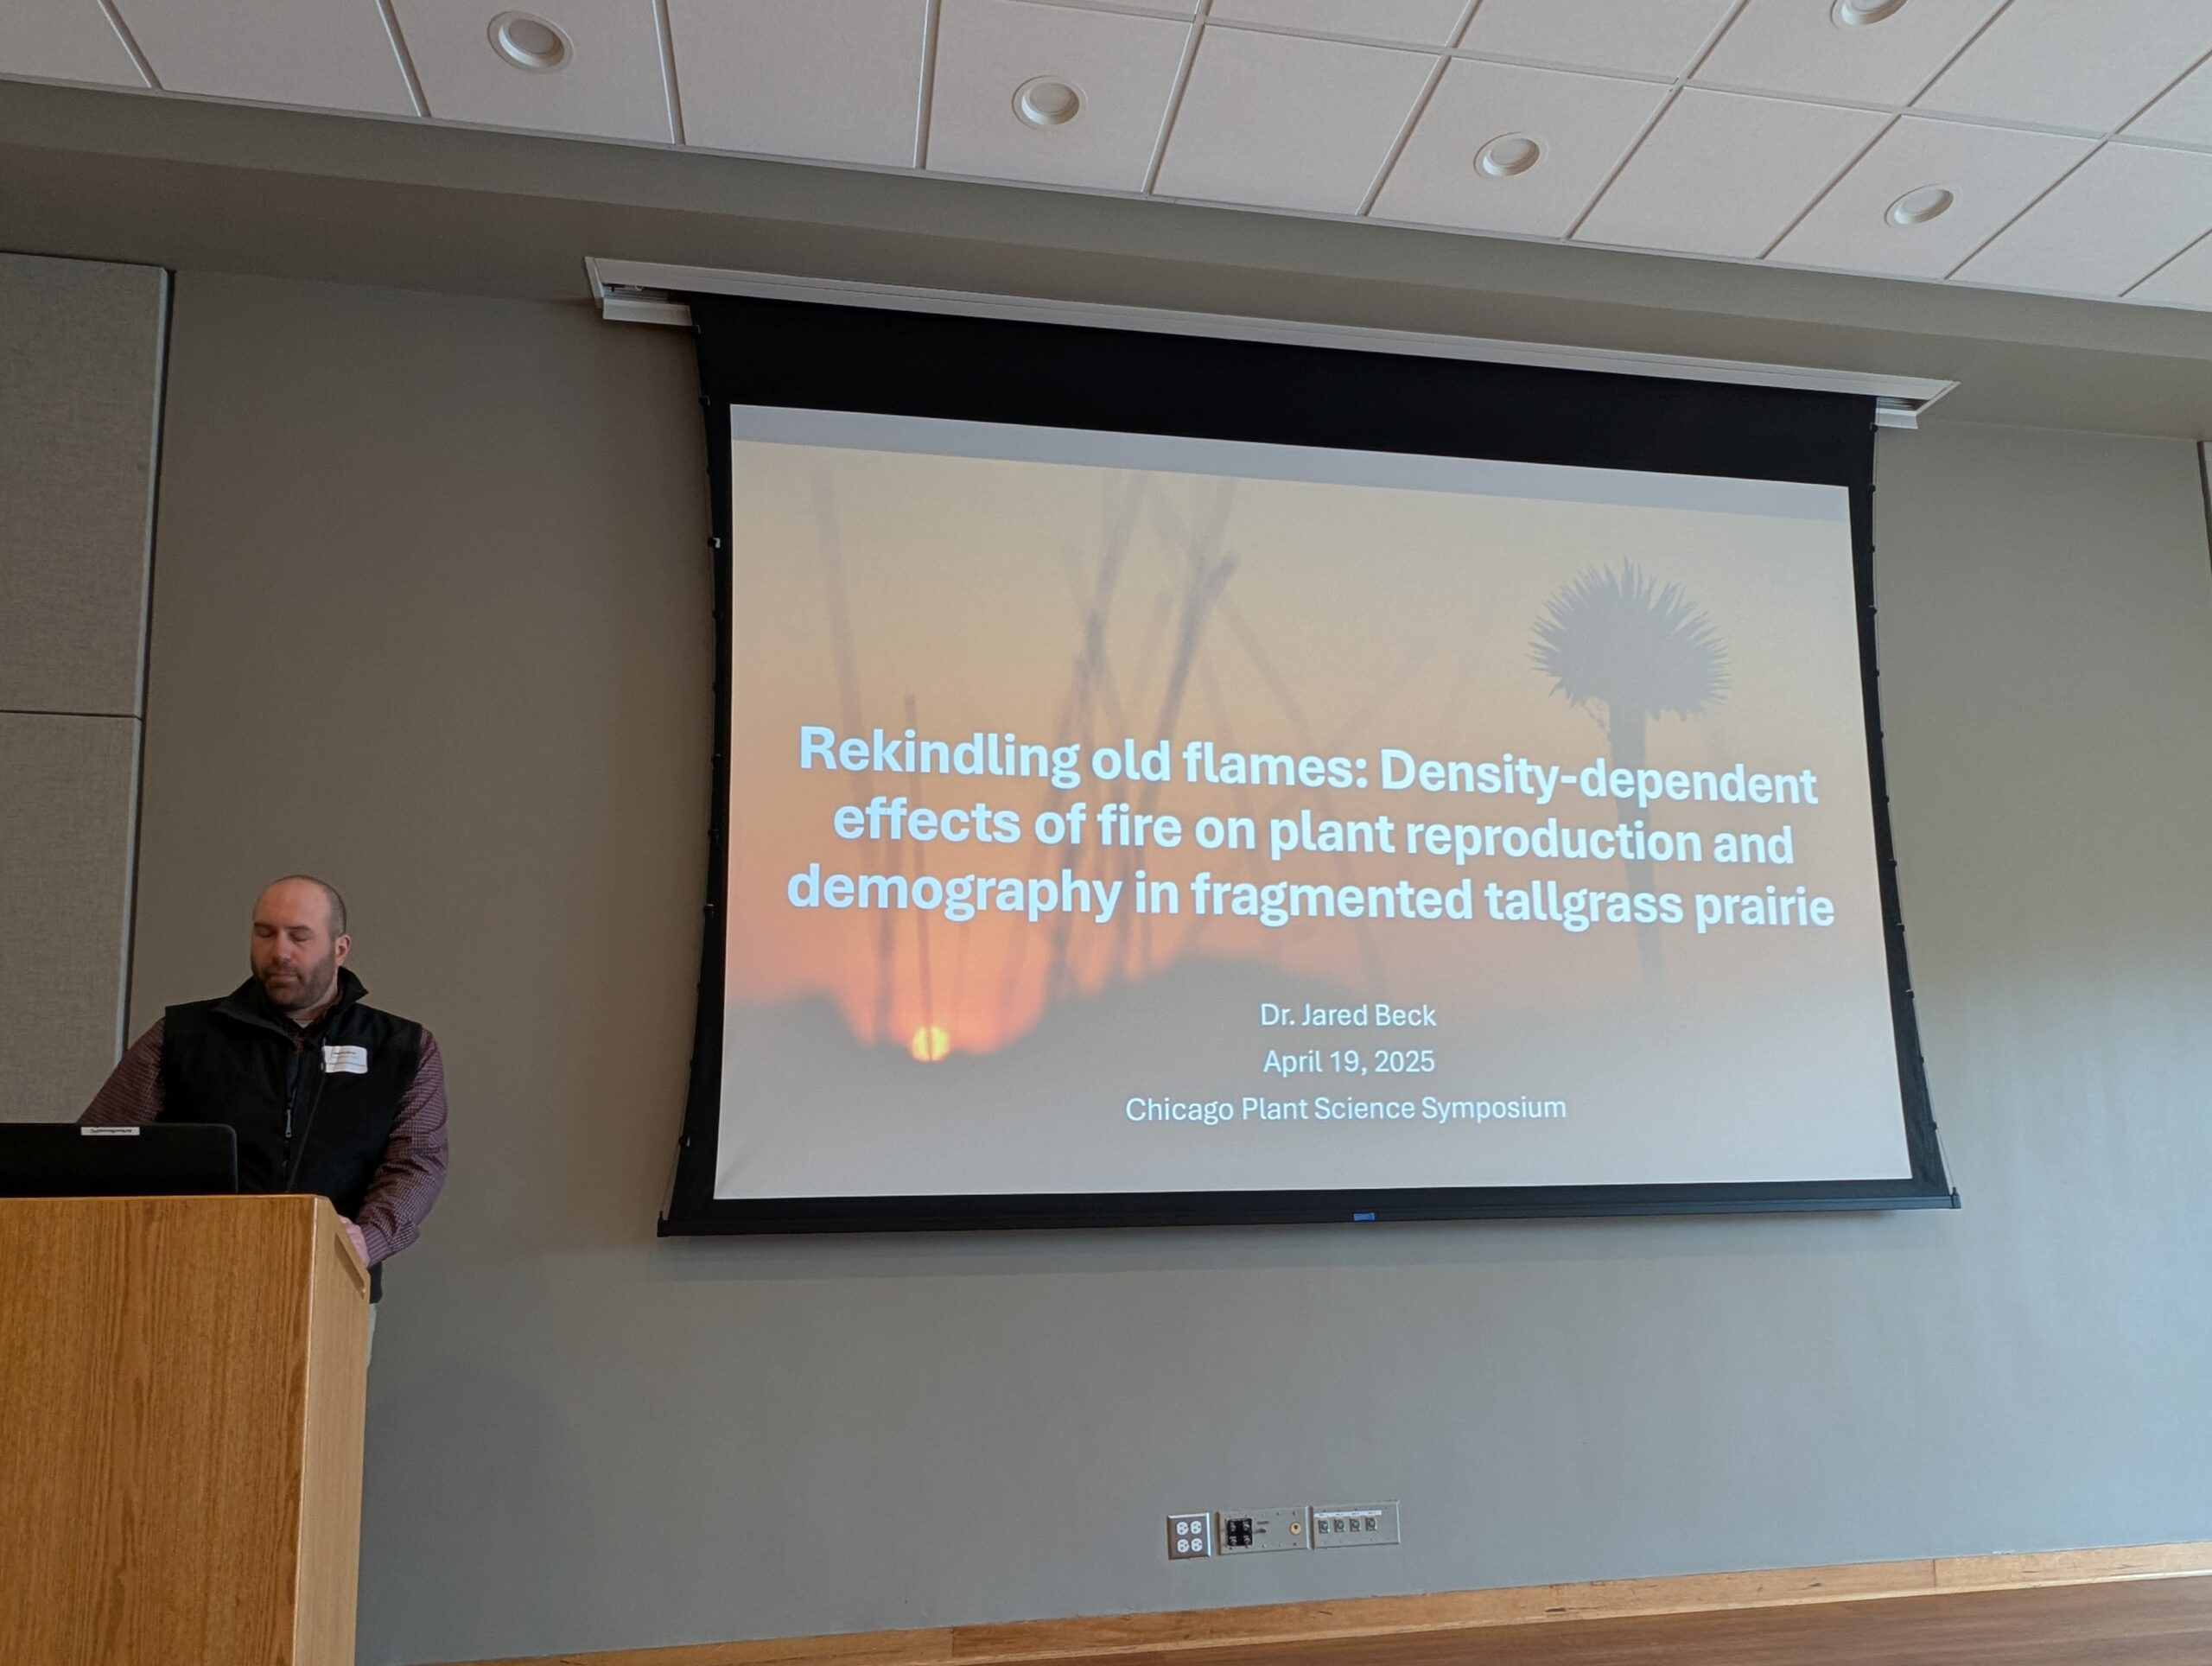
Jared gave a presentation at the Chicago Plant Science Symposium on April 19th about our big prescribed fire experiment. He focused this talk on fire effects on plant reproduction & demography.
This is part of our project “How Do Prescribed Fires Affect Native Prairie Bees?”
Funding for this project was provided by the Minnesota Environment and Natural Resources Trust Fund as recommended by the Legislative-Citizen Commission on Minnesota Resources (LCCMR).
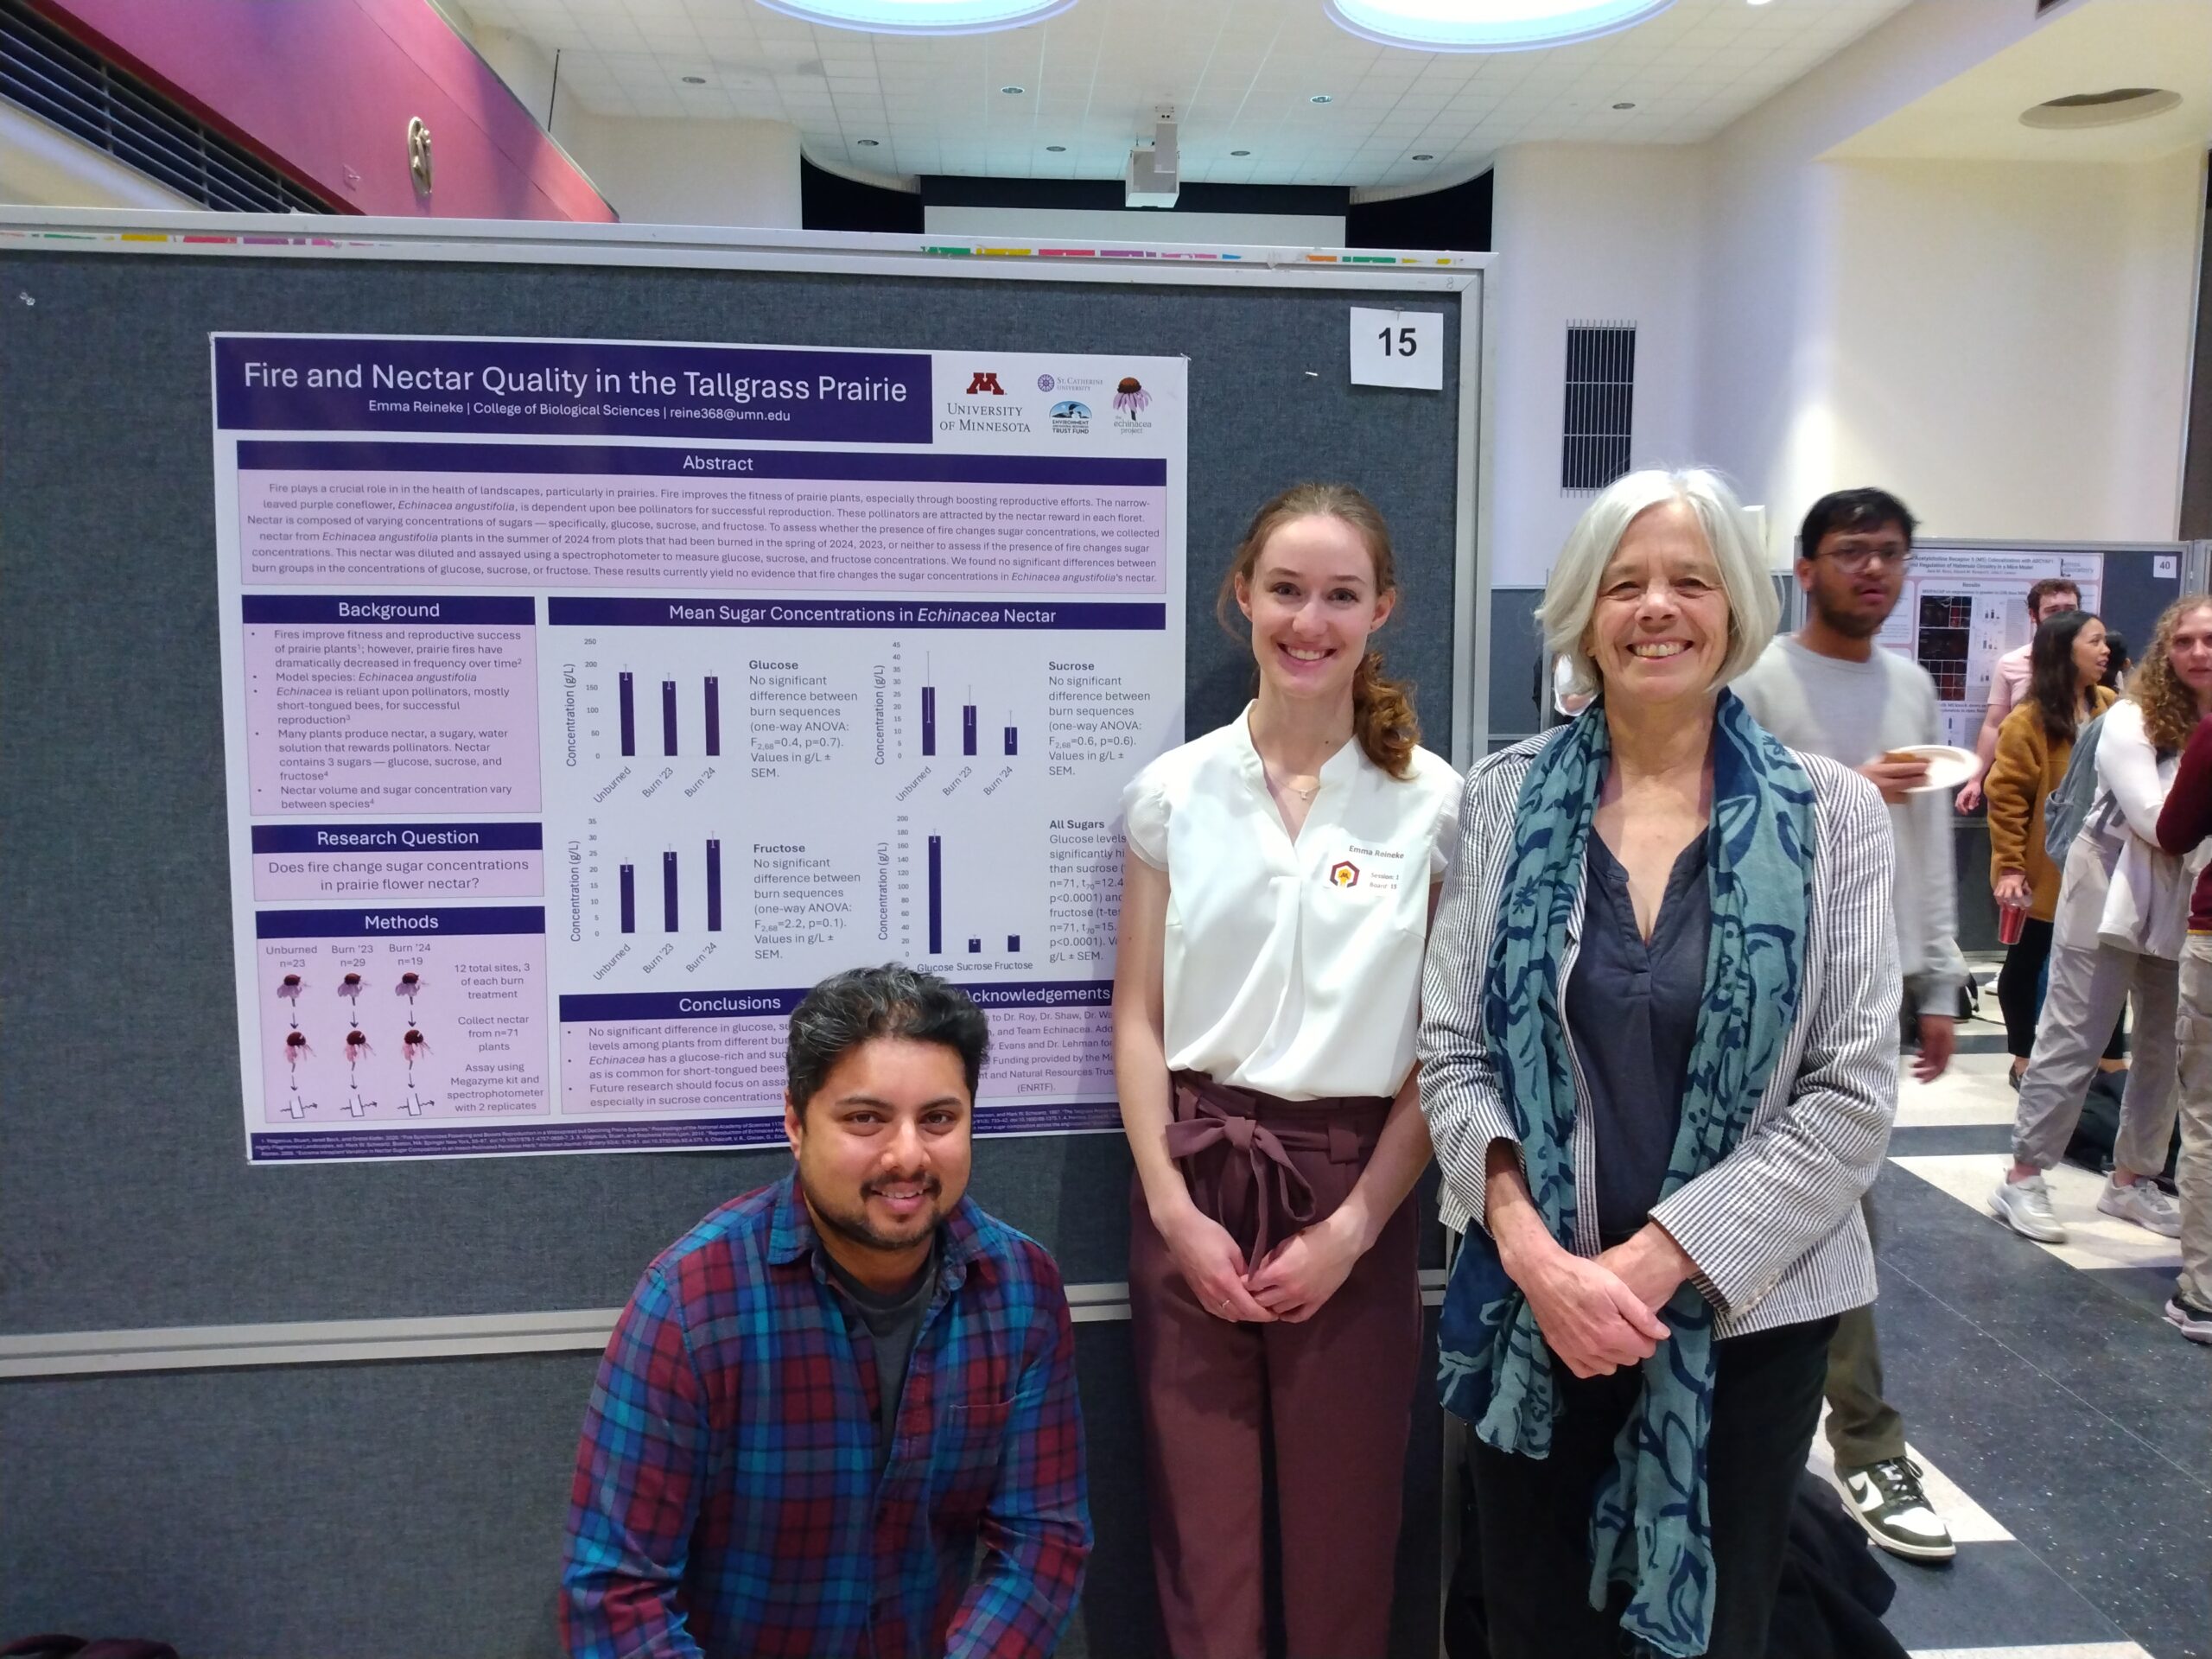
Emma presented results of her honor’s project at the poster symposium on April 15th at the U of MN. Emma assessed concentrations of several types of sugar in nectar collected from tiny florets of Echinacea plants. We are learning how prescribed fire affects sugars in nectar because nectar is an important food for pollinators, like bees. Emma worked in the lab of Dr. Rahul Roi at St Catherine University and was advised by Dr. Ruth Shaw at University of Minnesota. We are so proud of Emma!
Emma presenting her poster with Rahul & Ruth.
This is part of our project “How Do Prescribed Fires Affect Native Prairie Bees?”
Funding for this project was provided by the Minnesota Environment and Natural Resources Trust Fund as recommended by the Legislative-Citizen Commission on Minnesota Resources (LCCMR).
We’re interested in investigating what resources are available to Echinacea visitors and learning more about the pollen and nectar Echinacea produces. We hope to learn if the nutritional resources available differ before and after burns. In 2022, Britney House developed methods for collecting nectar from Echinacea using microcapillary tubes. Read more about her methods here.
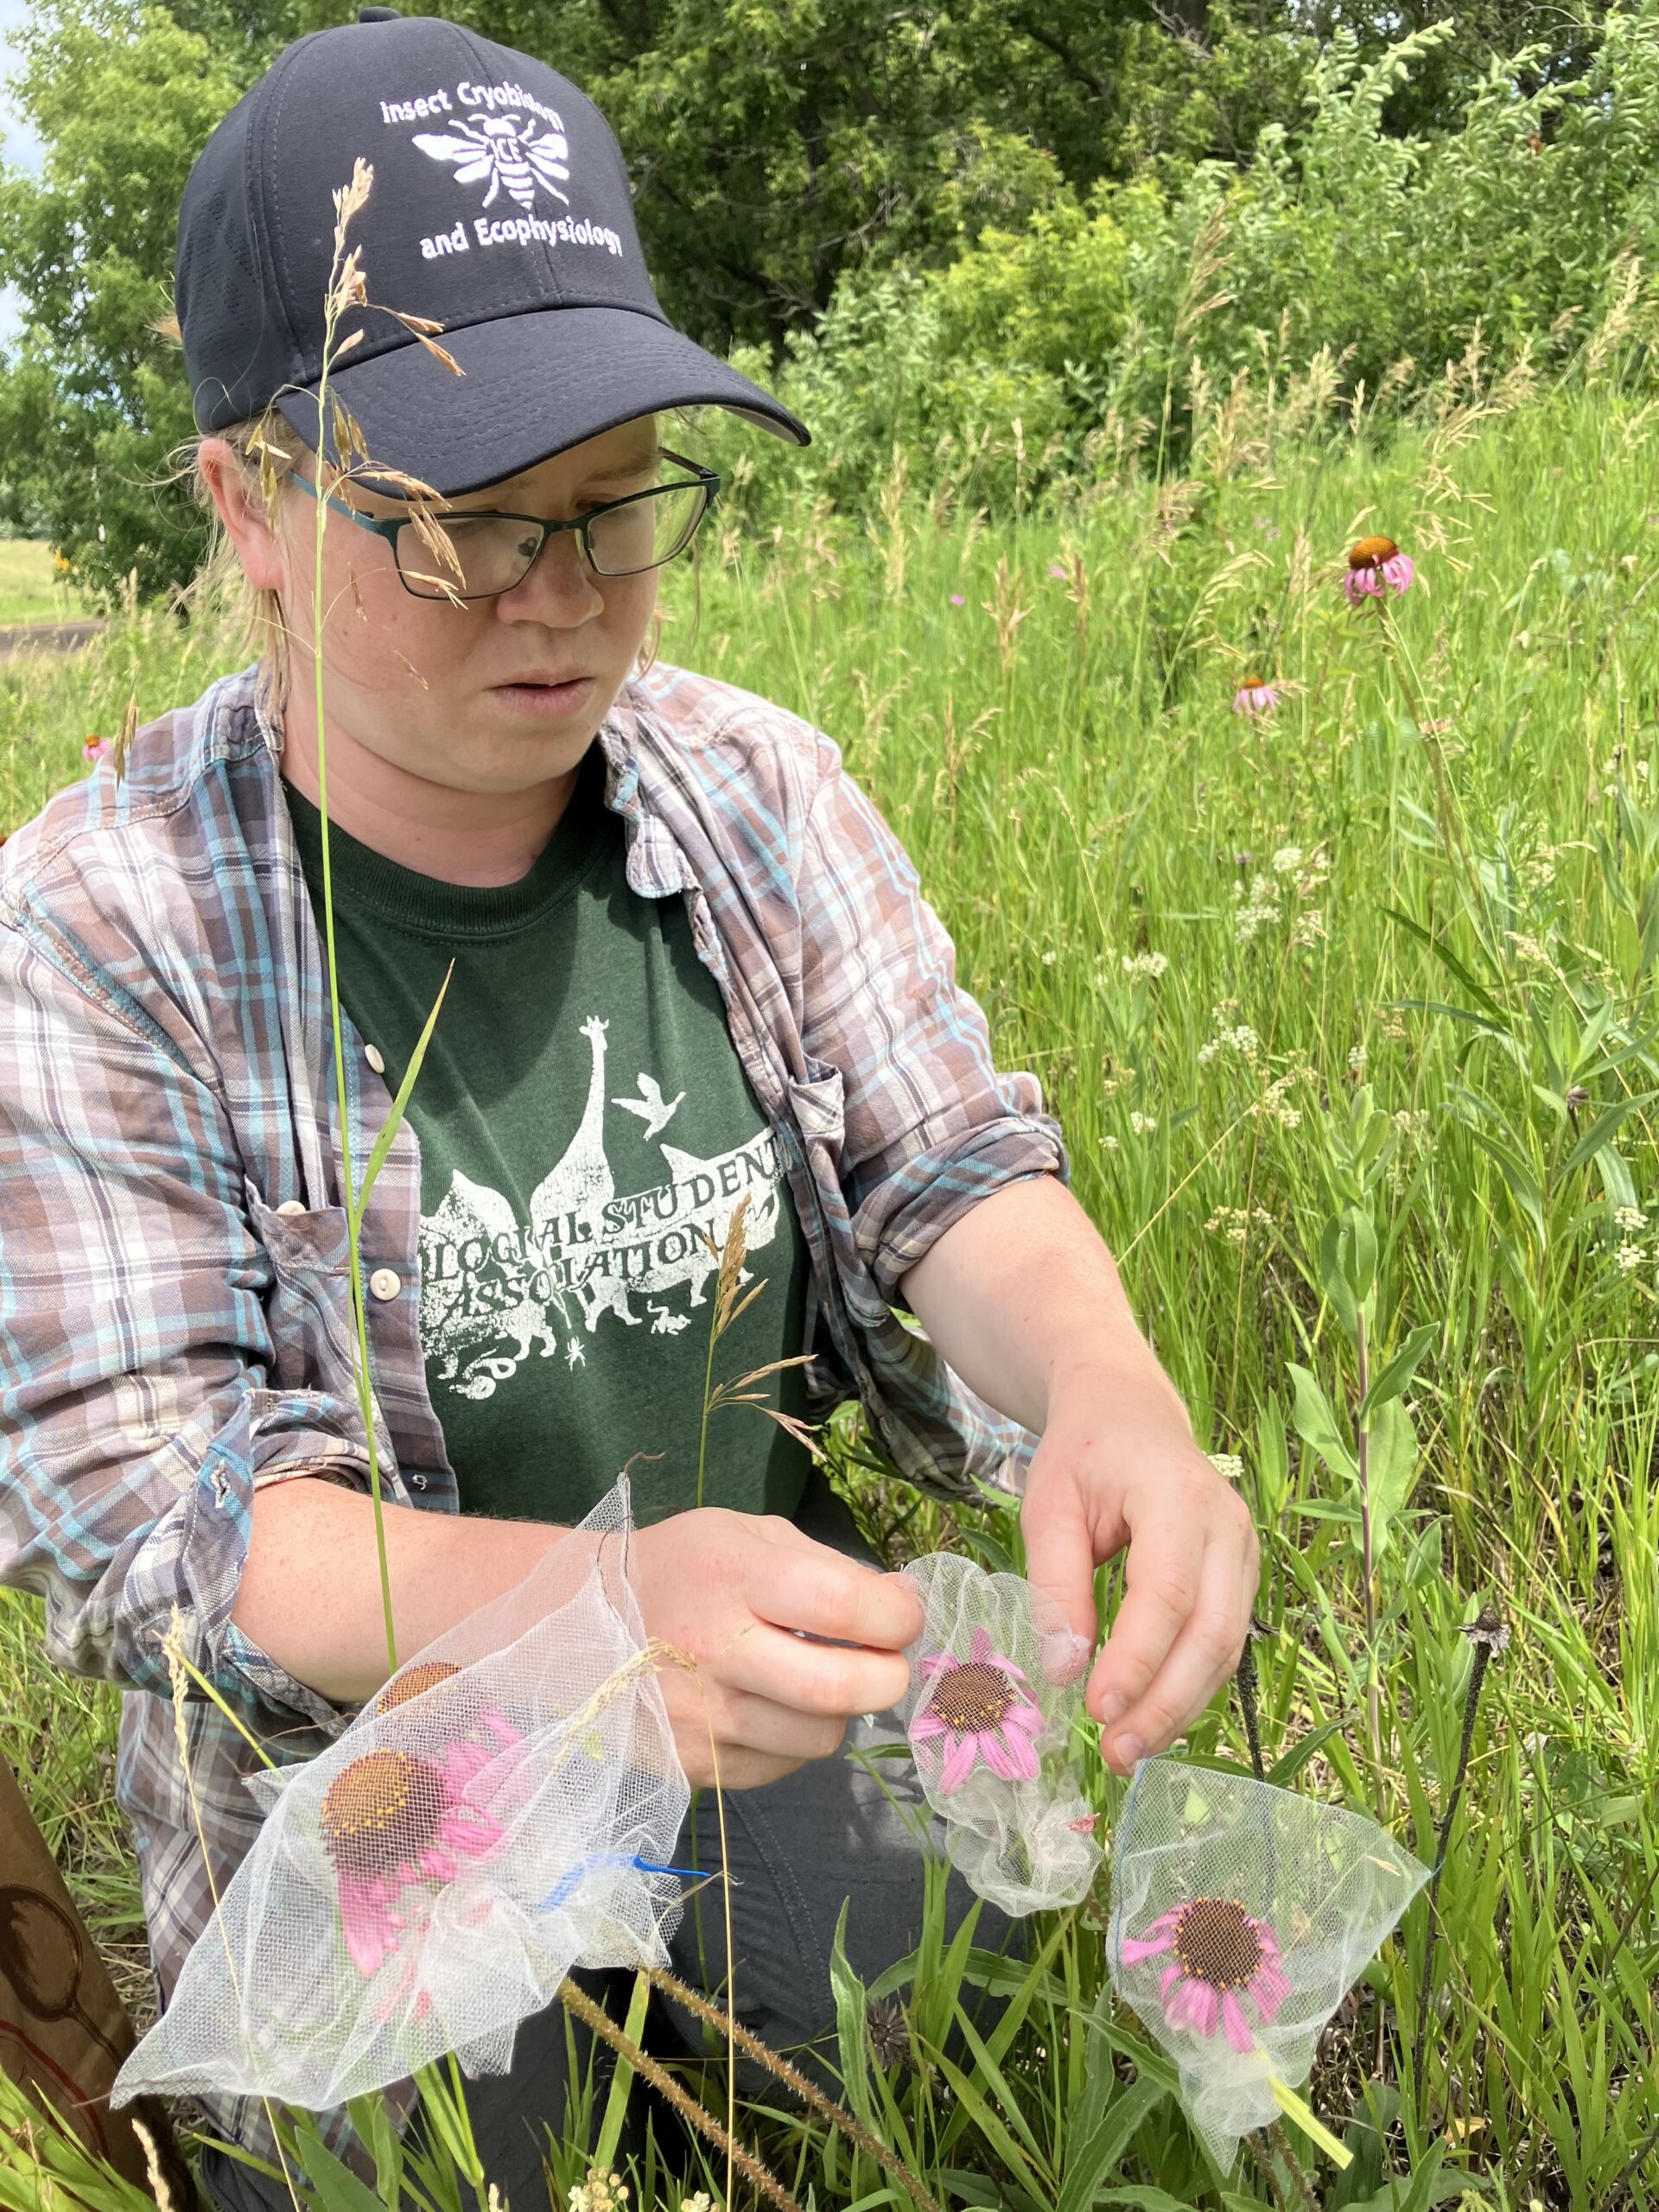
During the summer of 2024, the team collected pollen and nectar samples from Echinacea angustifolia at 12 sites in and around Solem Township, MN. We searched for and shot the ~10 plants (or, if few were available, as many as we could find) at each site that were closest to a random point. We then bagged up to five of the heads with pollinator exclusion bags for those 10 plants. Throughout the duration of their flowering, we collected pollen from all bagged plants and nectar from five of them per site.
We removed bags from pollen/nectar plants and backup plants when they were done flowering, and we collected until a a limit was set of a cumulative 10mm of nectar from each plant. This year we also collected immature florets from each bagged head at the start of sampling.
Following some experimentation, we conducted nectar collection only in the afternoons, while pollen collection could be done any time of day. In total, we collected vials of pollen, nectar, and vials containing immature florets from 60 plants. Pollen and nectar tubes were given to Rahul Roy at St. Catherine University in St. Paul, who will be doing pollen and nectar analysis. Tubes containing immature florets were sent with Grace Hirzel at North Dakota State University in Fargo, ND for pollen grain count and size analysis.
Data entry for collection datasheets is ongoing. Pollen data entry is started and nectar data is a little over half done with the help of Emma Reineke. Emma will also be using part of this dataset for her senior thesis project at the University of Minnesota.
Scans can be found at: Dropbox/teamEchinacea2024/z.pollenNectarDataEntry/scans.
Start year: 2024
Location: Various prairie remnants around Solem Township, MN
Team members involved with this project: Summer team 2024, Rahul Roy (St. Kate’s), Emma Reineke (University of Minnesota), Jarrad Pasifrika and Grace Hirzel (North Dakota State University)
Products: pending
Funding: ENRTF
Grace Hirzel taking off a pollen excluder bag on an Echinacea angustifolia plant.
During the summer of 2024, Team Echinacea completed the second year of its ENRTF funded project to better understand how prescribed fire influences ground nesting bee habitat, food resources, and diversity. Understanding the associations between land management methods and ground nesting bees is essential for providing reccomendations to policymakers and practitioners interested in native bee conservation.
We surveyed solitary bee diversity and nesting habitat before and after prescribed fires in a subset of 30 prairie remnants and 15 prairie restorations to determine how prescribed fire affects solitary bee nesting habitat and abundance. We used emergence traps to sample the community of solitary ground nesting bees. This was complemented by detailed measures of soil and litter to characterize how prescribed burning influences the nesting habitat (read more here).
2024 REU student Zach Zarling deploys an emergence trap at a site near Hoffman, Minnesota
We deployed emergence traps at our random “burn and bee points”(BBPTs) in prairie remnants and restorations from early June to mid September. Our deployments spanned three rotations (4-6) of BBPTs and we put out a total of ~1,159 emergence traps. On reccomendation from Dr. Alex Harmon-Threatt, we also performed 10 minute “pollard walks” on deployment to estimate the number of foraging bees at each site. These foraging numbers will be compared to nesting incidence as part of Ian Roberts’ thesis project.
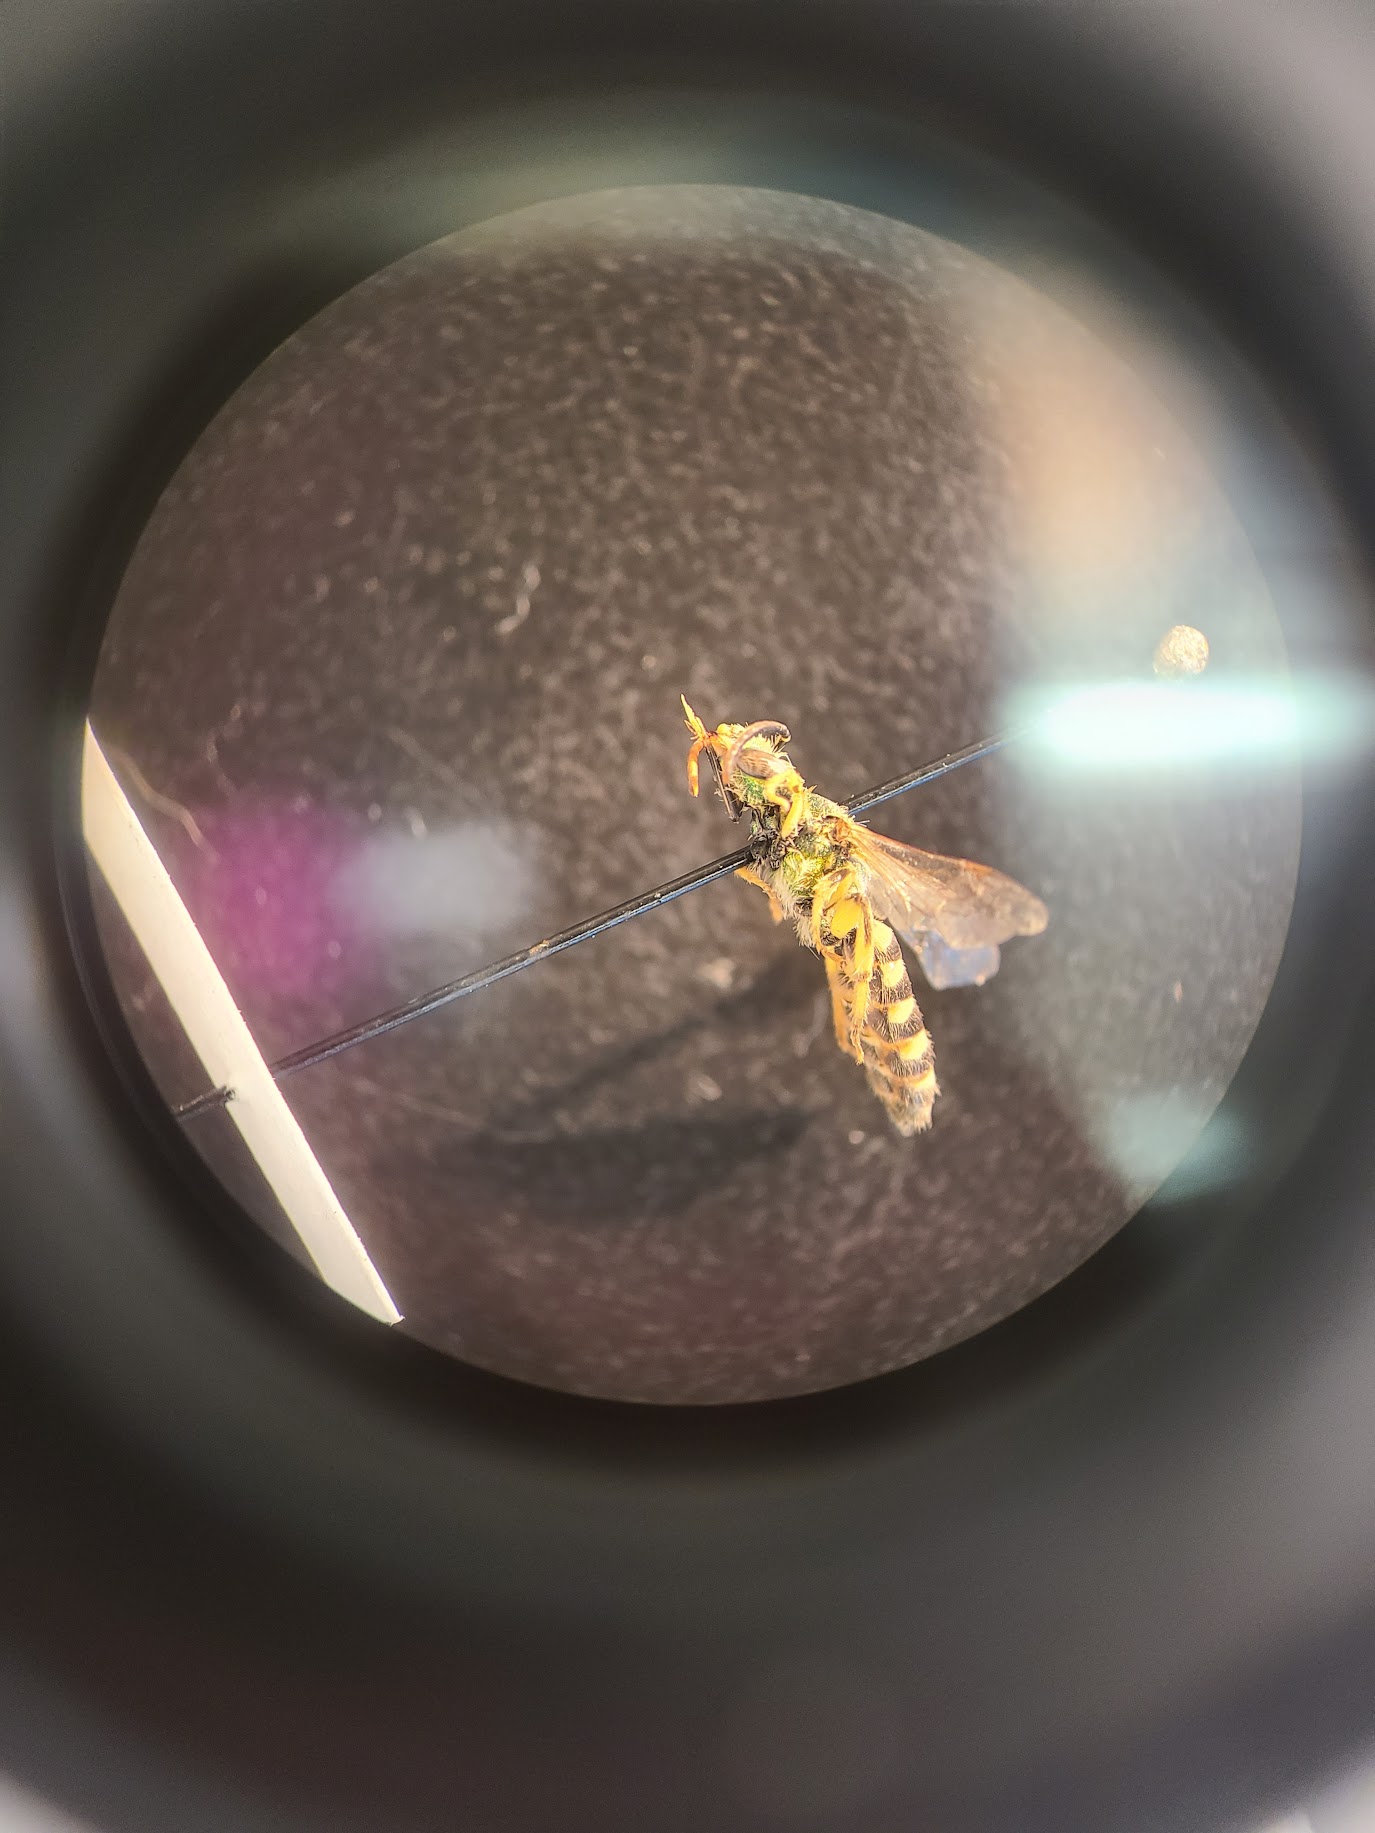
As of December 21st, specimens caught in this year’s deployments have been pinned, labeled, and transported from Chicago Botanic Garden to the University of Minnesota, where Zach Portman, a bee taxonomist, will identify them. Team Echinacea also collected lots of non-bee bycatch while processing specimens collected in the traps: including millipedes, flies, and even a prairie skink! To avoid wasting these specimens, we plan to categorize this bycatch into broad taxonomic groups (like Dipterans, Orthopterans, etc) and examine potential associations between our experimental treatments and general arthropod diversity across our study sites.
Pinned specimen from 2024’s emergence trapping, likely an Agapostemon virescens.
While working on pinning and processing specimens, Ian Roberts produced a poster containing analyses from the 2023 emergence trapping data to present at Entomology 2024. The poster can be viewed here. Future data analyses will feature data from both sampling years, as well as microhabitat measurments and and diversity indices.
Start year: 2023
Location: prairie remnants and restorations in Solem Township, MN.
Data collected: insect samples, counts of foraging bees
Samples or specimens collected: Pinned bees are currently being identified at University of Minnesota. Bycatch is in the freezer at Chicago Botanic Garden.
Products: poster presented at Entomology 2024 (see above for link)
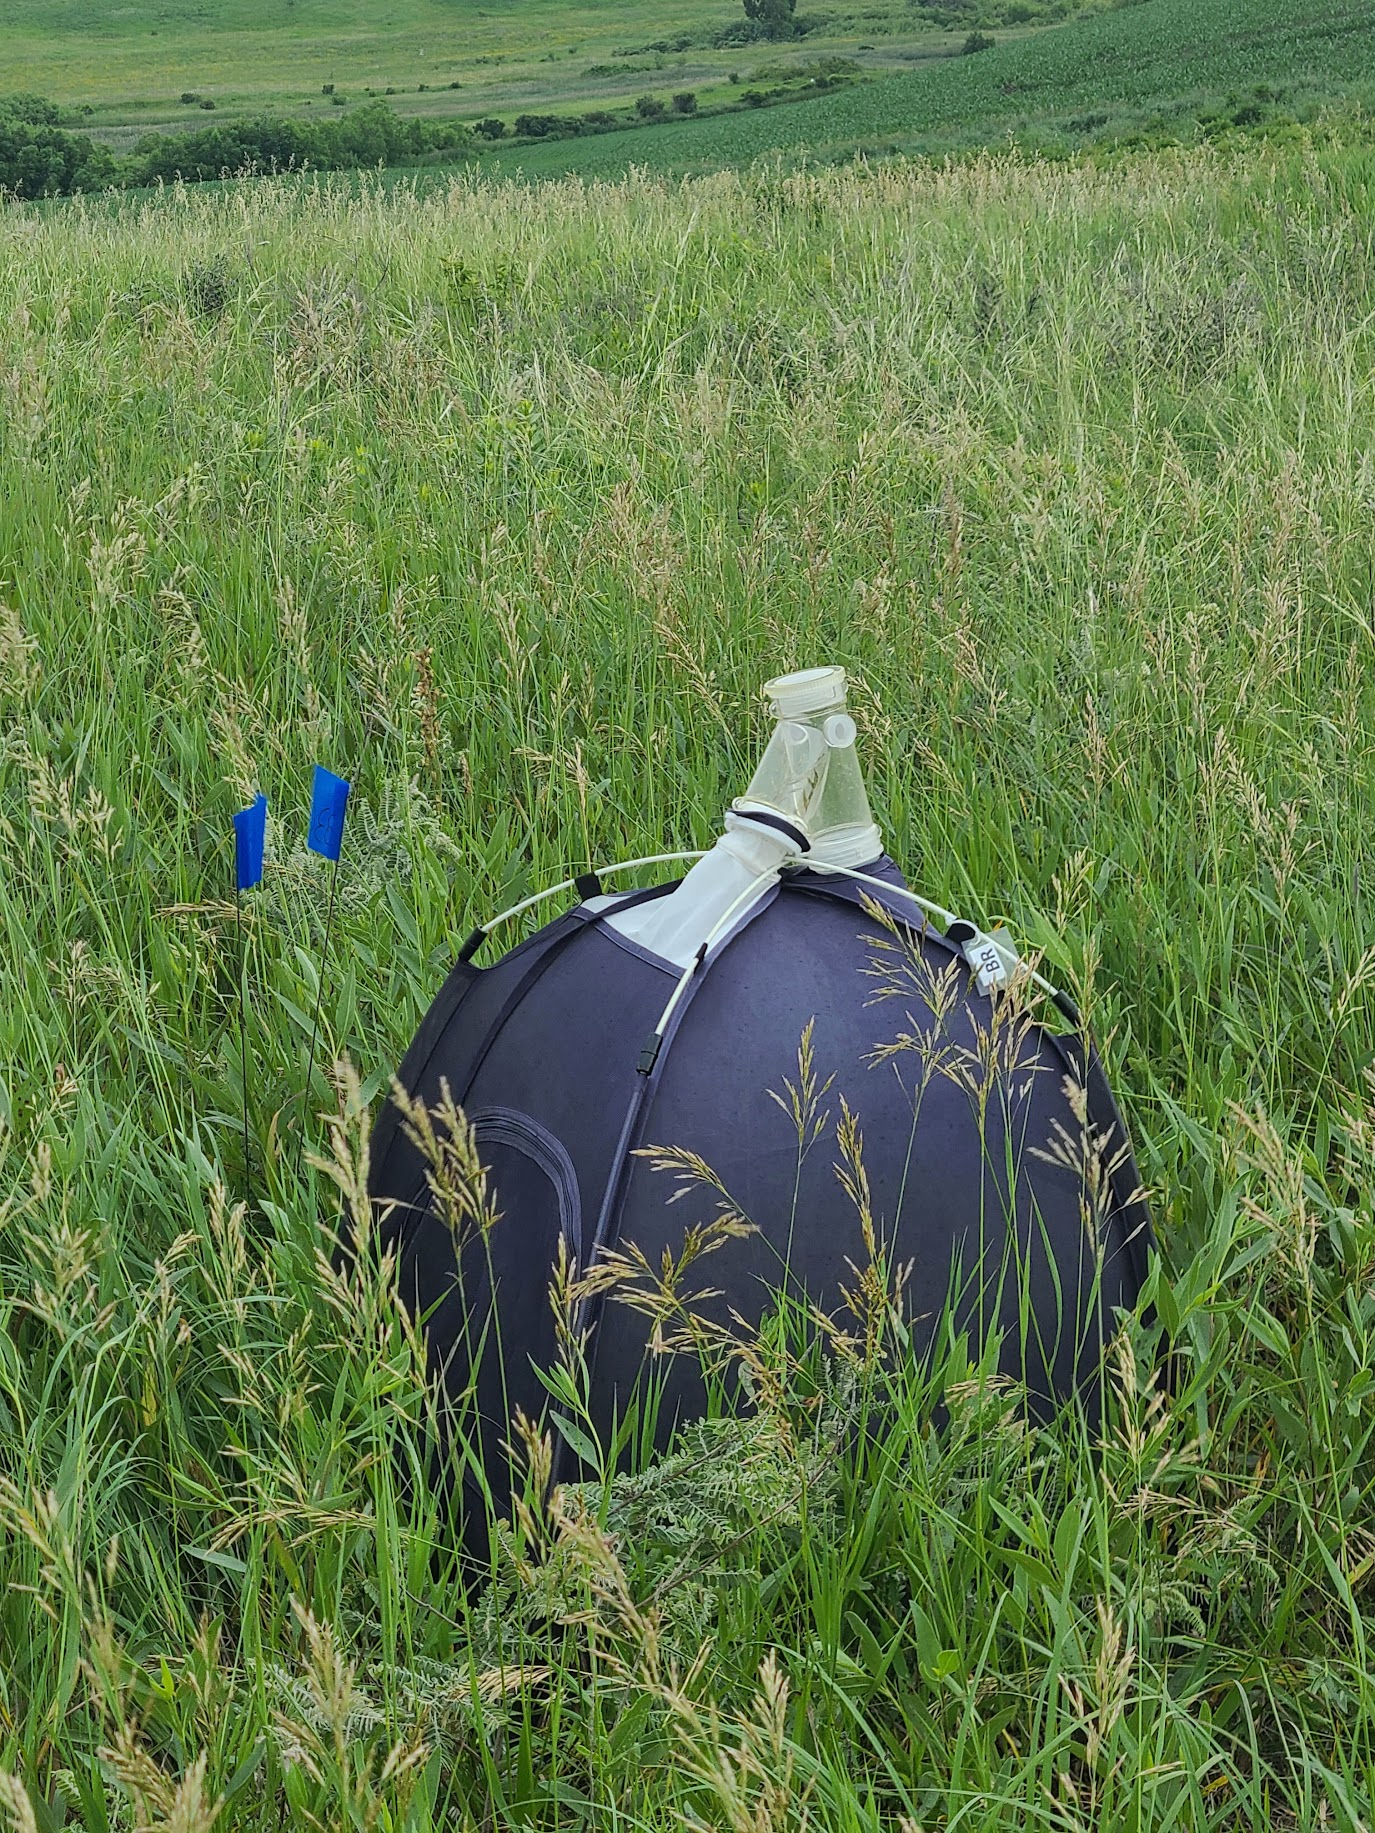
During summer 2024, Team Echinacea continued to collect data on local environmental conditions in order to understand which environmental factors are associated with good habitat for ground-nesting bees. These data complement emergence trapping for our ENRTF funded research on fire’s influence on ground nesting bees habitats. We sampled local environmental conditions near randomly placed “burn and bee points” (BBPTs) in prairie remnants and restorations.
A deployed emergence trap next to a set of marking flags. Microhabitat data was sampled within a meter of these marking flags.
Unlike the 2023 season, we did not collect data on light levels at BBPTs this year. Instead, we measured soil temperature just under the surface using a digital thermometer, along with soil compaction via a penetrometer and litter depth via a meter stick.
Team Echinacea conducted microhabitat assessments for remnant prairies at rotation 4 BBPTs. Over the summer, we took microhabitat assessment measurements at a total of 241 measurments.
Start year: 2024
Location: prairie remnants and restorations in Solem Township, MN