Reproduction in plants can be limited by access to pollen and resources. We previously found that Echinacea plants in the remnants are pollen limited, meaning that if they had access to more pollen, they would produce more seeds. However, the long-term effects of pollen limitation are unknown. Do plants that are super pollen saturated and have high amounts of pollen have a higher lifetime fitness than plants that are pollen limited? Also, we know that the plants in the remnants are pollen limited, but are the plants in the common garden environment also pollen limited? To answer these questions and more, 13 years ago Gretel randomly selected 39 plants from p1; half of these plants were randomly assigned to the pollen addition group, and the others were assigned to pollen exclusion. Every year, plants in the pollen exclusion have their heads bagged and they are not pollinated, while we hand cross every style in the pollen addition group. An additional 53 plants in p1 were selected to be part of a control group where pollen was neither added nor excluded.
In the summer of 2024, NONE of the original 39 addition/exclusion plants were flowering. If any had been flowering, the exclusion treatment plants would be covered with exclusion bags to prevent pollination, and the addition plants would be hand-pollinated multiple times throughout the summer. One plant in the control group produced a single flowering head.
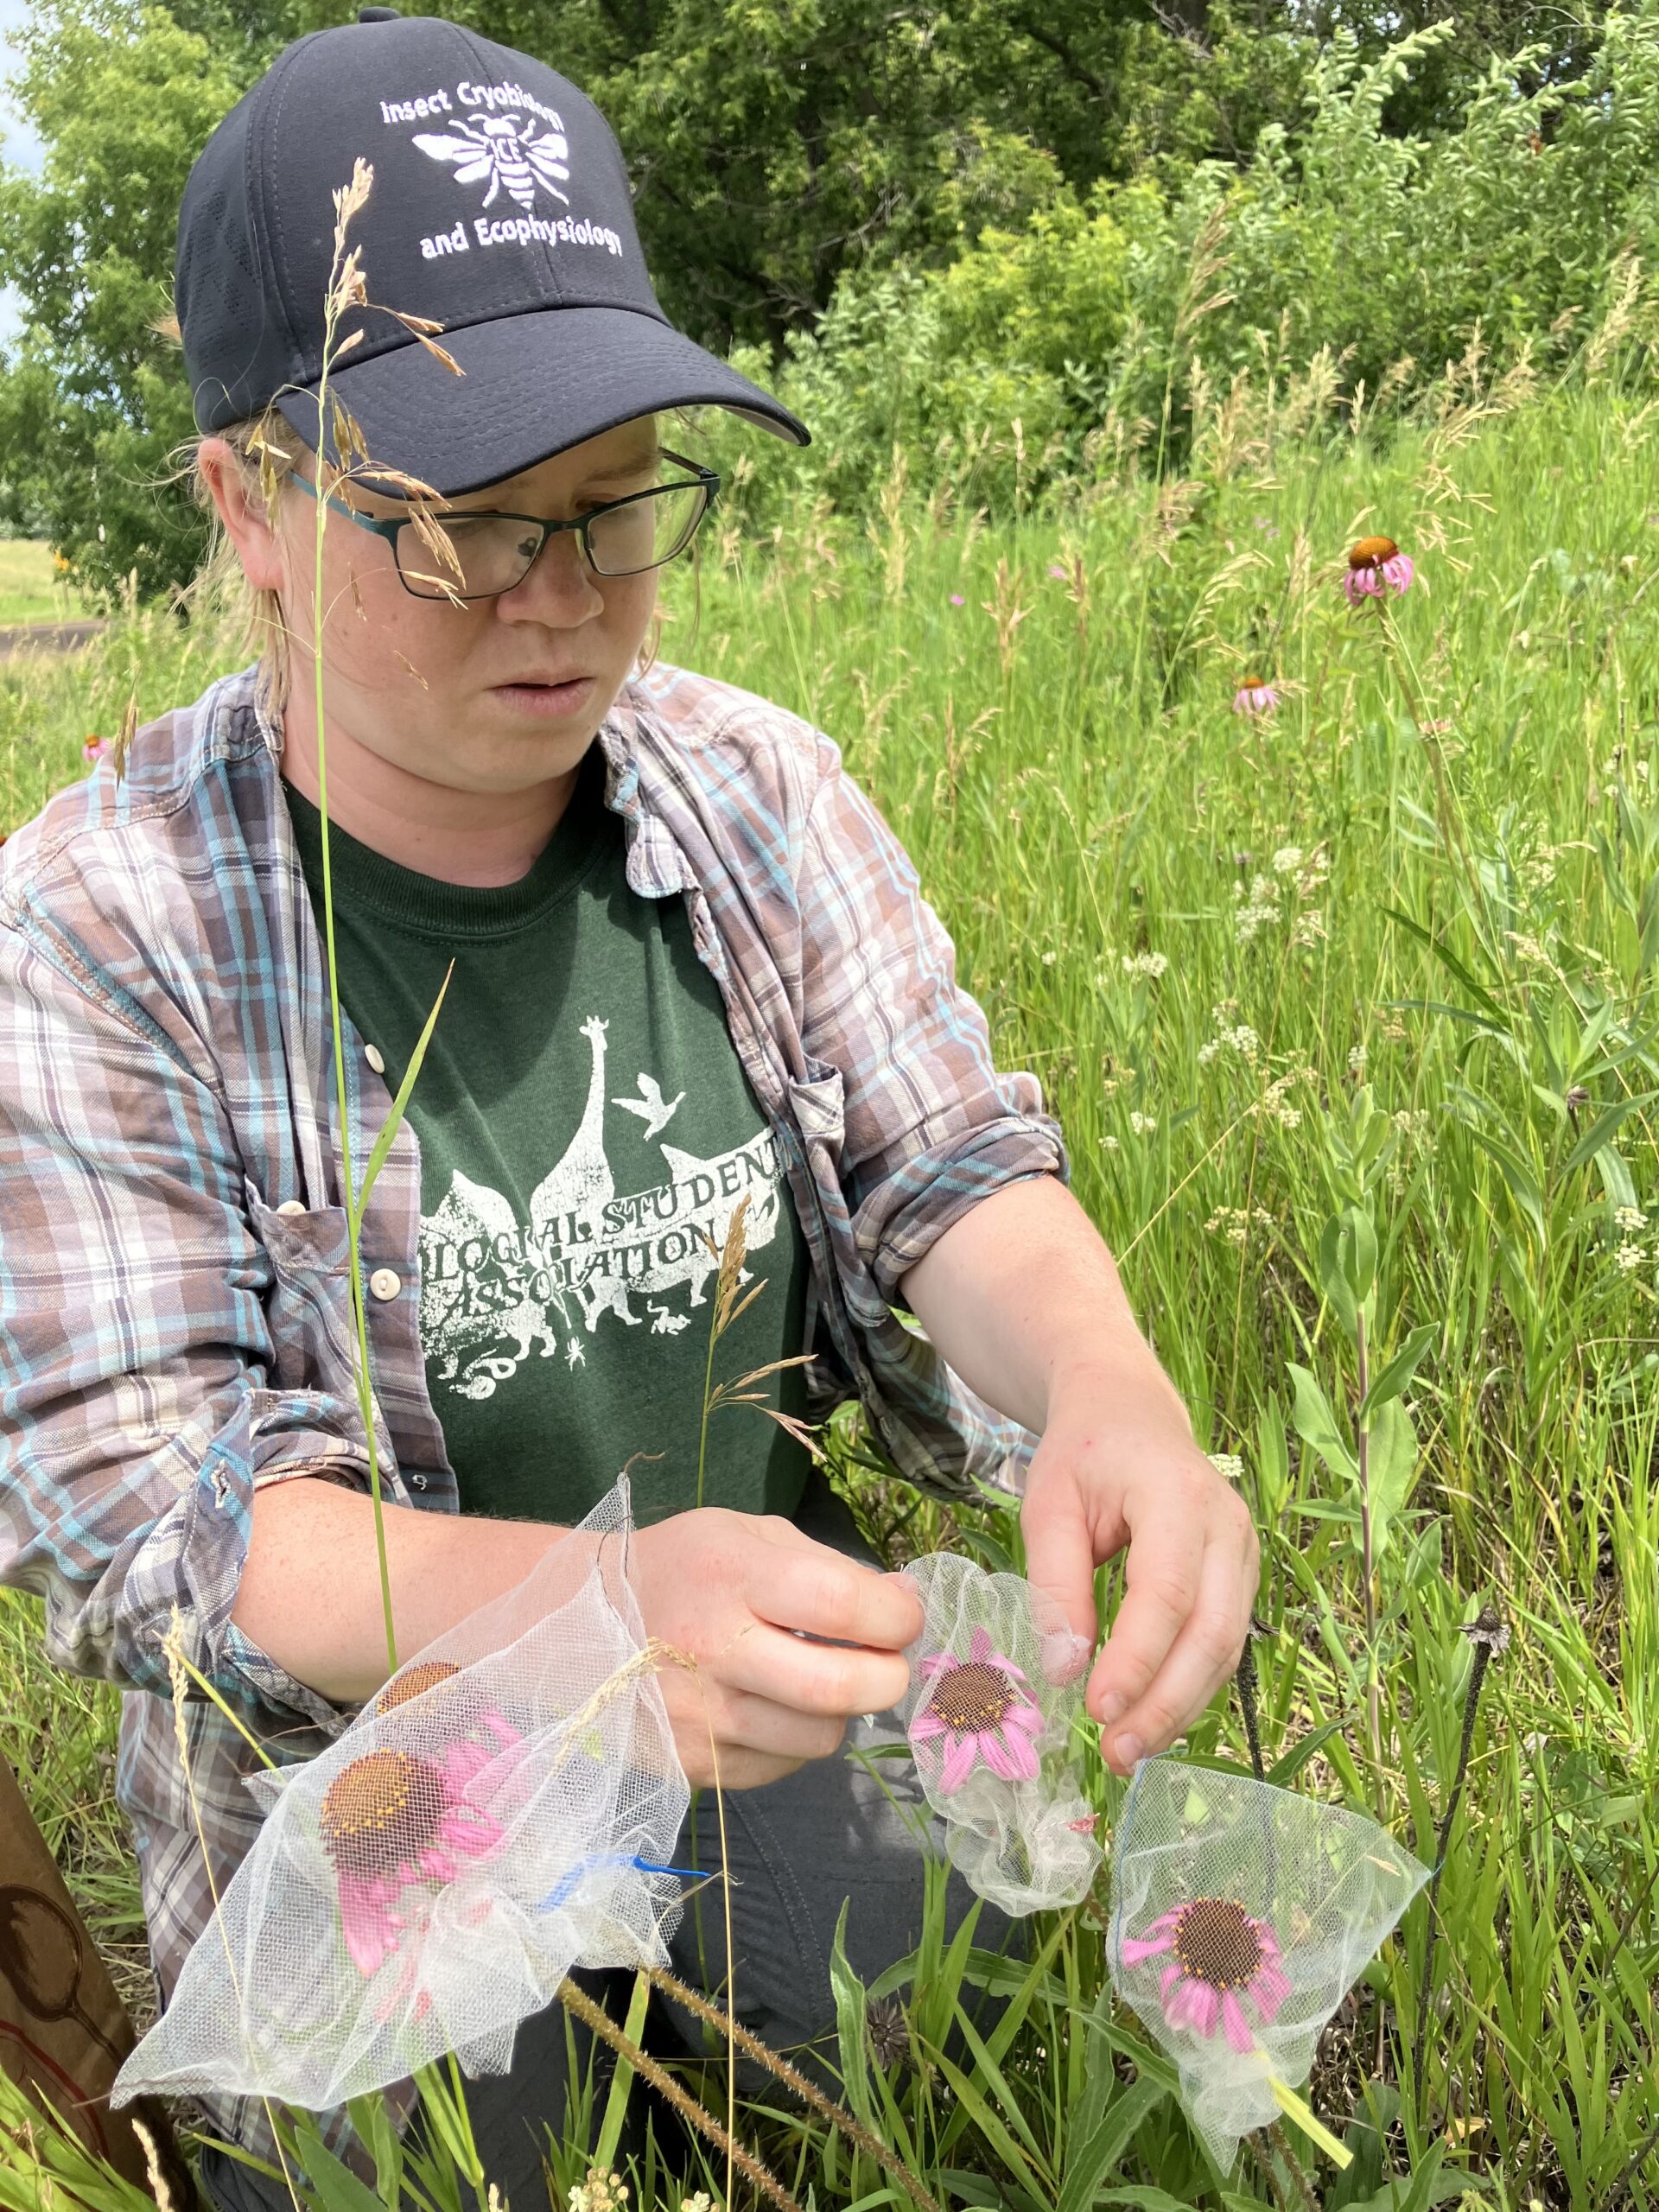
Collaborator and NDSU postdoc Grace Hirzel places pollinator exclusions bags on Echinacea heads in the remnants. If any of the plants in the polLim experiment from the non-control group had flowered this year, it would’ve looked like this!
You can find more information about the pollen addition and exclusion experiment and links to previous flog posts regarding this experiment at the background page for the experiment.
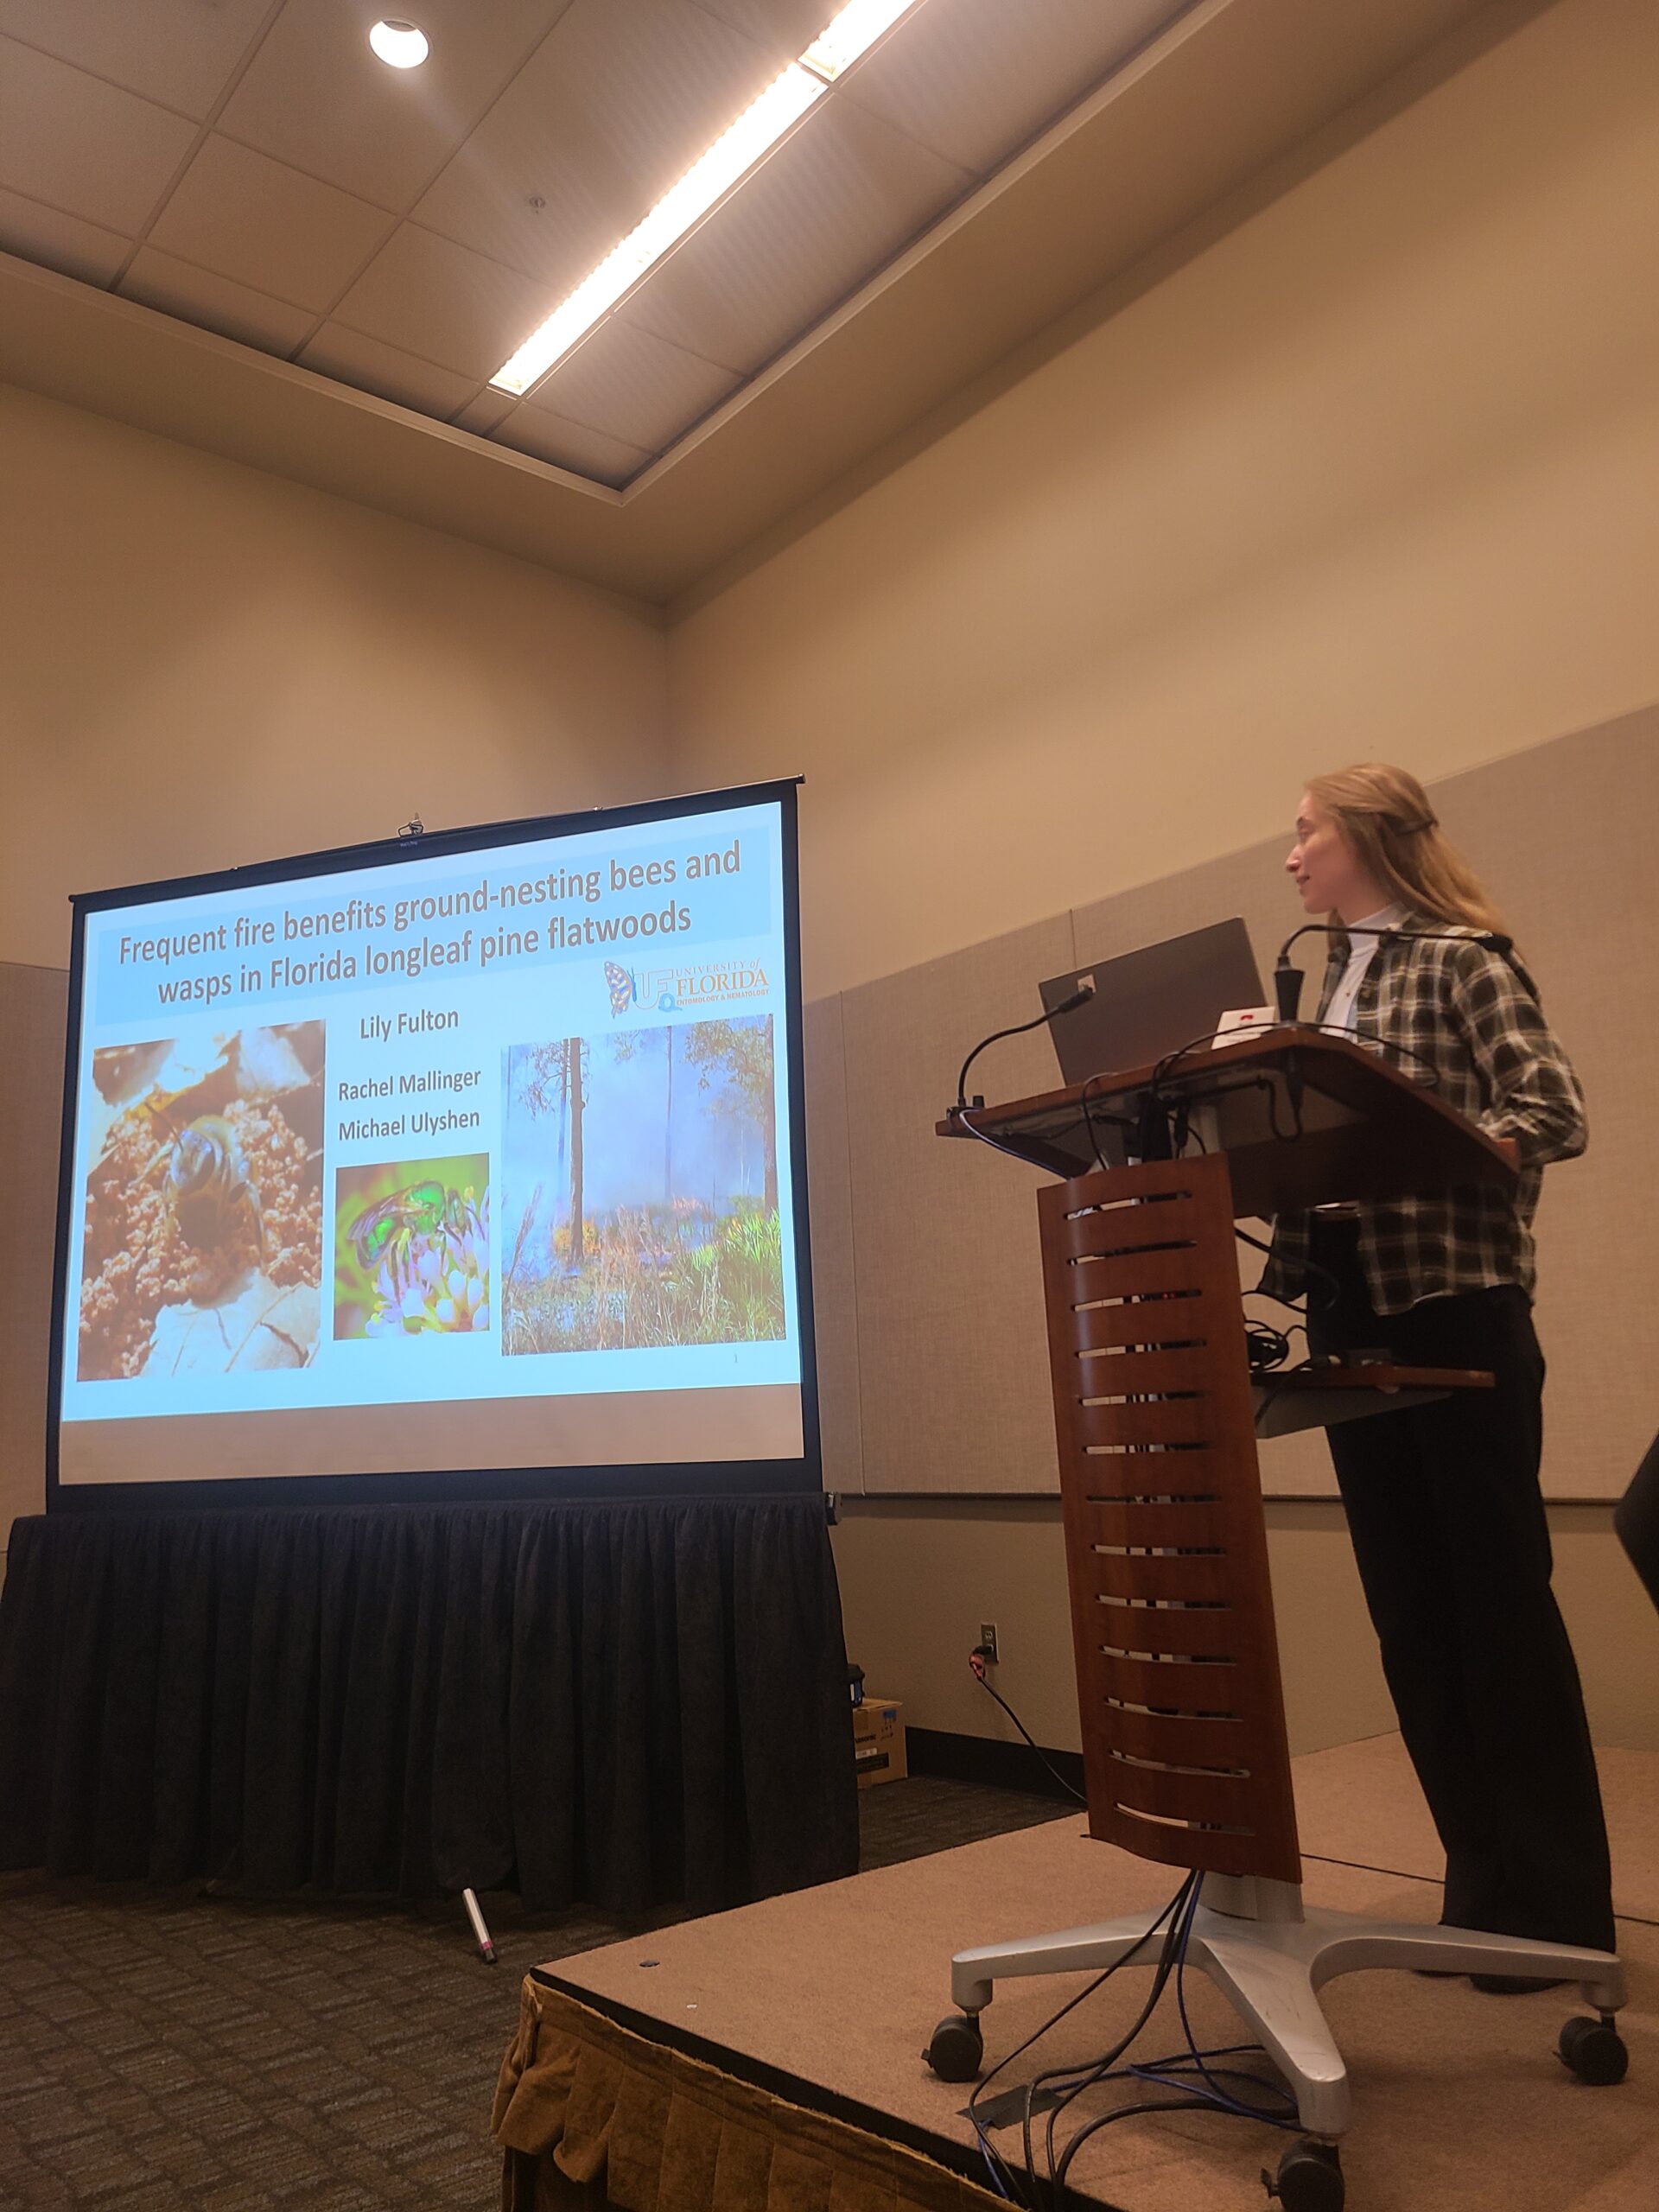
It has been a packed few days here in Phoenix, and I’d like to describe some of the presentations I saw at yesterday’s ground nesting bee symposium. There was a broad range of topics, including the microbe communities found on pollen balls, brood parasite and host interactions, rare desert bees, and more! Nick Dorian had great results to share from his mark-recapture work in New Jersey, which was great to see after he demonstrated that method to Team Echinacea over the summer. Lily Fulton’s presentation really stood out to me: She is also studying prescribed fire, at a long term experimental fire site in Florida longleaf pine flatwoods. they found higher bee and wasp abundances during burn years, as well as higher proportions of bare ground. This is strikingly similar to our research findings! It was great to chat with her about it over my own poster.
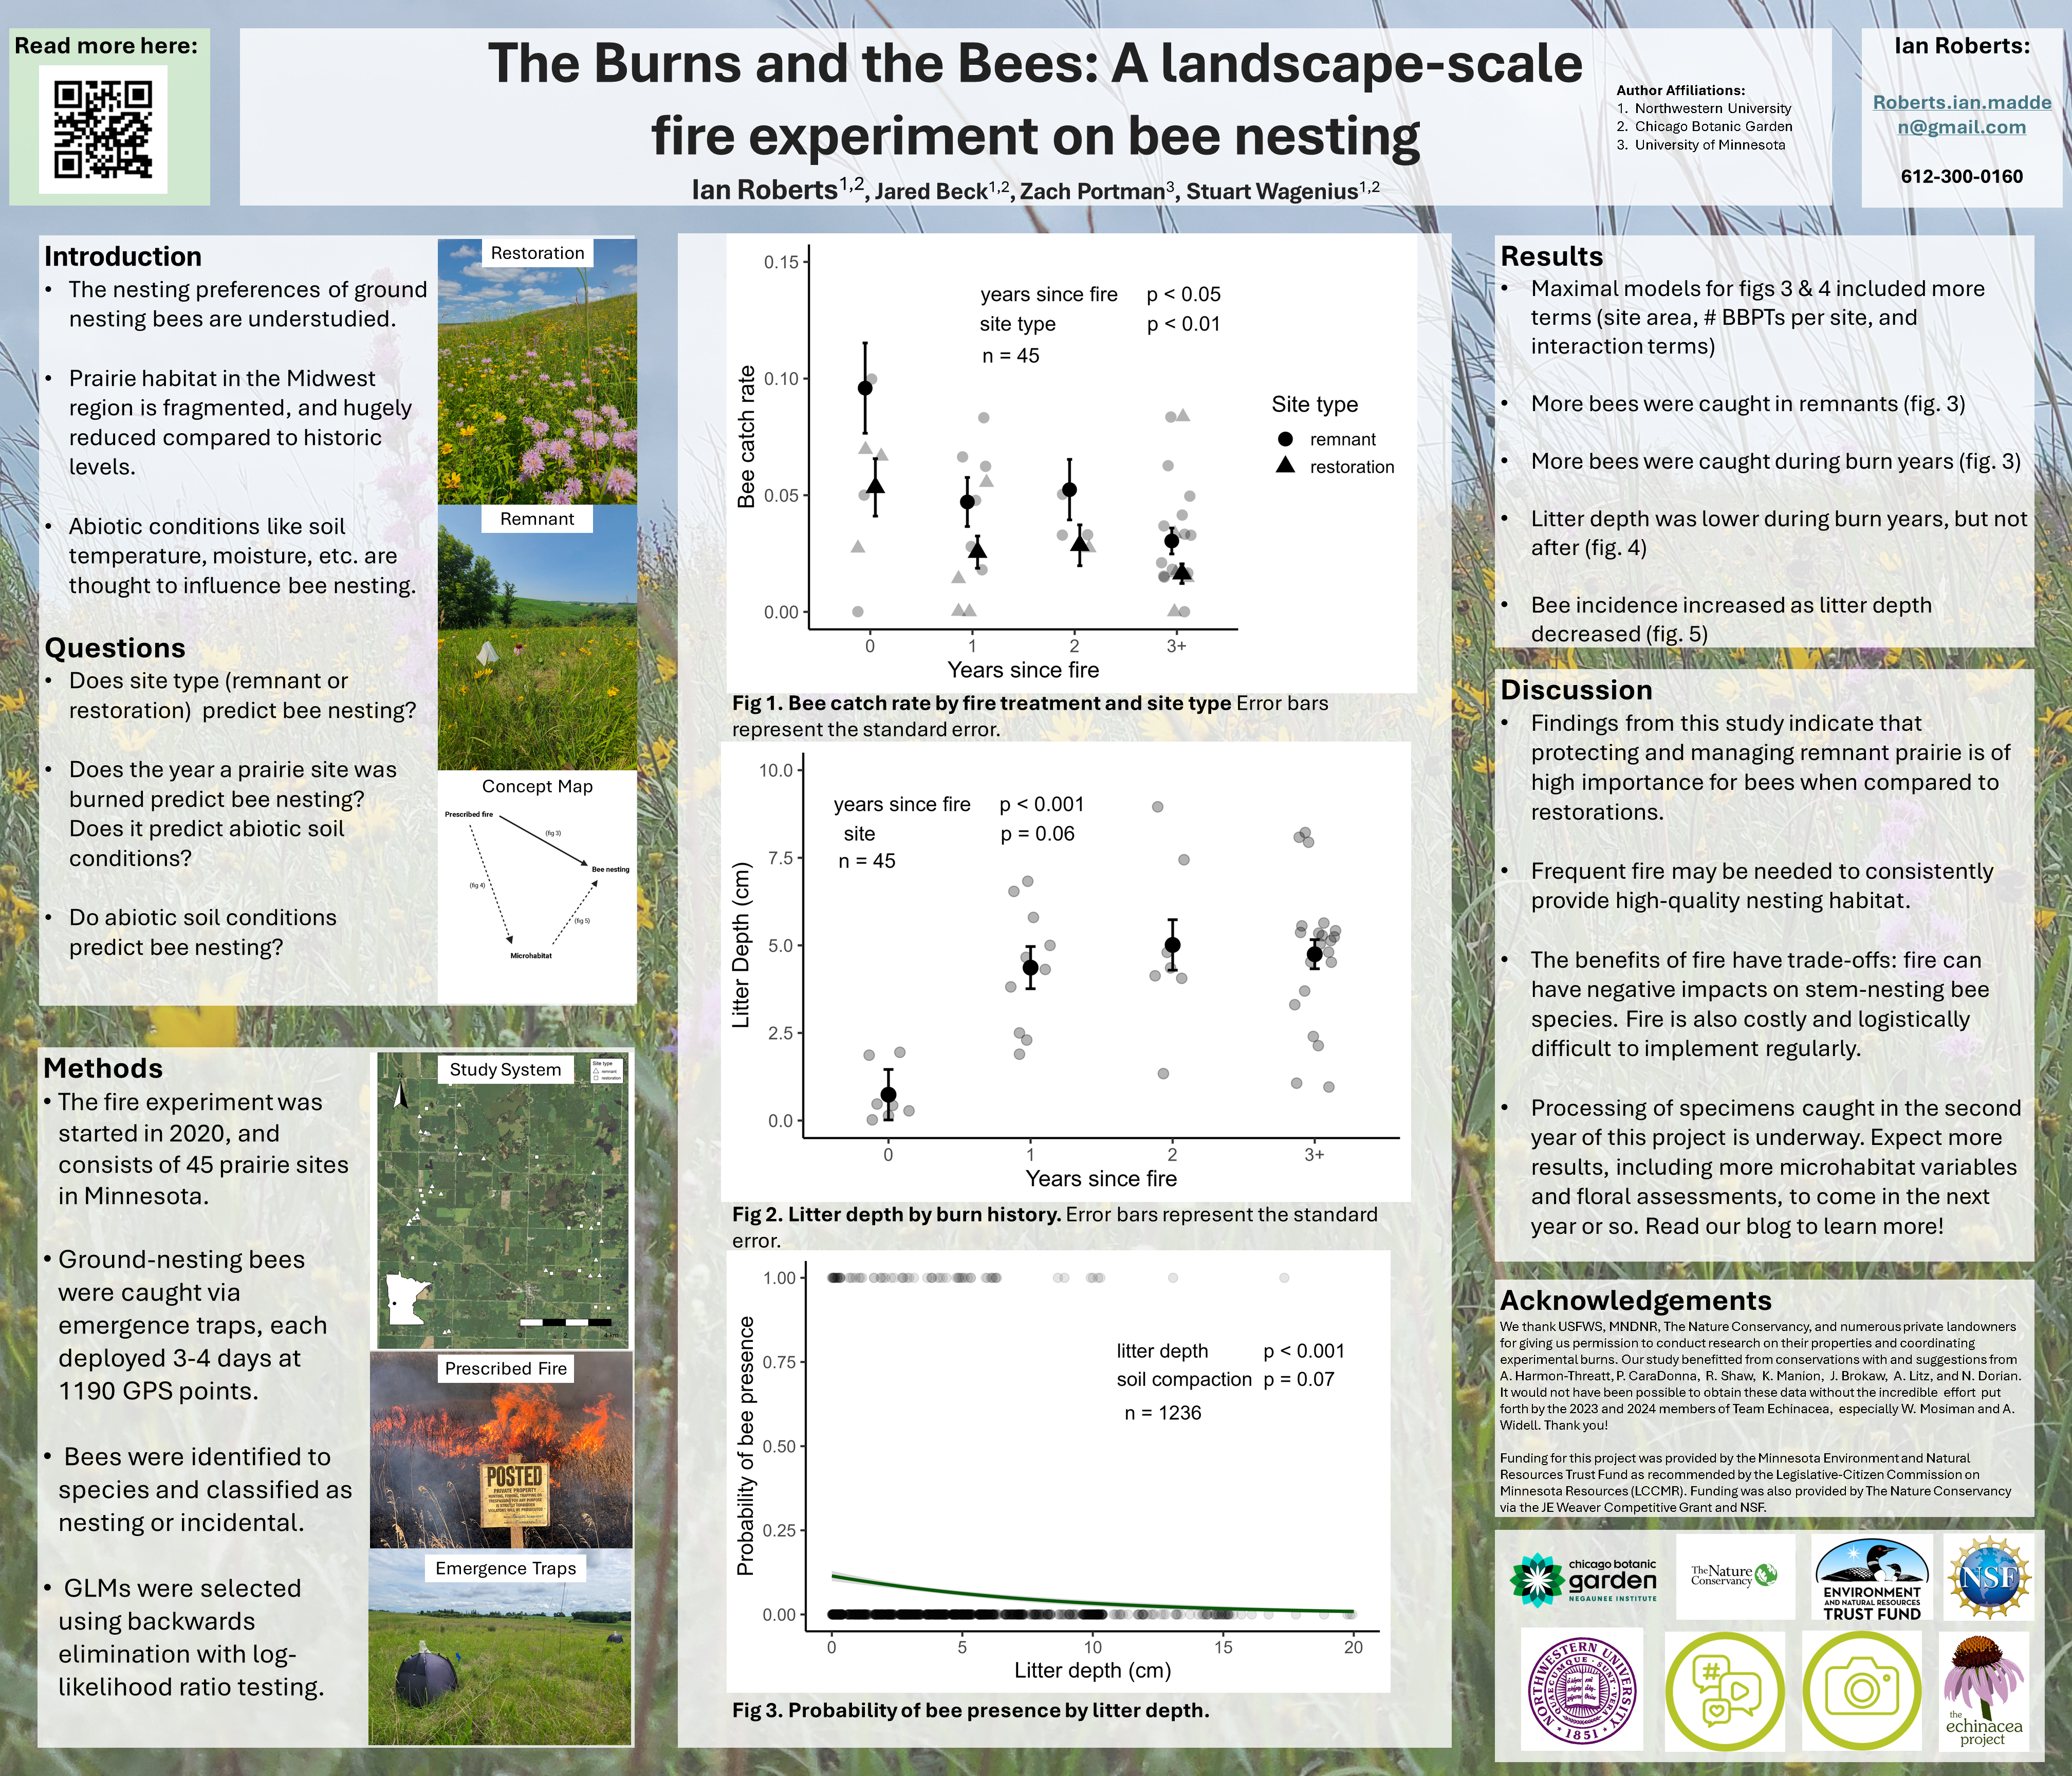
Title slide of Lily Fulton’s presentation. My poster! It is showing the first year of data from the ENRTF project, since we haven’t sent our 2024 bees to Zach yet.
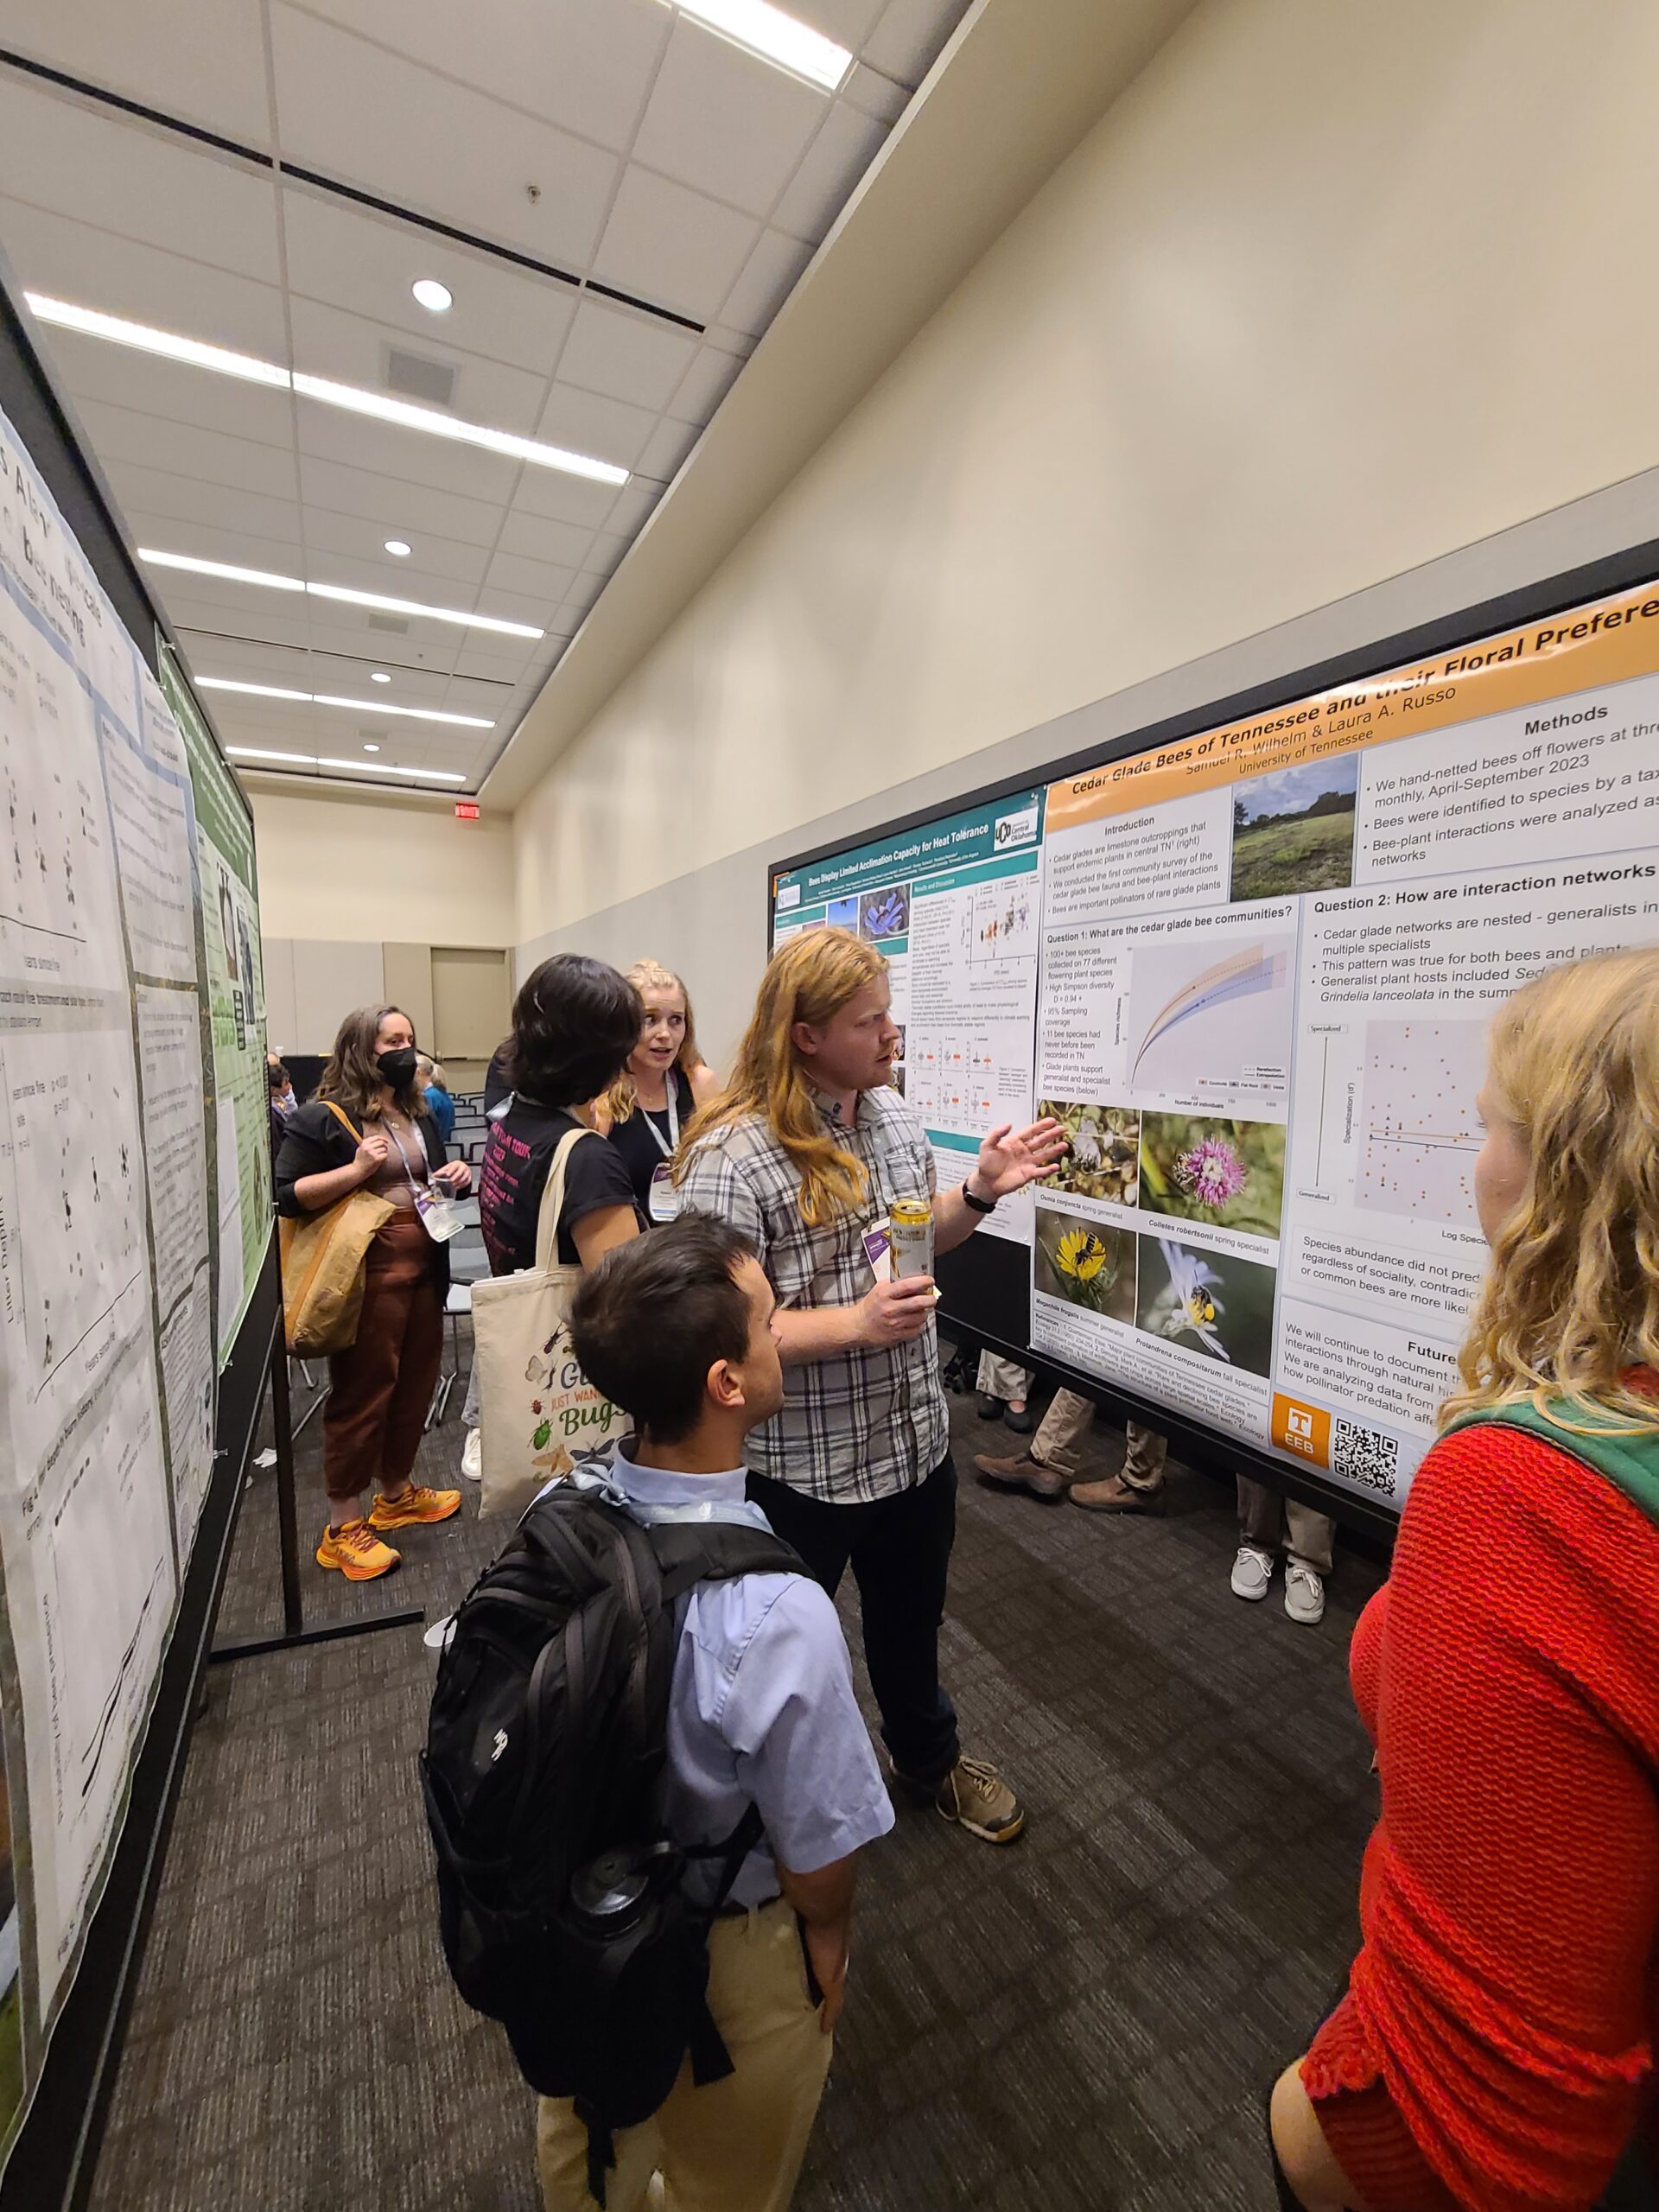
It’s been incredible getting to meet so many researchers who care about native bees. Many stopped by to have a look at the poster! I’ve cited many of them in my previous work, so running into them in person is almost like meeting a celebrity. One consistent interest I’ve gotten from attendees is to look a the community composition of bees in the different treatment groups. Perhaps the increased abundance in the year of a burn we’re seeing is because of a cohort of burn-loving ground nesters, who don’t stick around in following years. It’ll be exciting to look into!
Shot of the poster sessions. There were a ton of applications, so space was pretty limited.
Overall, this has been a fantastic experience and opportunity to expand my network. I got to reconnect with some old friends, and make plenty of new ones. I can’t wait to get back to work on my thesis, now that I know who might be viewing it once it’s published! Expect more on that in the next few months.
Exciting things are happening with Coreopsis pollen and nectar! Data entry for nectar has been accomplished and a figure has been made! The primary goal of this project is to see if prescribed burns have an affect on pollen and nectar quantity in C. palmata. However first and foremost, I want to go into more detail of how I collected data this summer, and then I’ll talk about my new nectar figure and what our findings are currently looking like.
Field Methods Step by Step: Pre-Collection:
In order to collect pollen and nectar samples we first need to identify the plants we are sampling from.
Random bb-points are pre-selected to designate areas of study interest within each site. Identify the closest “patch”, which is a central location with 5 or more stems of coreopsis, relevant to the bb-point. Record the location of each patch using Avenza. (2024 Avenza layer can be found in “Dropbox / teamEchinacea2024 / maddieSadler / coreopsisPalmata”)
Place a flag in the relative center of the patch and label it with it’s patch ID number.
Select 5 plants that are still completely immature and place a pollen excluder bag over the head of the plant.
Monitor plants for a few days until they reach day two or three of anthesis where anthers are protruding and there are still immature florets in the center of the head. This is important later for pollen collection.
Pollen Collection:
Select the plant to sample from bagged plants located in each patch. We chose 3 of the 5 bagged plants based on day of anthesis and general look of the head.
Record the bb-point of the coreopsis patch, site name, and location on the data sheet.
Remove the pollinator exclusion bag from the selected head.
For pollen collection we will be collecting 3 immature florets from the head of the flower.
Label your microfuge tube with the plant ID number located on the data sheet.
Take the tweezers and carefully extract three immature florets, one by one, from the flower head and place them into the microfuge tube. Make sure to be careful that you do not rip the floret in half or puncture it with the tweezers.
Once all three florets are placed inside the tube, close it. Place the tube into the cooler with ice packs for further sorting upon your return from the field.
Repeat steps 1-8 for next plant.
Upon returning to the Hjelm House, place the collected pollen tubes in the collected samples box, which then is stored in the freezer.
Nectar Collection: This was adapted from the 2022 nectar protocol for Echinacea which can be found here.
After pollen collection you will begin the process of nectar collection.
On the same heads used from pollen collection, select the anthers that are the most recently presented to sample from.
Insert the microcap tube into the anther floret. Insert the microcap down into the floret until there is light resistance when you reach the base of the floret.
Twist or rotate the microcap five times.
Carefully remove the microcap.
Repeat steps 3-4 on all presented anther florets on the selected flower head.
Record the amount of nectar collected in the microcap in millimeters (mm). It is helpful to hold the microcap up to the sun to see the refraction of light from the nectar to see the amount collected. You can use a magnifying glass if needed to read the amount of nectar in mm on the ruler.
Place the entire microcap with the collected nectar sample into a microfuge tube to be disposed of properly outside of the field.
Once this task is completed, it will not need to be done for the same plant in the future.
Repeat steps 2-8 for the next plant in the patch.
After all plants in patch are sampled from remove any extra pollinator bags and remove the flag from the center of the patch. Collection will not be repeated on the patch.
Field Supply Checklist:
Pollen Supplies:
Microfuge tubes (tall enough to put the immature floret inside and close the cap)
Permanent marker
Pen
Extra pollinator exclusion bags
Flag bag with flags of the designated color
Magnifying glass glasses with 3.5 – 5 X magnification
Tweezers
Water and sunscreen
Clipboard with the data sheet
Field collection box to hold small supplies
Small cooler with ice packs
Nectar Supplies:
Microfuge tubes (tall enough to put the microcap inside and close the cap)
Magnifying glass glasses with 3.5 – 5 X magnification
Ruler with mm markings
Water and sunscreen
Clipboard with the data sheet
Field collection box to hold small supplies
Now for the fun stuff!
Over this past week I’ve worked on creating this graph seen down below. This graph looks at the total amount of nectar in millimeters in each tube from each plant in our burned and unburned site combinations. These site combinations were created based on proximity to each other and burn history. For example, TorgN was burned, but TorgS, directly across from it, was not; Tower was burned, but Nice, directly across from it, was not. For YOHW and YOHE, we ran into an issue in that YOHE, the unburned side, had no flowering C. palmata in it; thus, we only have data from YOHW.
As we can see there is large amount of variation in totals across all the sites. When looking at the mean values (the red and blue squares on the graph) we are finding the slightest bit of evidence that burned sites are showing higher levels of nectar. Meaning my original hypothesis, that we’d see strong evidence that there is difference in quantity in burned sites rather than unburned sites is out the window! However, we can’t fully accept the null hypothesis, that there is strong evidence of no difference in nectar quantity, since there is not enough supporting evidence. Having this knowledge now, it will be interesting to see if there is a similar pattern in our pollen counts. Data and analysis on that to come!
Fig: Total (mm) of nectar in tubes for each plant at each site. Red squares (burned) and Blue squares (unburned) show average total with standard error.
**The code for this graph can be found in: “Dropbox / teamEchinacea2024 / maddieSadler / coreopsisPalmata”.**
NOTE: Funding for this project was provided by the Minnesota Environment and Natural Resources Trust Fund as recommended by the Legislative-Citizen Commission on Minnesota Resources (LCCMR).
In 2024, we harvested Echinacea in the remnants for Jennifer Ison’s pollinator observation study and at the Hegg Lake pallida restoration.
For the pollinator observation study, we quantified reproductive effort on a given day and watched heads at different plants across 10 remnants. When a pollinator visited our focus head, we would take a video so we could later ID the pollinator.
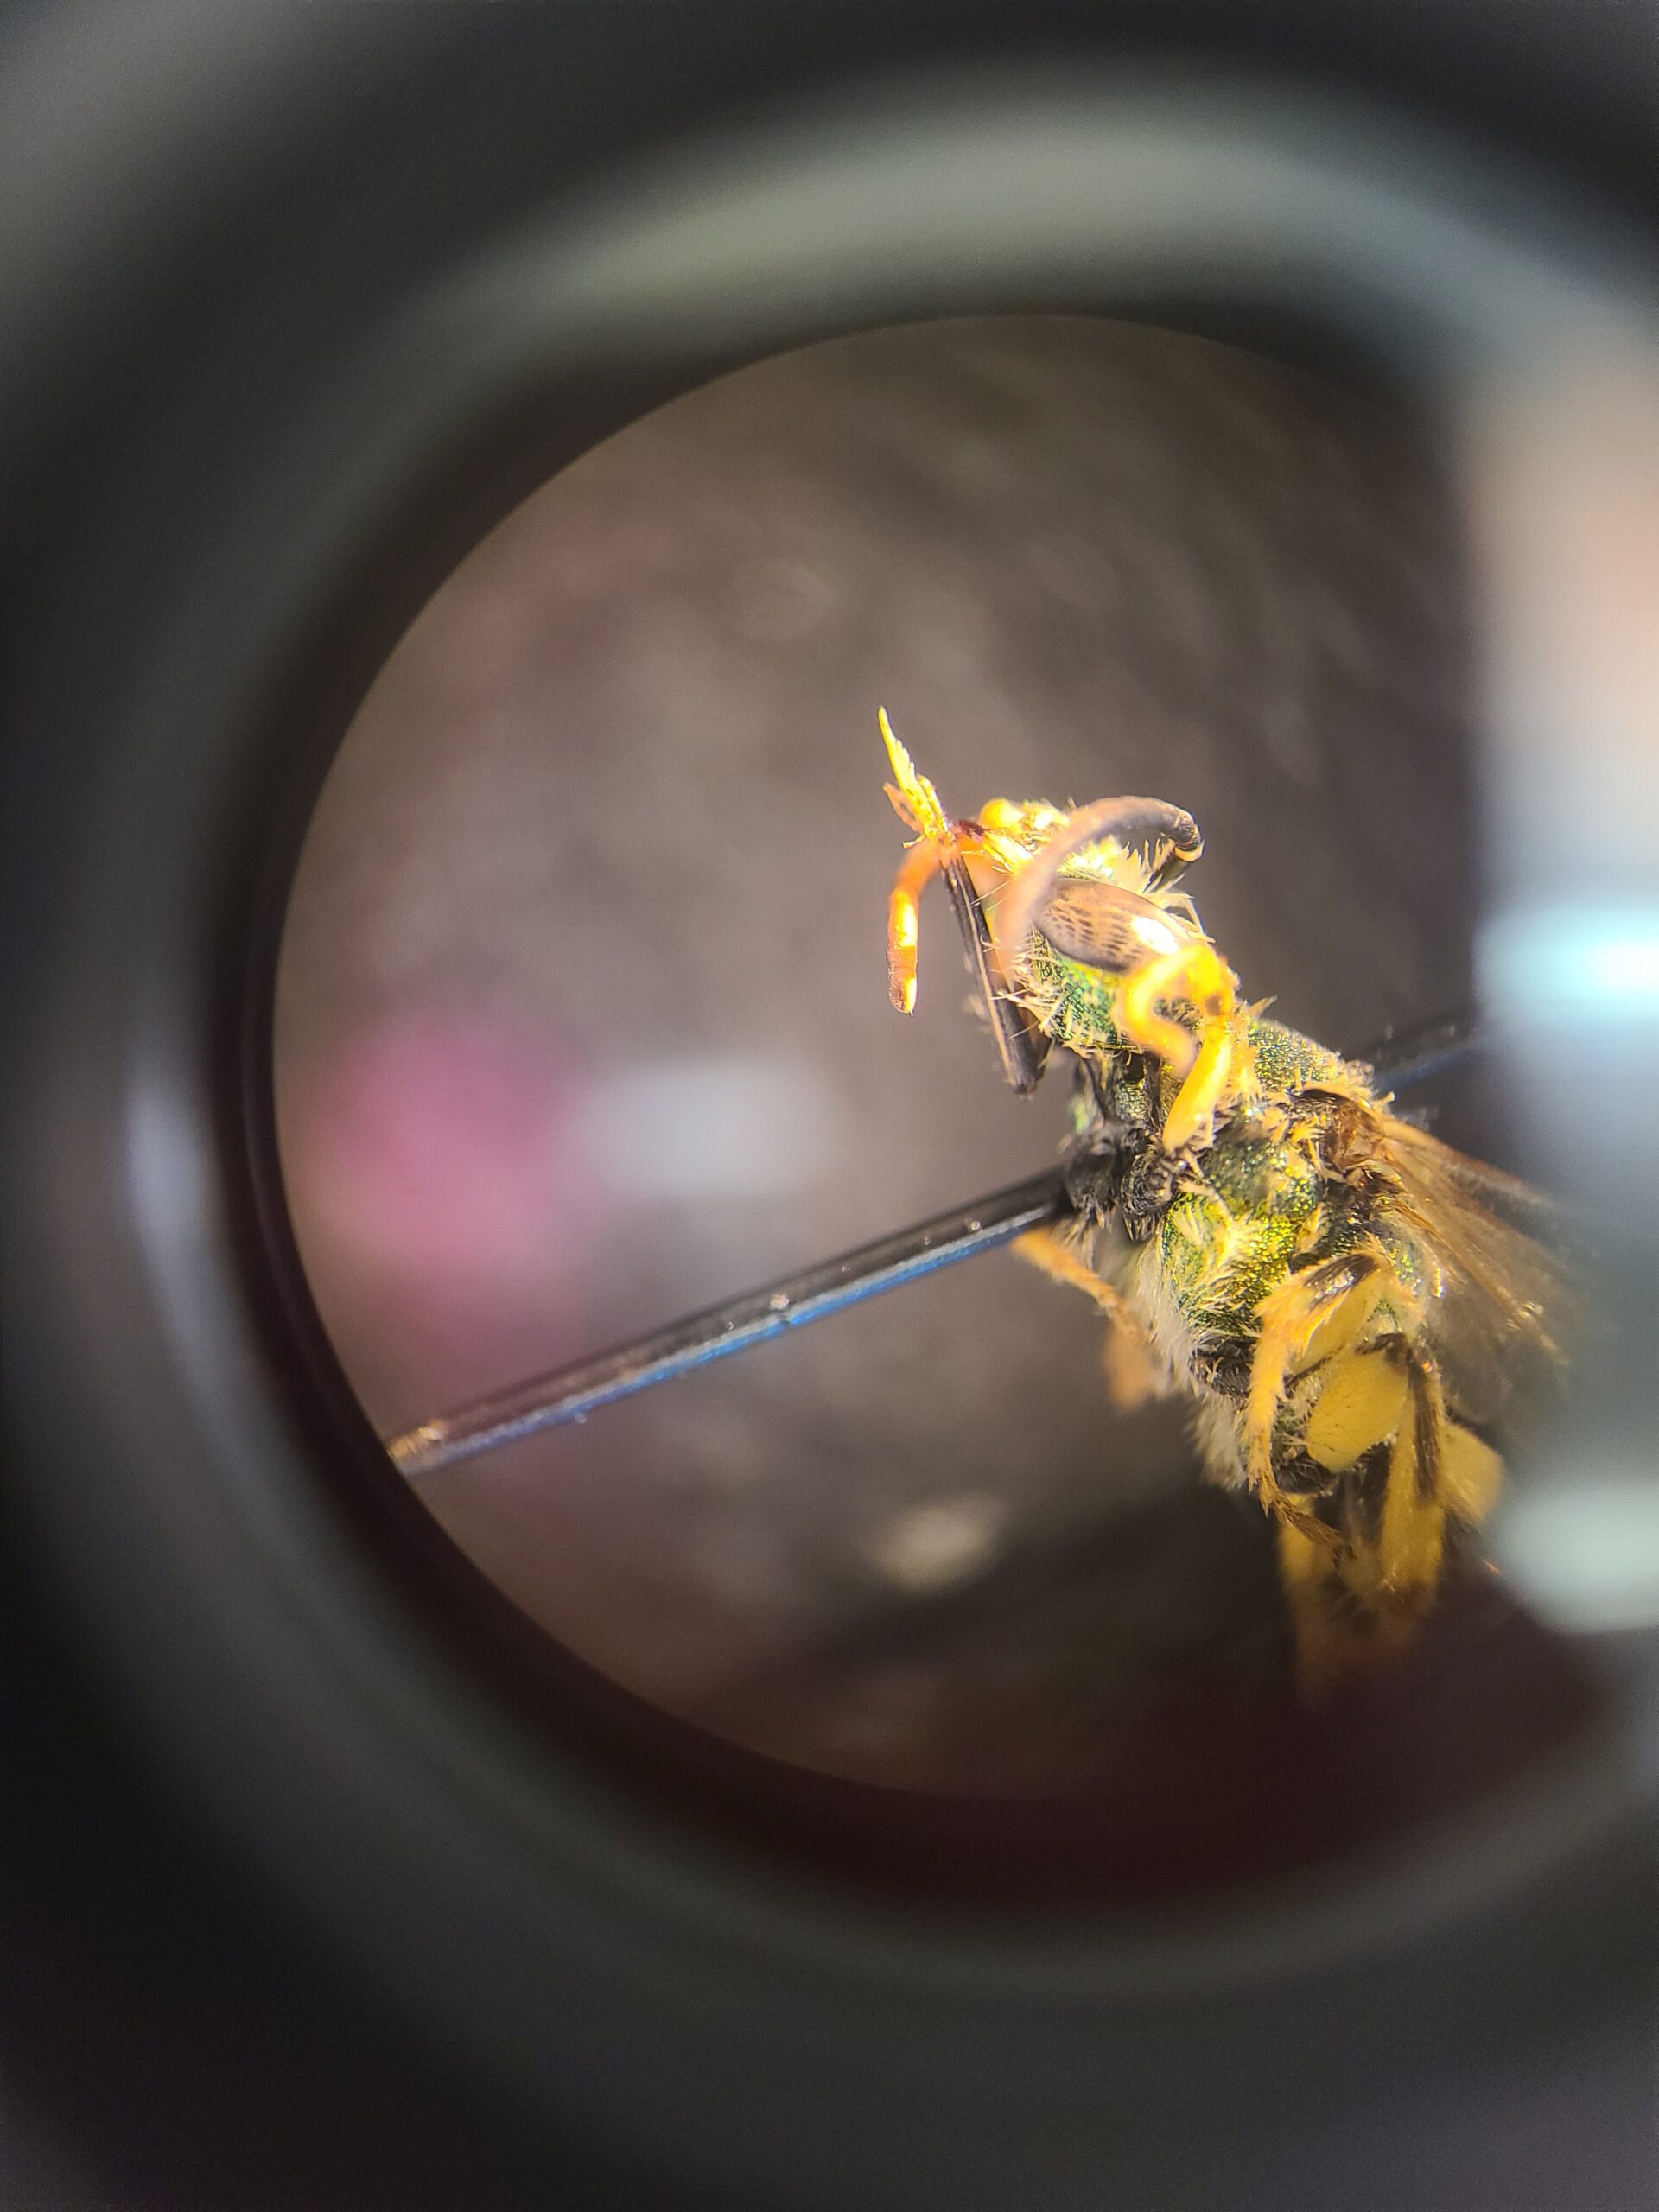
This pollinator observation was done by Ning on a plant at yohw this summer. I asked Ian to give his best ID and he thinks this is a Halictus species! Very cool.
We harvested heads from plants involved in this experiment to get an idea of how observed visitation links up with realized seed set. In total, we harvested 136 heads and brought them back to the botanic garden for processing. Here are the detailed stats:
TOTAL: 136 heads
hulze: 15 heads (11.0%)
hulzw: 14 heads (10.3%)
hutche: 9 heads (6.6%)
hutchw: 13 heads (9.6%)
nice: 15 heads (11.0%)
torgen: 14 heads (10.3%)
torgew: 15 heads (11.0%)
tower: 11 heads (8.1%)
yohe: 15 heads (11.0%)
yohw: 15 heads (11.0%)
Again, please forgive rounding errors. This batch is the highest priority in the lab; volunteers are currently working on cleaning these heads and hopefully the rest of the ace process is soon to follow!
We also harvested, or perhaps I should just say decapitated, Echinacea pallida at Hegg Lake WMA. This species is native to areas primarily south and east of our study site, such as Indiana and Arkansas. SO how did they wind up in Minnesota? Seed for pallida was accidentally included in a restoration effort by the MN DNR years back. This raised concerns for us about potential hybridization with our native Echinacea angustifolia. (If you want to learn more about angustifolia x pallida hybridization like we did, check out our experiments to that end!) In summer 2024, we once again conducted our civic duty and decapitated pallida heads at Hegg in an attempt to prevent reproduction and further spread. We sliced and diced a total of 523 heads this year, with the largest plant having 20 normal flowering heads! Wowza.
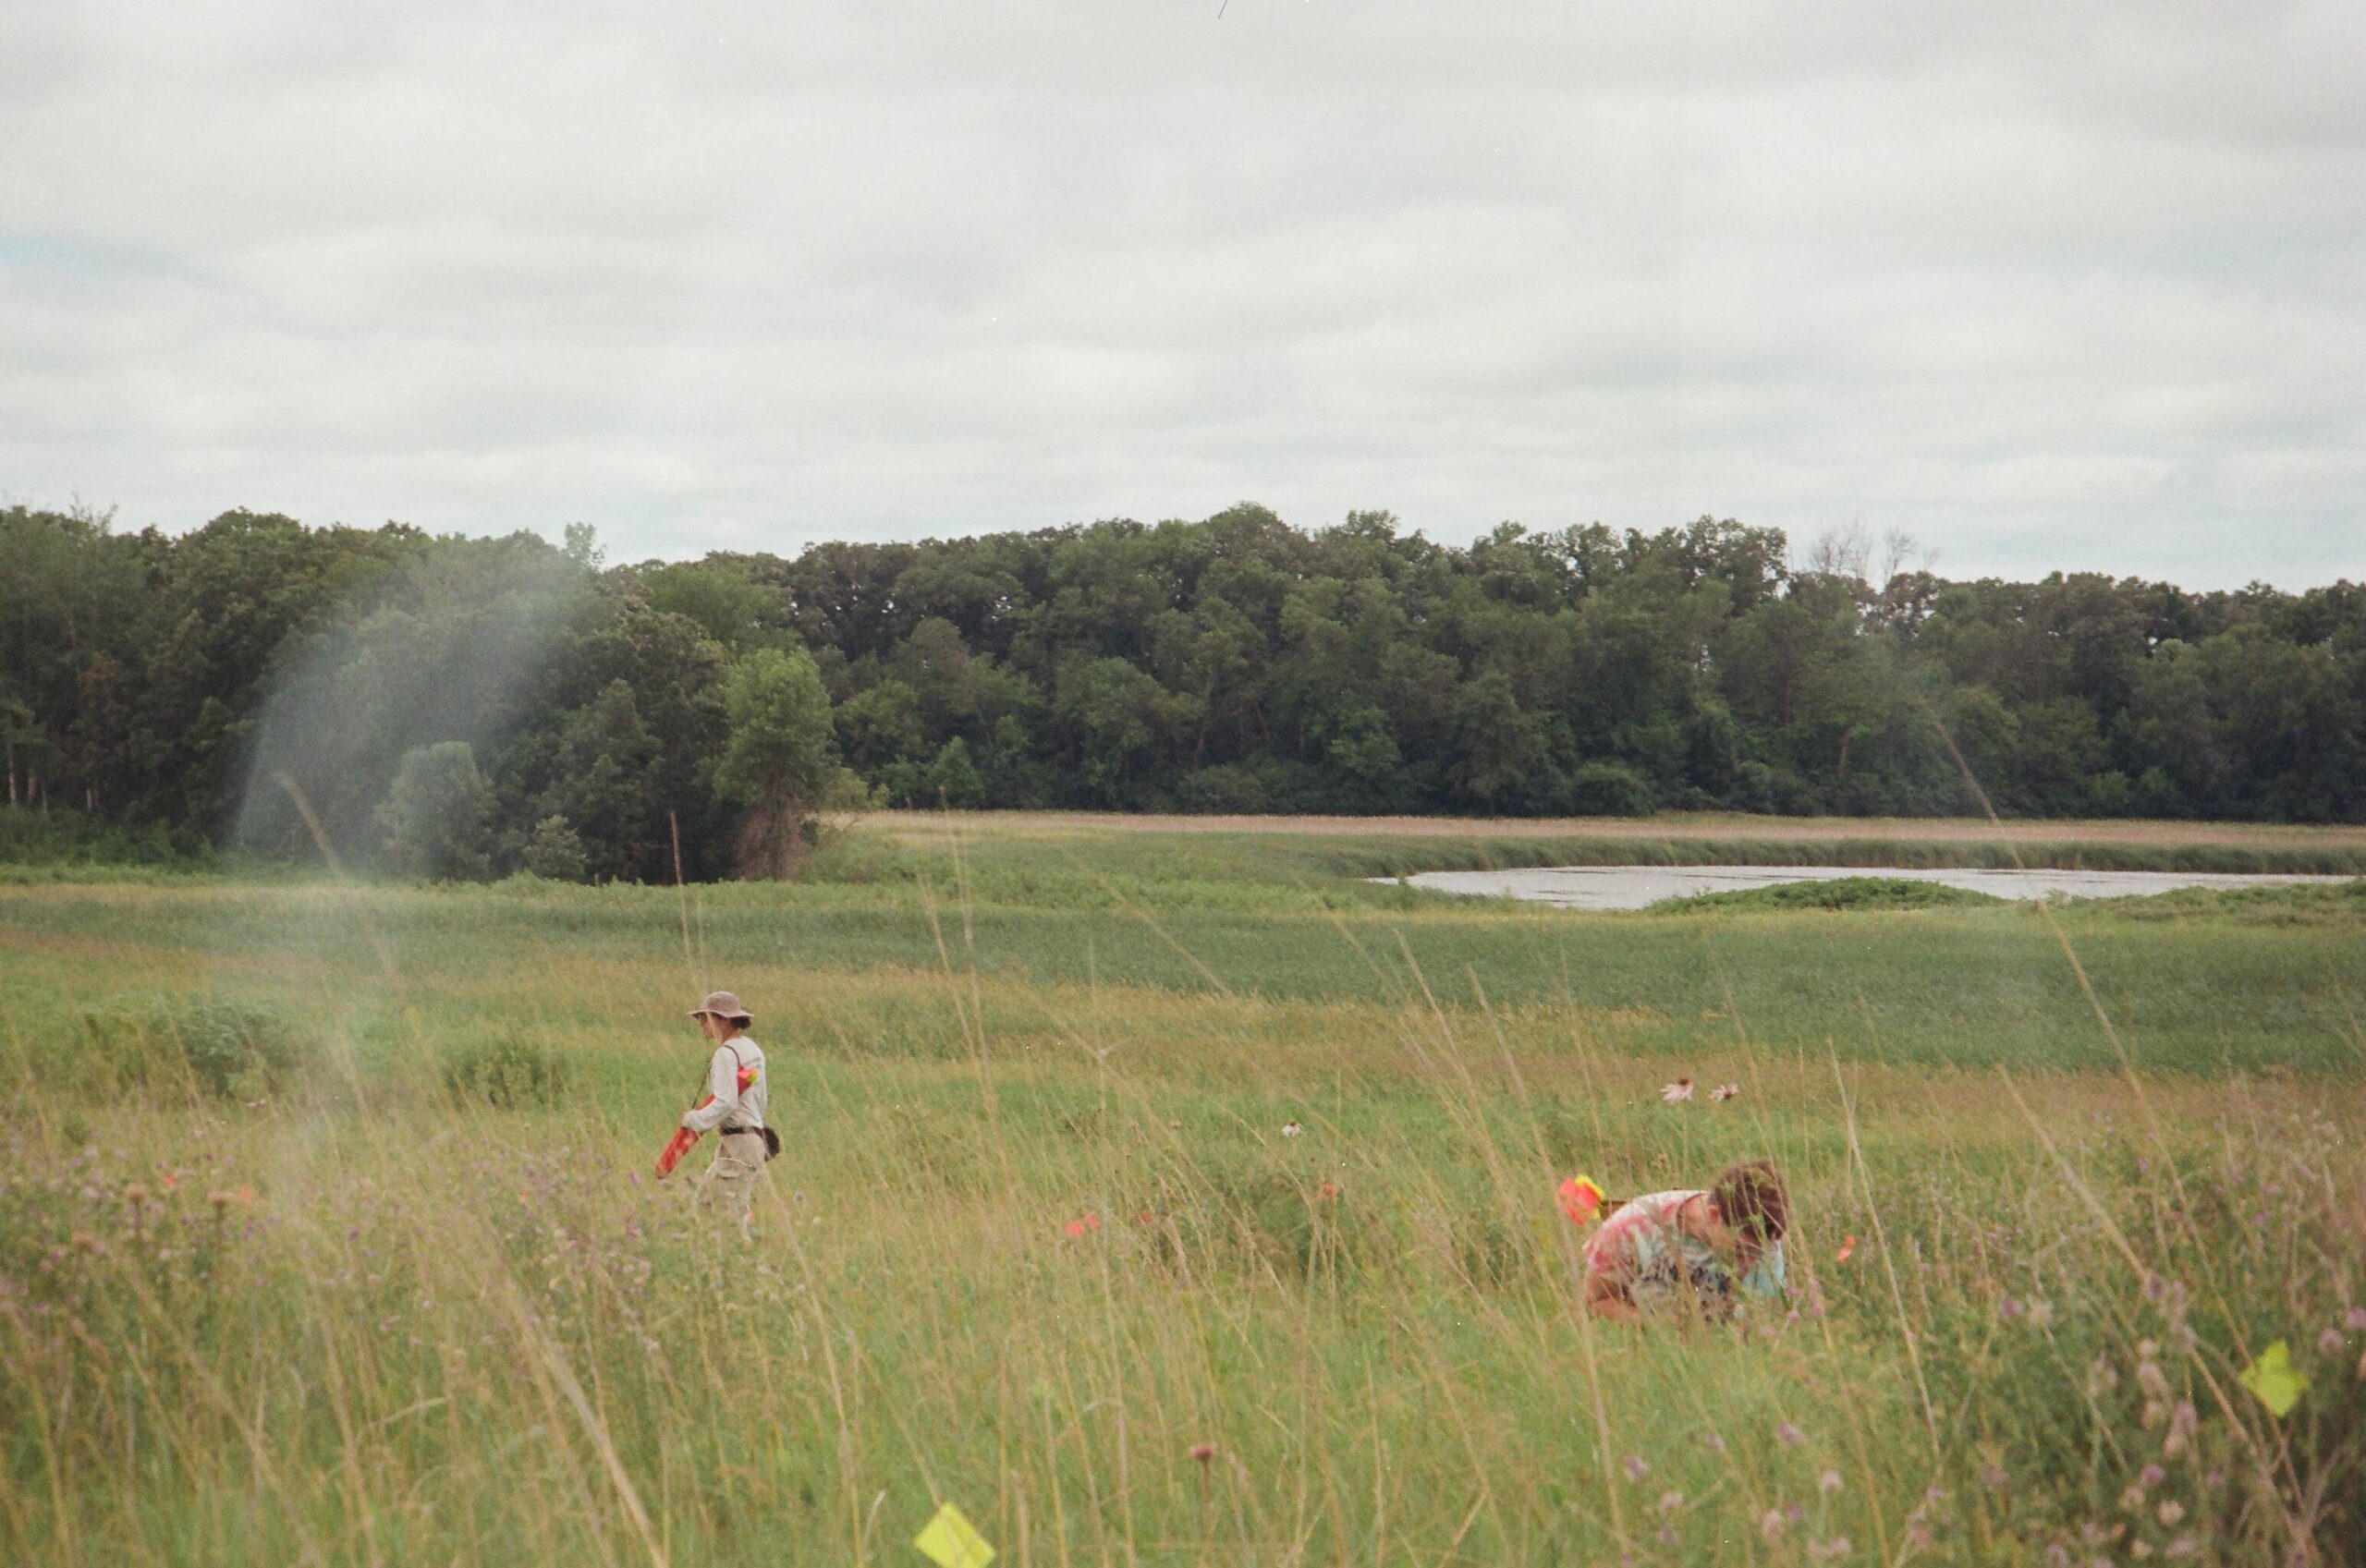
Team members Liam and Maddie search for and take demography records of Echinacea pallida at Hegg lake before decapitating any heads that could later produce pollen. Photo credit Zach Zarling
There was also one plant at the location we refer to as “near pal” that we suspected may be an escaped hybrid; that is, a plant that we believe may be a natural hybrid of angustifolia and pallida. This individual only had one head, but was taller and more robust than its angustifolia neighbors. We put a pollinator exclusion bag on the head to prevent pollen spread, and later harvested the head and brought it back to the lab, where it is currently in the seed dryer. Keep an eye on 29239 in the future…
2024 was a relatively low-flowering year in the common gardens, but that doesn’t mean we didn’t bring plenty of Echinacea heads back to the lab for our volunteers! Here are our stats:
TOTAL: 689heads
exPt01: 82 heads (11.9%)
exPt02: 375 heads (54.4%)
exPt07: 87 heads (12.6%)
exPt08: 23 heads (3.3%)
exPt09: 110 heads (16.0%)
tplot: 12 heads (1.7%)
(rounding errors in %s abound)
Our first harvest was at p2, p7, and p9 on August 19th. Our last harvest was all the way on October 3rd at p7 and p9! Those hybrid plants really held on for awhile. Unfortunately, our first harvest was not in time to harvest some heads before they begin dispersing, and there are always a couple that lose achenes throughout the harvest season before we catch them. This year wasn’t toooo egregious, but our worst head lost an estimated 85% of its achenes before we encountered it. Yikes! Keep an eye out for seedlings around (7, 2) in p2…
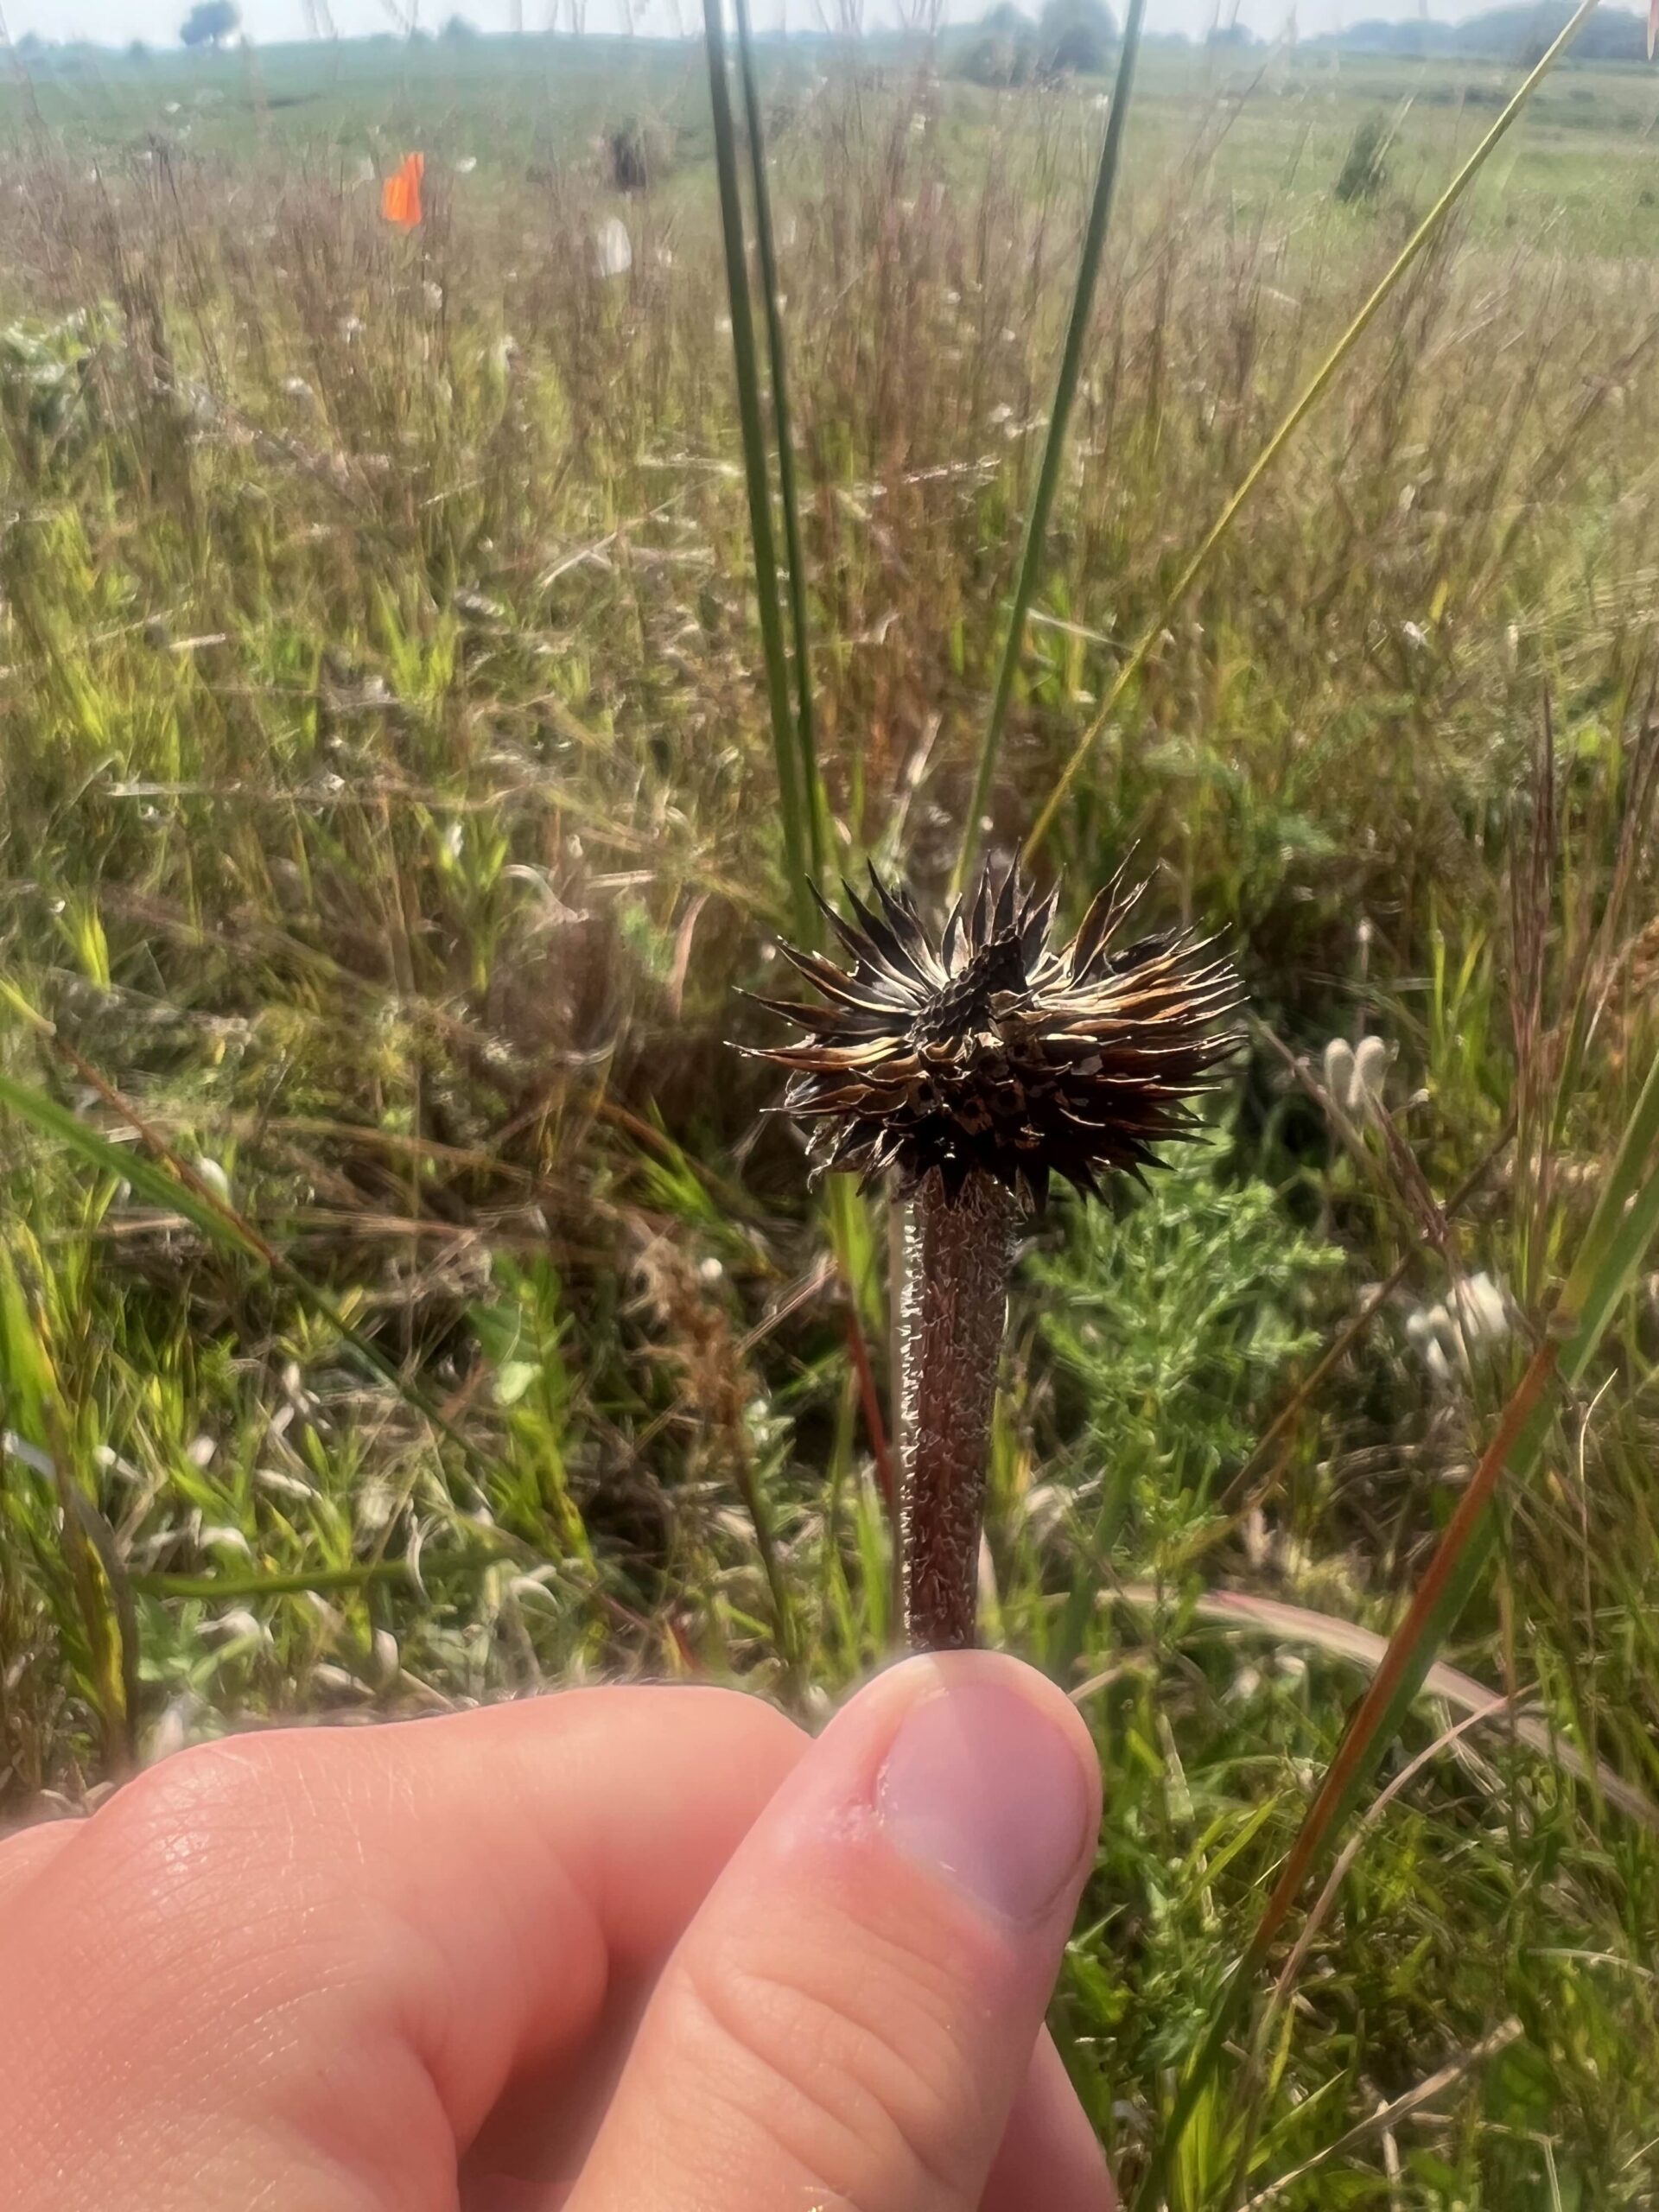
A few achenes shy of a full head…
One major victory from this year is that, besides a couple holes and piles of dirt, the ground squirrels were relatively well behaved in p2 this year. Typically, they enjoy ripping heads off echinacea plants and leaving stems, heads, and achenes everywhere. Based on harvest notes, in 2024 we only found two heads on the ground and only one was missing entirely. Compare this to 2022, when the team only harvested 41% of the heads they planned on harvesting due to ground squirrel activity. (Though, I suspect this may have been a blessing—they still harvested 480 heads. If they’d harvested all of them, it would have been around 1,170 heads. That’s a lot of harvesting!)
Another fun fact: The 99 south garden in p1 produced 25 heads this year, but its 99 north counterpart didn’t have a single flowering plant.
Additionally, we did visit p5 this year and found several flowering (and some basal) plants, but were instructed not to harvest them, so we didn’t.
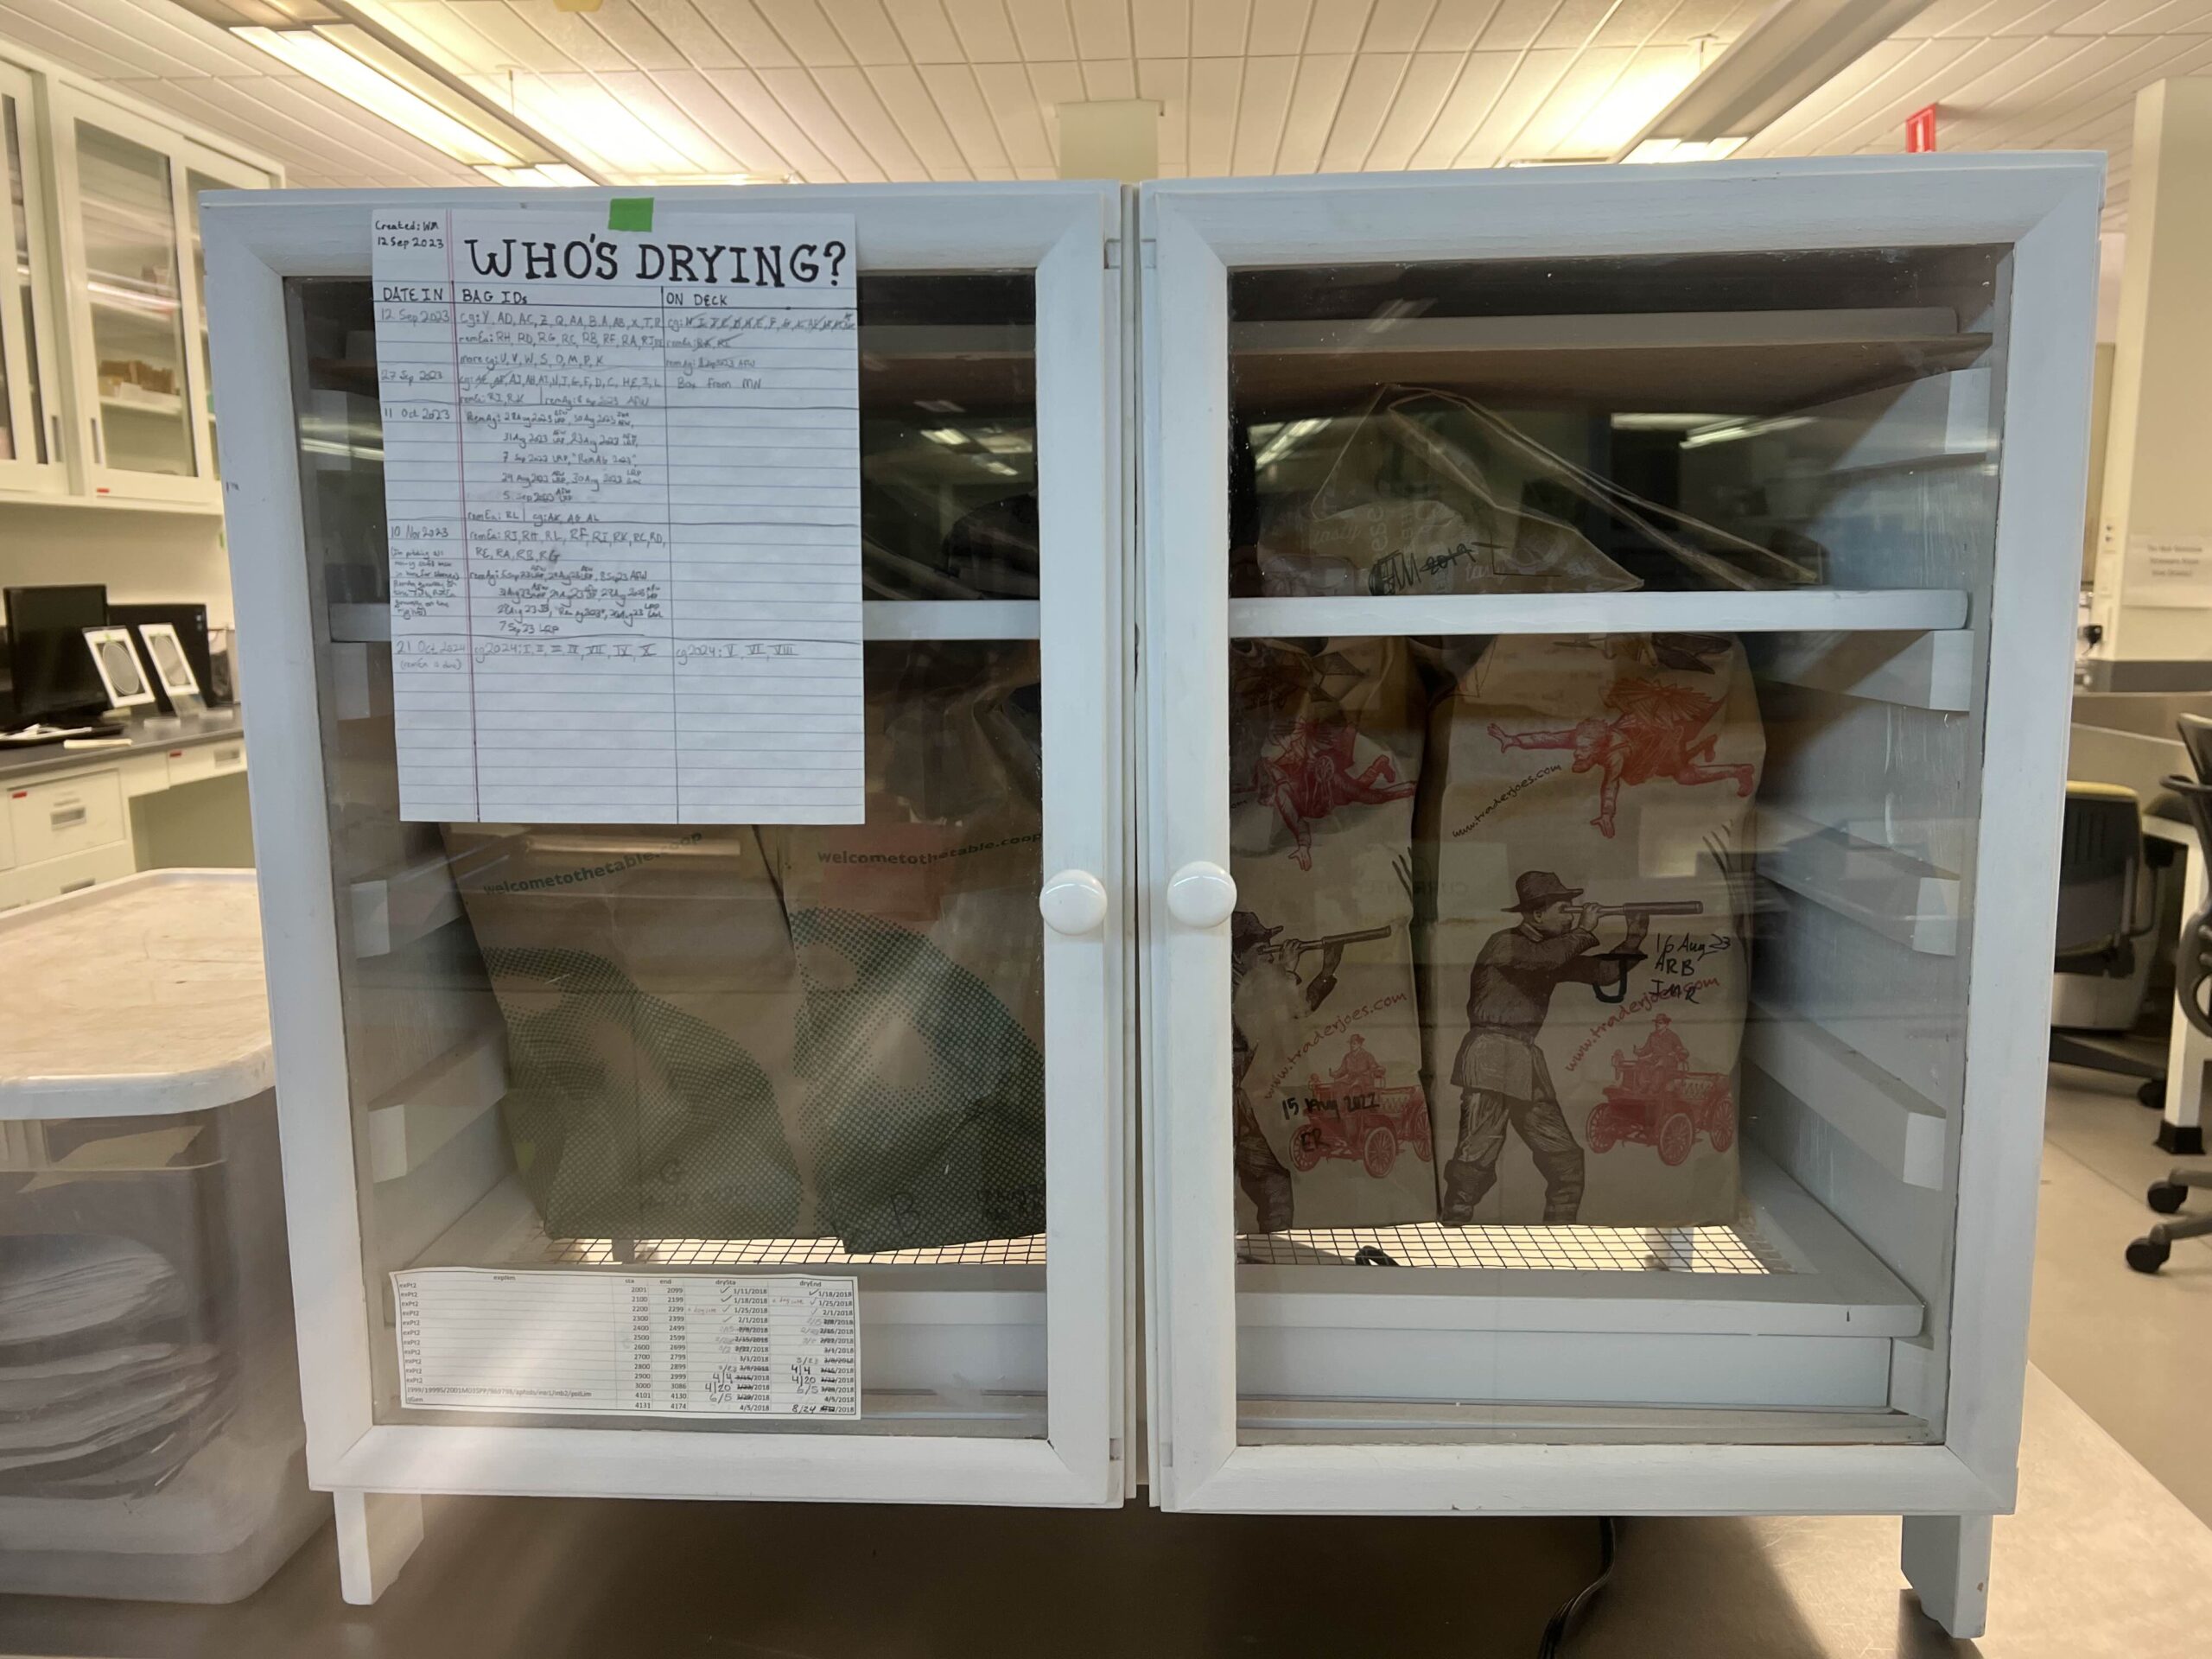
cg heads in the seed dryer prior to going through the ace process in the lab. It isn’t every year when almost all of your gBags fit in the seed dryer at once! I bet I could’ve made em all fit if I really squeezed them, but what’s the rush?
We still have a couple of gBags from 2023 to clean, plus 10 from this year. We like keeping our volunteers stocked! We’ll send exPt01 2024 through first, just after the remnant heads. And so the cycle continues!
A close up of an Agapostemon specimen with its tongue sticking out. The current collection of bees. Many more to come!
As of a few weeks ago, Emergence trapping for the ENRTF project is finished! It was a massive endeavor to complete, and I’m thankful for everyone on the team who pitched in. Now that our vials of bugs have been moved from Minnesota to Illinois, it’s time to start going through them to look for bees. It’s smelly work, but also a great opportunity to brush up on taxonomy and identification skills. We’re planning to hire a work-study student to help with pinning and data entry in the next few days. Until then, more for me!
NOTE: Funding for this project was provided by the Minnesota Environment and Natural Resources Trust Fund as recommended by the Legislative-Citizen Commission on Minnesota Resources (LCCMR).
Currently, I’m writing this from my new apartment in Chicago! Classes start next week for me, and I’m moving on to the data management portion of my summer project. This summer, I looked at pollen and nectar quantity in Coreopsis palmata (prairie coreopsis) in burned vs. unburned sites. But why does this matter? Pollinators depend on pollen and nectar from flowers to supply the nutrients they need to survive. However, there has yet to be a strong comparison between common Asteraceae plants identifying the quantity and quality of plants that can be shared with land managers to help create more viable resources for pollinators in their prairie restoration efforts. Therefore, I wanted to conduct a study looking at pollen and nectar quantity in common non-Echinacea prairie plants to examine how prescribed fire affects plant resources for pollinators.
The sites I collected data from included Torgeson North and South, Tower and Nice Island, and Yellow Orchid Hill West. Pollen data was collected by selecting three immature florets from three flower heads in a “patch,” defined as five or more stems in one central location. These immature florets will then go through a lab process where they are sliced open and placed into an agar solution, allowing the pollen to float to the top, where it can be counted. Nectar collection was done using microcapillary tubes, where we measured the amount of nectar in each tube in millimeters. The volume of nectar can then be calculated based on the size of the microcapillary tube in relation to the measurement in millimeters obtained from the tube. In total, I had around 75 pollen and nectar measurements. I also collected transect density data for each “patch” that we sampled and mapped them in Avenza for future reference. This allows me to identify and see how dense the populations are within a certain site, and to determine if there is a difference between burned vs. unburned areas.
I was not able to study more than one species this summer, but we shall see what the next summer holds!
NOTE: Funding for this project was provided by the Minnesota Environment and Natural Resources Trust Fund as recommended by the Legislative-Citizen Commission on Minnesota Resources (LCCMR).
Team Echinacea finished Total Demo today! That was a big undertaking. We visited 2640 locations to search for Echinacea plants in our remnant sites. But we’re not done with our remnants yet. Today we started de-mopup or demopup. In the likely event that we missed a few flowering Echinacea, we revisit each site to do a thorough search. I am not sure if we are as thorough as this AI puppy mopping the floor, but we strive to find the Echinacea Plants that no one else will find.