This experiment was designed to study how well adapted Echinacea populations are to their local environments. Amy collected achenes from Echinacea populations in western South Dakota, central South Dakota, and Minnesota, and then sowed seeds from all three sources into experimental plots near each collection site. You can read more about the experiment and see a map of the seed source sites on the background page for this experiment.
This summer, during our annual census of the experimental plots, we found 67 living Echinacea plants in the western South Dakota plot, including 9 flowering plants. We found 116 living plants, including one flowering plant in the Minnesota plot. This was the first flowering plant in the Minnesota plot! (We abandoned the central SD plot after it was inadvertently sprayed in 2009, killing all the Echinacea). For more details and graphs, please read this brief report.
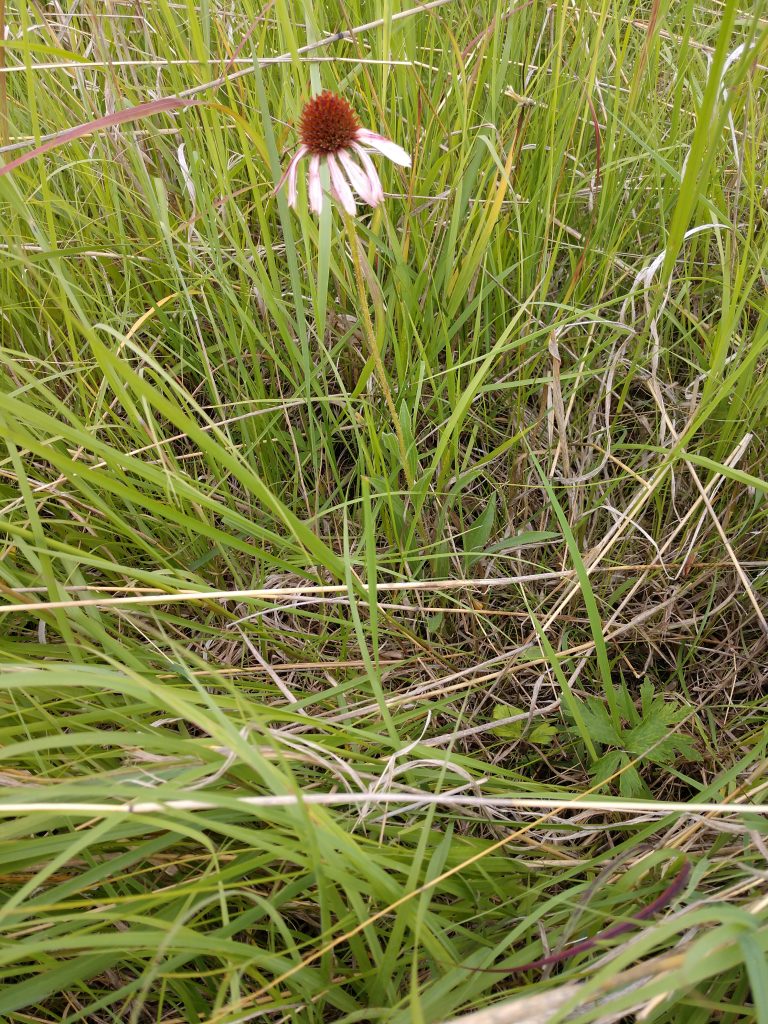
First flowering plant in the MN local adaptation plot!
Start year: 2008
Location: Grand River National Grassland (Western South
Dakota), Samuel H. Ordway Prairie (Central South Dakota), Staffanson Prairie
Preserve (West Central Minnesota), and Hegg Lake WMA (West Central Minnesota).
Data/ materials collected: Plant fitness measurements
(plant status, number of rosettes, number of leaves, and length of longest
leaf), heads from all flowering plants
Products: Dykstra,
A. B. 2013. Seedling recruitment in fragmented populations of Echinacea angustifolia. Ph.D.
Dissertation. University of Minnesota. PDF
This field season the team continued the seedling
recruitment experiment begun in 2007. The original goal of the project was to
determine the rates of establishment and growth of seedlings in remnant
populations of Echinacea angustifolia.
From 2007 to 2013, plants which had flowered in the preceding year were visited
in the spring to find any resulting seedlings. Each fall since then the team
visits the plants, re-finds the seedlings and measures the living offspring.
In 2019 Team Echinacea visited 69 focal maternal plants in
12 prairie remnants to determine the survival and growth of their offspring.
The team searched for 128 of the original 955 seedlings and found 87 of them
(10 fewer than were found in 2018.) However, the team also re-found 27 seedlings
which could not be located in 2018. None of the original seedlings flowered
this year.
In addition to the annual seedling search, in 2019 the team
began working on a project to relate the fitness and mating scene of maternal
plants to their offspring. In late October 2019, Erin and Riley staked to the
locations of 451 maternal plants included in the original experiment which now
have “inactive” circles with no living seedlings. They visited these maternal
plants because they were not included in demo in 2018 or 2019, and their goal
was to determine the status of every original maternal plant. Since then, a
group of Team Echinacea alums and current members has begun working to prepare
the data for analysis in 2020 with the goal of submitting a manuscript in the
spring.
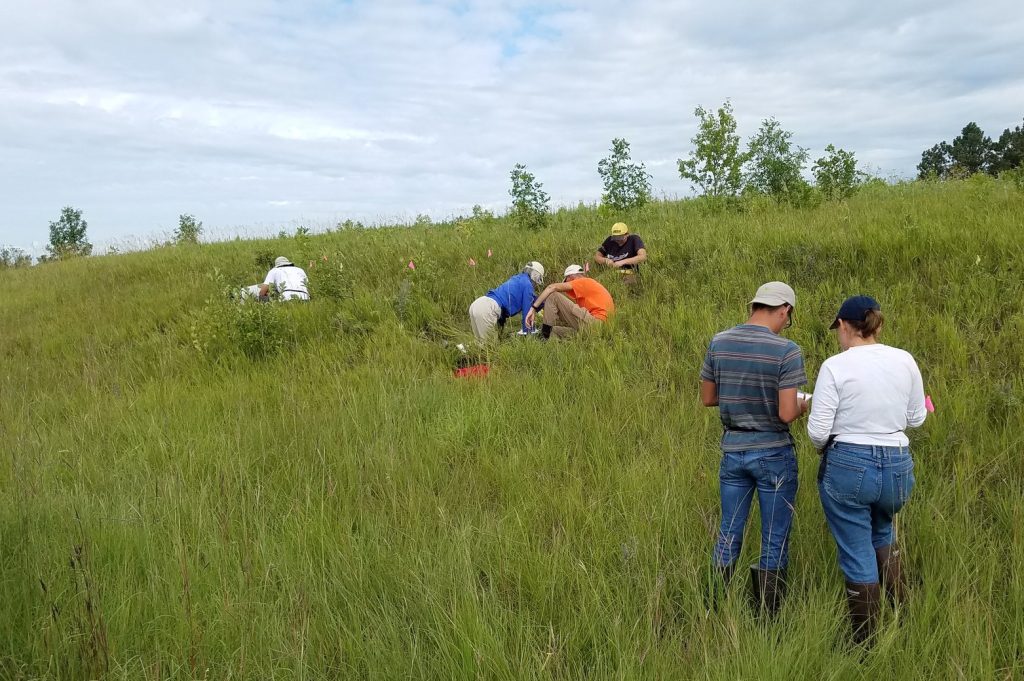
The first day of searching occurred at East Elk Lake Road, where 13 of the original maternal plants still have living offspring.
Sites with seedling searches East Elk Lake Road, East Riley, East of Town Hall, KJ’s, Loeffler’s Corner, Landfill, Nessman, Northwest of Landfill, Riley, Steven’s Approach, South of Golf Course, Staffanson Prairie
Data/materials collected: The EchinaceaSeedlings repository holds the data for this experiment. Lea Richardson restructured the repo in December 2019 to facilitate collaboration on the new project.
Notes on the project and master datasheet scans are at ~Dropbox\remData\115_trackSeedlings\slingRefindsFall2019
Data specific to the new 2019 project, including maps and
datasheets used to refind the inactive circle maternal plants, is at ~Dropbox\slingProject2019
Team members involved
with the 2019 project: Lea Richardson, Erin Eichenberger, Riley Thoen,
Drake Mullett, Amy Waananen, Scott Nordstrom, Will Reed, Amy Dykstra, Gretel
Kiefer , Stuart Wagenius
Products: Amy Dykstra used seedling survival data from 2010 and 2011 to model population growth rates as a part of her dissertation.
You can read more about seedling establishment, as well as links to prior flog entries mentioning the experiment, on the background page for this experiment.
Poor weather conditions delayed demo this year but did not
dampen our spirits! In 2019 Team Echinacea added 4031 visor records to demo and
1431 GPS points to surv. The largest effort this summer occurred at Aanenson
where eight team members took demo records on over 200 flowering plants. We
found flowering plants at Northwest of Landfill with tags from 1995 in situ, meaning the plants were at
least several years older than most of the team. We also found non-angustifolia
Echinacea invading prairie remnants Dog and Yellow Orchid Hill.
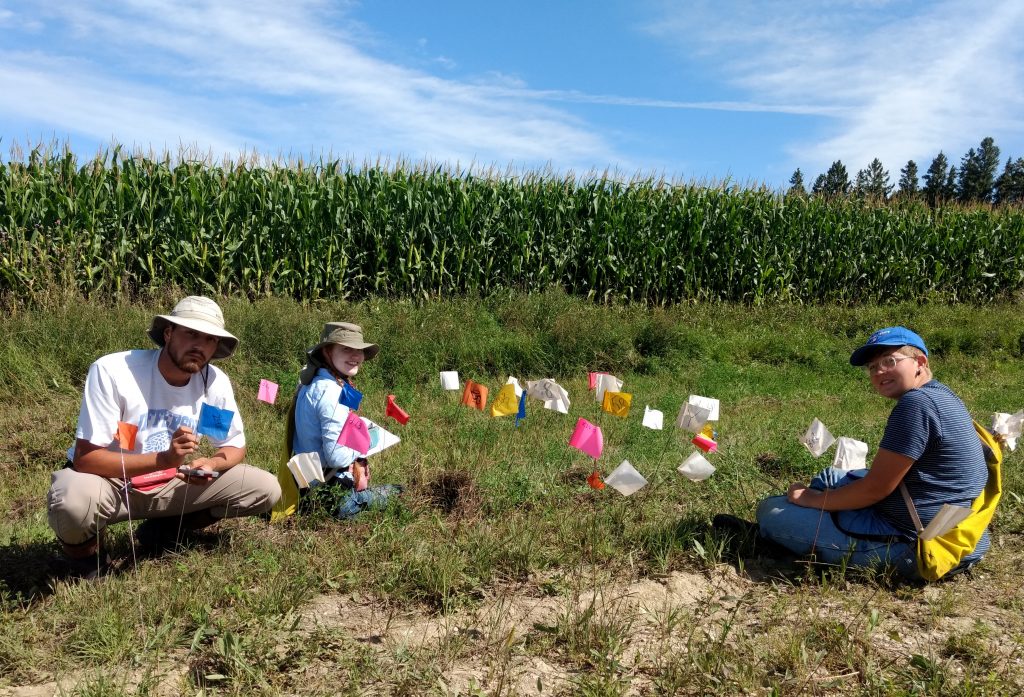
The team does demo at everyone’s favorite site: East Riley! Also known as Whose Loc Is It Anyway? Where the status is “Can’t find” and the GPS points don’t matter.
This year we performed demo and surv at 32 prairie remnants
and 10 additional sites with angustifolia populations. For our smaller sites we
visit every mature plant (ones which have flowered before.) At the larger sites
we measure a subsample of the mature population. At every site we also perform
flowering demo, where we visit plants which flowered for the first time or were
not included in the subsample. We record the status of each plant we visit, its
neighbors and the number of heads it produced. All flowering plants are tagged
and shot in surv, and in the coming months we will use demap to reconcile the
2019 demo and surv records with each other as well as those from previous years
to construct our spatial dataset of reproductive fitness in the tallgrass
prairies of our study area.
Total Demo Bill Thom’s Gate, Common Garden, Dog, East of Town Hall, Golf Course, Hegg Lake, Martinson’s Approach, Nessman, North of Golf Course, REL, RHE, RHP, RHS, RHX, RKE, RKW, Randt, Railroad Crossing Douglas County, South of Golf Course, Sign, Town Hall, Tower, Transplant Plot, West of Aanenson, Woody’s, Yellow Orchid Hill
Annual Sample Aanenson, Around Landfill, East Elk Lake Road, East Riley, KJ’s, Krusmark’s , Loeffler’s Corner, Landfill, North of Railroad Crossing, Norwest of Landfill and North of Northwest of Landfill (lumped,) On 27, Riley, Railroad Crossing, Steven’s Approach, Staffanson Prairie
In addition to the annual collection of data, this year Erin
began developing a study to investigate whether flowering return interval and
isolation by distance are correlated in Echinacea.
Start year: 1995
Location: Unbroken (never tilled) remnant prairies in Douglas County, MN, located along roadsides, nature preserves, railroad right-of-ways and privately-owned land.
Data: Access the most recent copies of allDemoDemo.RData and allSurv.RData at ~Dropbox\demapSupplements\demapInputFiles. Demap accepts these files and the demap team will clean and reconcile them in the demap repository. ~Dropbox\geospatialDataBackup2019 houses the raw GPS jobs while the aiisummer2019 repo houses the raw demo records.
Data related to
the flowering isolation study can be found in the floiso repository (contact
Erin Eichenberger for access) and in the folder ~Dropbox\floweringIsolation2019
Products: Amy Dykstra’s dissertation included matrix projection modeling using demographic data
Project “demap” merges phenological, spatial and demographic data for remnant plants
You can read more about the demographic census in the remnants, as well as links to prior flog entries mentioning the experiment, on the background page for this experiment.
Since 1996, members of Team Echinacea have walked, crawled, and ~sometimes~ run next to rows of Echinacea angustifolia planted in common garden experiments. Although protocol varies depending on the common garden, every year team members record flowering phenology data, measuring data, and harvest the heads of the thousands of plants we have in common garden experiments. The Echinacea Project currently has 10 established experimental plots: exPts1-10. Due to the repetitiveness of yearly phenology, measuring, and harvesting, this project status report will include updates on all common garden experiments except for Amy Dykstra’s plot (exPt3), qgen2qgen3 (exPt8), and the West Central Area common garden (exPt10).
exPt1: Experimental plot 1 was first planted in 1996 (cleverly termed the 1996 cohort), and has been planted numerous times in subsequent years, with the most recent planting being inbreeding 2. It is the largest of the experimental plots, with over 10,000 planted positions; experiments in the plot include testing fitness differences between remnants (1996, 1997, 1999) effects of inbreeding (inb1, inb2), and quantitative genetics experiments (qgen1). There are also a number of smaller experiments in it, including fitness of Hesperostipa spartea, aphid addition/exclusion, and pollen addition/exclusion. In 2019, we visited 4392 of the original 10,622 planted and found 3486 alive. Only 70 plants were classified as “flowering” in exPt1 this year. This is a drastic change from the nearly 1000 plants that flowered in summer 2018 – perhaps it is a testament to the benefits of controlled burning (we burned in spring 2018 but not in 2019). In summer 2019, we harvested 52 total Echinacea heads in exPt1. In the fall, we added 789 staples to positions where plants were gone for three straight years – this was desperately needed because no staples were added to positions with dead plants after 2018.
exPt2: Heritability of flowering time is the name of the game in exPt2. Planted in 2006, exPt2 was planted to assess if flowering start date and duration was heritable in Echinacea. In summer 2019, we visited 2050 positions of the 3961 positions originally planted. We measured 1802 living plants, of which 654 were flowering. In the fall, we harvested ~1100 heads from exPt2. We do not have an exact number of heads harvested from exPt2 yet, as we have not had time to complete head reconciliation. Location: Hegg Lake WMA
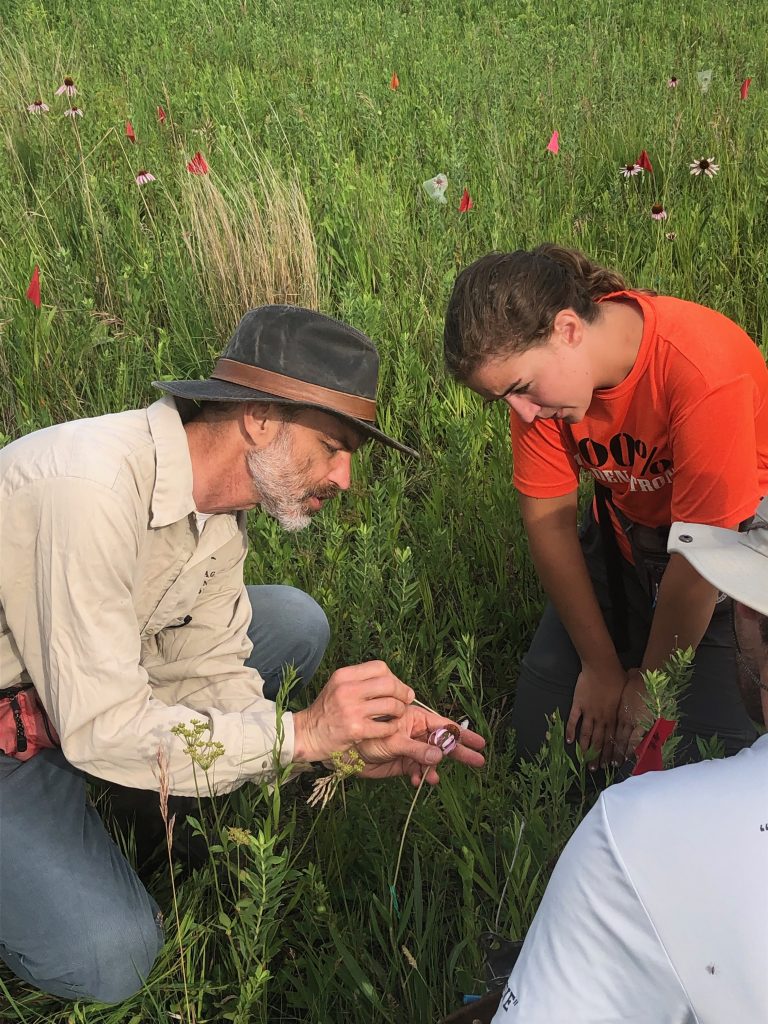
Stuart explains Echinacea capitulum morphology to Shea in one of the experimental plots.
exPt4: Experimental plot 4 was planted to determine if Echinacea from small remnant populations could be genetically rescued via an outcross to larger, more genetically diverse populations. Caroline Ridley and other members of Team Echinacea sowed 3584 achenes at Hegg Lake WMA in 2008, and we have assessed survival and basal plant characters every year since. Survival in exPt4 is incredibly low. We only visited 21 plants in 2019 and only 7 were alive. No plants have flowered in this plot yet. Location: Hegg Lake WMA
exPt5: The only experimental plot planted at Staffanson Prairie Preserve (SPP), exPt5, was planted in an attempt to compare progeny of maternal plants from burned and unburned sections of SPP. There were 2800 plants planted originally, but high mortality made it impossible to visit the plot row-by-row. Now, we and treat the plot like demography. We use a GPS to find plants in exPt5 that have previously flowered and add more plants to the stake file if new plants in the plot flower. In 2019, we visited 10 plants in the plot, all of which were alive! There were no plants flowering in exPt5 in 2019, though. Location: Staffanson Prairie Preserve
exPt6: Experimental plot 6 was the first E. angustifolia x E. pallida hybrid plot planted by Team Echinacea. A total of 66 Echinacea hybrids were originally planted; all have E. angustifolia dams and E. pallida sires. In 2019, we visited 40 positions and found 28 living plants. No plants have flowered in this plot yet. As of January 2020, all exPt6 measure data through summer 2019 is uploaded to the SQL database. Location: near exPt8
exPt7: Planted in 2013, experimental plot 7 was the second E. pallida x E. angustifolia plot. It contains conspecific crosses of each species as well as reciprocal hybrids. There were 294 plants planted. Out of the 205 plants we visited in 2019, we found 161 plants still alive and basal; there were no flowering plants this year. For some context, survival of pure E. angustifolia crosses was lower than all other cross types. As of January 2020, all exPt7 measure data through summer 2019 is uploaded to the SQL database. Location: Hegg Lake WMA
exPt9: Experimental plot 9 is another hybrid plot, but unlike the other two hybrid plots, we do not have a perfect pedigree of the plants. That is because E. angustifolia and E. pallida maternal plants used to generate seedlings for exPt9 were open-pollinated. We need to do paternity analysis to find the true hybrid nature of these crosses (assuming there are any hybrids). There were originally 745 seedlings planted in exPt9, and in 2019 we visited 510 positions. It was one of the harder plots to measure because over half of the positions did not have a plant and we do not use staples at Hegg Lake WMA. We found 308 living plants in 2019, one of which was flowering! We know the flowering plant has an E. pallida mother, but we are still unsure of the paternity of the flowering plant. When we know, we will post an update. As of January 2020, all exPt9 measure data through summer 2019 is uploaded to the SQL database. Location: Hegg Lake WMA
Summer 2019 measures exPt9… so many “Can’t Finds!”
For more information on survival in common garden experiments, see this flog post about survival in common gardens.
Start year: Various, see individual listings above. First ever
planting was 1996.
Location: Various, see above
Overlaps with: Pretty much everything we do
Data/ materials collected:Measure data for
all plots. All raw measure data available in cgData repository. Processed data should
eventually be available in SQL database; ask GK for status of SQL database. GPS
points were shot for the exPt9 flowering plant, as well as for all surviving
plants in exPt4. Find the GPS jobs containing the exPt4 and exPt9 points in
~Dropbox\geospatialDataBackup2019, saved in three formats in
temporaryDarwBackups2019, convertedXML2019 and convertedASVandCSV2019. The job
name is SURV_20191002_DARW and the points have names that distinguish them by
the experimental plot. The stake file to find exPt5 plants is here: ~Dropbox\geospatialDataBackup2019\stakeFiles2019\exPtFiles\exPt05stakeFile.csv
Products: Many publications and independent projects.
During my first week, I have learned how to perform many of the tasks involved in processing specimens and collecting data. I have particularly enjoyed working with the native bee collection. I have assigned SPID numbers and have organized some of the specimens by grouping them together based on size and other qualities such as color and marking patterns. I am beginning to develop an eye for identifying differences between bees and am becoming more familiar with the characteristics of the various genera we are classifying them into. Examining the bees under the microscope has been especially interesting. I have been interested in bees for quite a while but have never had the opportunity to see them in such detail before. The information I already knew about bee morphology became more tangible when I could see the features so closely.
Besides working with the bee collection, I have made progress on rechecking and labeling Echinacea heads. We seemed to be behind on this task, but I have been working through many heads, getting them ready to be scanned so that we can keep them moving through the data processing steps. I plan to continue working on rechecking and labeling this week, as well as randomizing. I also hope to learn several new lab skills and continue to grow my understanding of the research process.
Throughout the summer, I designed and collected
materials to establish an experiment in experimental plot 1 to study parasites
and their impact on the community of host plants they live in. Parasitic plants
are plants which absorb nutrients from neighboring plants. Parasitism is an important
part of nutrient cycling in many ecosystems and parasite scientists hypothesize
it to be an important part of prairie ecosystem maintenance.
This summer I collected seeds from five parasitic
plant species which are native to the prairie. I also collected the seeds of
over 100 species that can be commonly found in Douglas County, Minnesota and I
have begun experimental germination of them and will continue to do so in the
future. I developed a plan to plant Comandra and Pedicularis throughout exPt 1
and establish communities of 40 host species around them to address questions
about the impact native parasitic plants have on plant community members. In
late October I harvested biomass from the proposed parasite planting locations
to understand the species diversity and abundance present before planting.
Start year: 2019
Location: Douglas County, Minnesota; exPt 1
Overlaps with: Experimental plot management, Hesperostipa common garden
experiment
Materials collected: Parasitic plant seeds (Cuscuta
glomerata:18,000 across 6 individuals in 4 locations; Agalinis aspera: ~8,000
across 81 individuals in 3 locations; Agalinis tenuifolia: ~4,500 across
41 individuals in 1 location; Pedicularis canadensis: ~14,000 from 1
location; and Comandra umbellata: ~1,800 from 3 locations) and host
plant seeds (500+ seeds per host species, numbering approximately 100 species).
Seeds are stored at the Chicago Botanic Garden.
Additionally, 216 .1 x 1m strips of dried biomass are
stored at the Chicago Botanic Garden.
Data collected: Find data related to this project
including the proposed planting scheme in the cgdata repository in
~cgdata\summer2019\Hemiparasites
The diversity and abundance of bees native to the tallgrass
prairies of Minnesota are declining; one potential reason is changes in how
land is used and managed. Native bees provide vital pollination services to our
native prairie plants as well as agricultural crops. It is important to
understand the factors involved in the decline of pollinators so they can be
combatted and our plants be protected. In summer 2019, the focus of the
Pollinators on Roadsides project was to collect bees using yellow pan traps and
to take into account the burn history of the collection sites. We investigated
the burn history of the collection sites to compare the bee collections from
the last three years and determine if there is a relationship between burning
and pollinator community composition. Thanks to local government records,
inquiry with private land owners, and observation of recent burn evidence we discovered
which of the 38 sites had a history of prescribed burning.
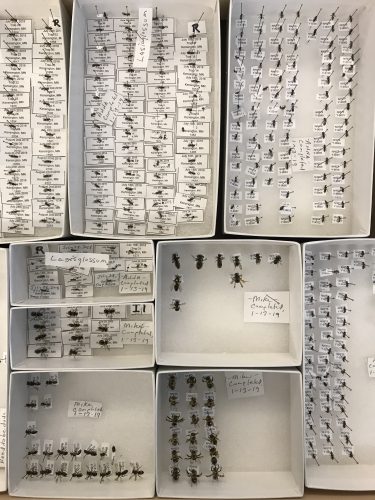
In summer 2019 Shea Issendorf and John Van Kampen collected a
total of 422 bees from 38 yellow pan traps placed six times throughout the
field season (June 28, July 11, July 18, July 31, August 8 and August 19). Trap
locations include different land types such as agriculture, restored prairie
and developed land. We determined the burn history of the trap locations in the
last three years (2019, 2018 and 2017,) and whether the burns occurred in the
spring, fall or both. We stored the bees in in vials of ethanol in freezers
until they were pinned by Shea Issendorf and Mike Humphrey. We found that a
lunchbox with ice packs could comfortably hold all the vials from a collection
date for transportation from the field to the CBG.
The design and goal of this experiment is based on the original 2004 experiment by Wagenius and Lyon. They studied the relationship between characteristics of land and the abundance and diversity of pollinators. Using the data that came out of 2004, the reboot in 2017, and the continuation throughout 2018 and 2019, we observe how pollinator abundance and diversity has changed. With this valuable evidence of declining native pollinator communities, there is opportunity to change the way in which natural lands are used and how surrounding lands are treated (such as through burning, herbicide application and fragmentation).
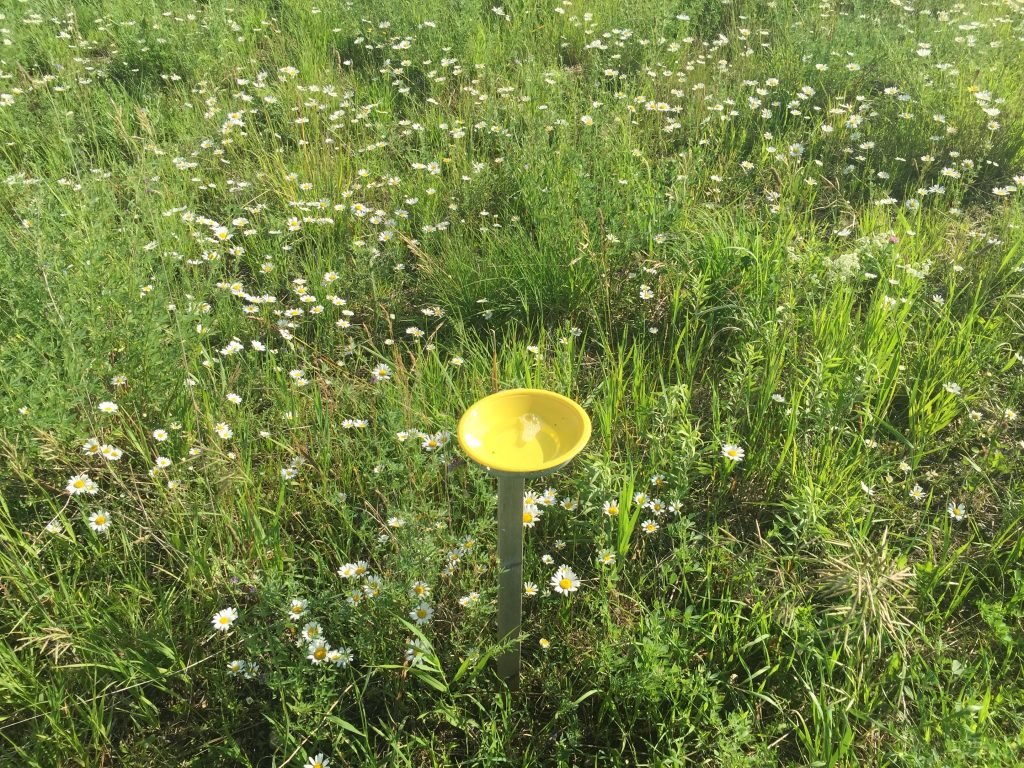
Yellow pan traps resemble the yellow flowers of the Asteraceae family that native bees are attracted to.
Start Year: 2004, rebooted 2017
Location: Roadsides/ditches
around Solem Township. GPS coordinates for each trap are in a Google Map which
Stuart Wagenius can share as needed.
Data/Materials
Collected: 386 bee specimens collected; currently dried, pinned and stored
at the Chicago Botanic Garden. Specimens
will be classified by Mike Humphrey before being sent to the University of
Minnesota for further identification
Land uses/7 traps that have burn history
within last 3 years:
~Dropbox\teamEchinacea2019\sheaIssendorf\YPT 2019 Si\YPT
trap land uses 1.xlsx
Other files associated with the project can be found in the
folder
~Dropbox\ypt2004in2017\YPT2019
Team Members involved with this project: Shea Issendorf (2019), Mike Humphrey (2018-2019), John Van Kampen (2018-2019), Kristen Manion (2017-2018), Evan Jackson (2018), Alex Hajek (2017), and Steph Pimm Lyon (2004)
You can read more about pollinators on roadsides, as well as links to prior flog entries mentioning the experiment, on the background page for this experiment.
In the fall of 2018, the Echinacea Project scientists came to West Central Area Schools (WCA) and mapped out twelve plots to transplant E. angustifolia into the following summer. The WCA Environmental Learning Center has 35 acres of restored prairie, making it a perfect place to plant experimental plot 10. During the summer of 2019, Team Echinacea planted over 1400 E. angustifolia seedlings into the 12 subplots. Three plantings were performed: the first was a planting organized by Michael and had offspring from exPt1, the second consisted of plants from Amy W’s gene flow experiment, and the third planting had offspring from the Big Event. All plants originate from Grant or Douglas County, MN. To test how different fire regimes affect fitness in Echinacea, folks from West Central Area will apply a fall burn treatment to four plots, a spring burn treatment to four other plots, and the remaining four plots will not be burned.
The team after planting the original cohort of Echinacea in experimental plot 10. It was a long day!
During science classes with John VanKempen, WCA high school students will assess the effects of differential burning regimes on the fitness of E. angustifolia. For the first time this fall, juniors in VanKempen’s classes used data they collected on plants to answer their own scientific inquiries. Students developed hypotheses, then measured various morphological traits on surviving Echinacea in the 12 plots. The students used the data they collected to create graphs based on their data. VanKempen plans to continually integrate these Echinacea experimental plots into his classroom lessons and hopes other teachers at WCA will utilize the experimental plots for student science projects.
Start
year: 2018
Location: West Central Area High School’s Environmental Learning Center, Barrett, MN.
Data collected: Planting and survival data for seedlings planted in summer 2019. GPS points taken for plots. Planting data is available in the Echinacea Project ~Dropbox/CGData/195_plant/. Contact John VanKempen for survival data taken by his students. GPS points are available here: ~Dropbox\geospatialDataBackup2019\planting2019\nailStakeWCA.csv
Products: High School Posters. Contact John
VanKempen for info.
Echinacea angustifolia is the only species of Echinacea native to Minnesota, but it is not the only Echinacea species that currently inhabits MN. In the Echinacea Project study area, there are actually three different Echinacea species: E. angustifolia, E. pallida, and E. purpurea. Both non-native species were introduced in restorations from seed that was not locally sourced. We know that non-natives hybridize with our native Echinacea, and we fear that introgression with hybrids may result in genetic swamping of E. angustifolia. We want to learn as much as we can about similarities and differences between Echinacea species in MN so we can assess the threat level of non-native Echinacea in Solem Township and take the proper steps to alleviate the potential threat.
There have been reports that ploidy level varies among Echinacea species (McGregor 1968; McKeown 1999). Specifically, E. pallida is reportedly tetraploid (4n) throughout most of its range, while E. angustifolia and E. purpurea are diploid (2n). There are also reports of E. angustifolia in Oklahoma and Texas being tetraploid (this is a different variety of E. angustifolia from the one we study). Nonetheless, we are interested in the ploidy of Echinacea in MN because it affects whether hybrids are able to reproduce. If a diploid mates with a tetraploid, it produces triploid (3n) offspring; triploids are generally not fertile. Thus, ploidy of non-natives greatly affects the ability of non-native Echinacea to genetically swamp E. angustifolia by creating fertile hybrids.
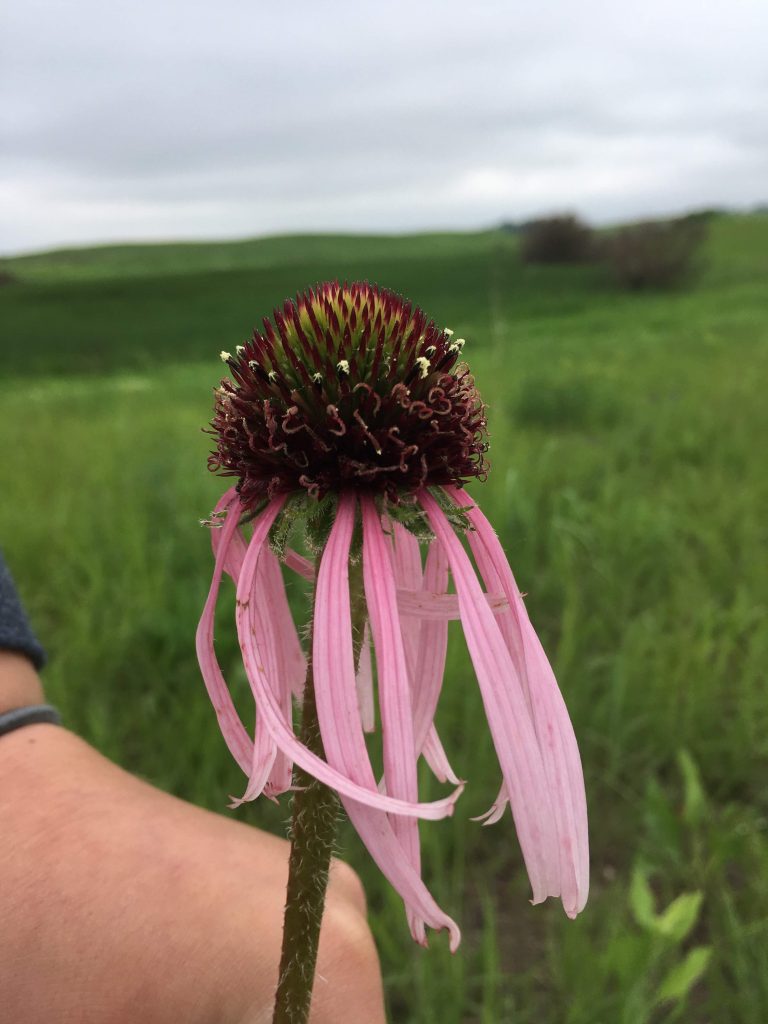
E. pallida head – the flowering heads are distinguishable by pollen color and ray floret color/length.
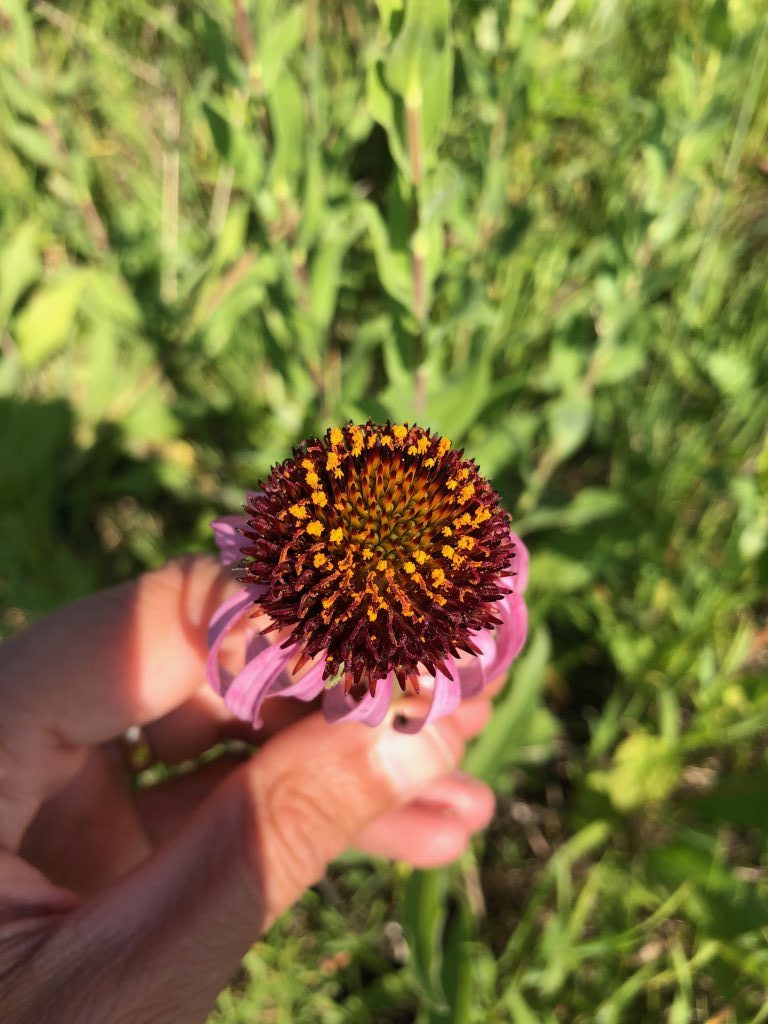
E. angustifolia head
To investigate ploidy differences between Echinacea species in Minnesota, we will collect and dry tissue from the three different Echinacea species and their hybrids and assess relative genome size using a flow cytometer at the Chicago Botanic Garden. We will also assess relative genome size in seedlings grown from seeds sourced from various latitudes in our species’ ranges to see if the individual species vary in ploidy level throughout their range.
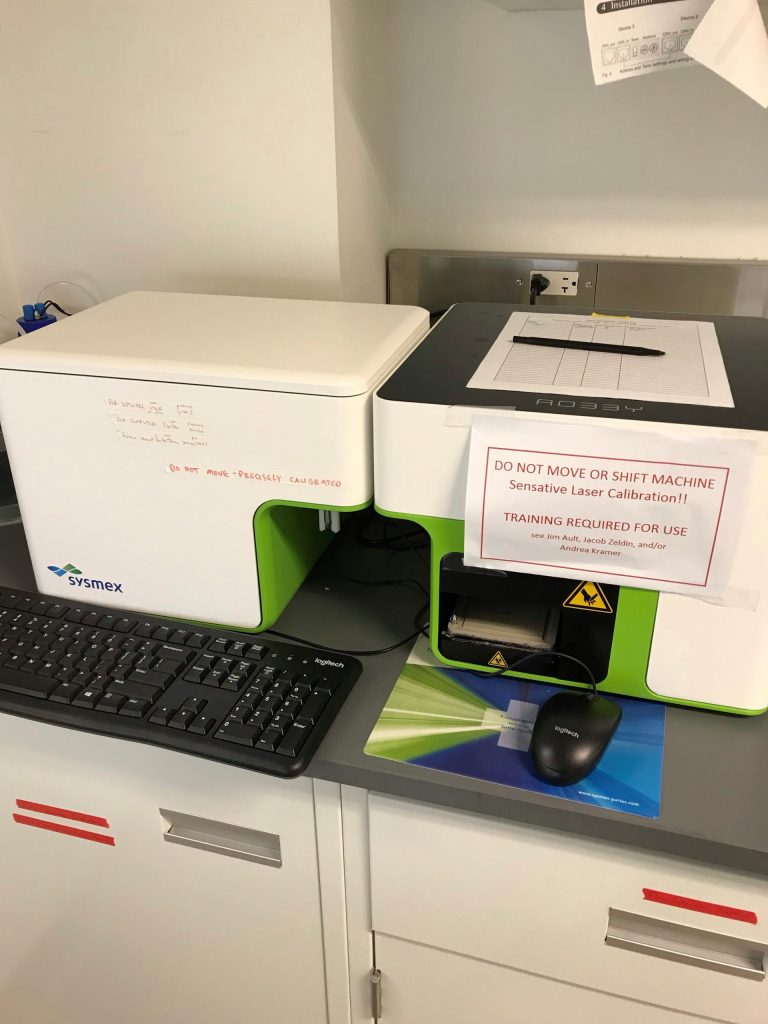
This is the flow cytometer – the machine used to assess relative genome size at the CBG.
On 21 Dec 2019 demap was updated to accept 2019 demography and survey records. In 2019 we took 4031 visor records in demo and 1413 GPS points in surv. The updated infiles are located in ~Dropbox\demapSupplements\demapInputFiles. Demo and surv have not yet been reconciled.
2019 should be the last year we use a GRS-1 machine, as Chekov is set to be decommissioned this spring. Thanks, Chekov! He was truly a key player while Darwin was in surgery for his busted receiver.