|
|
Hello flog!
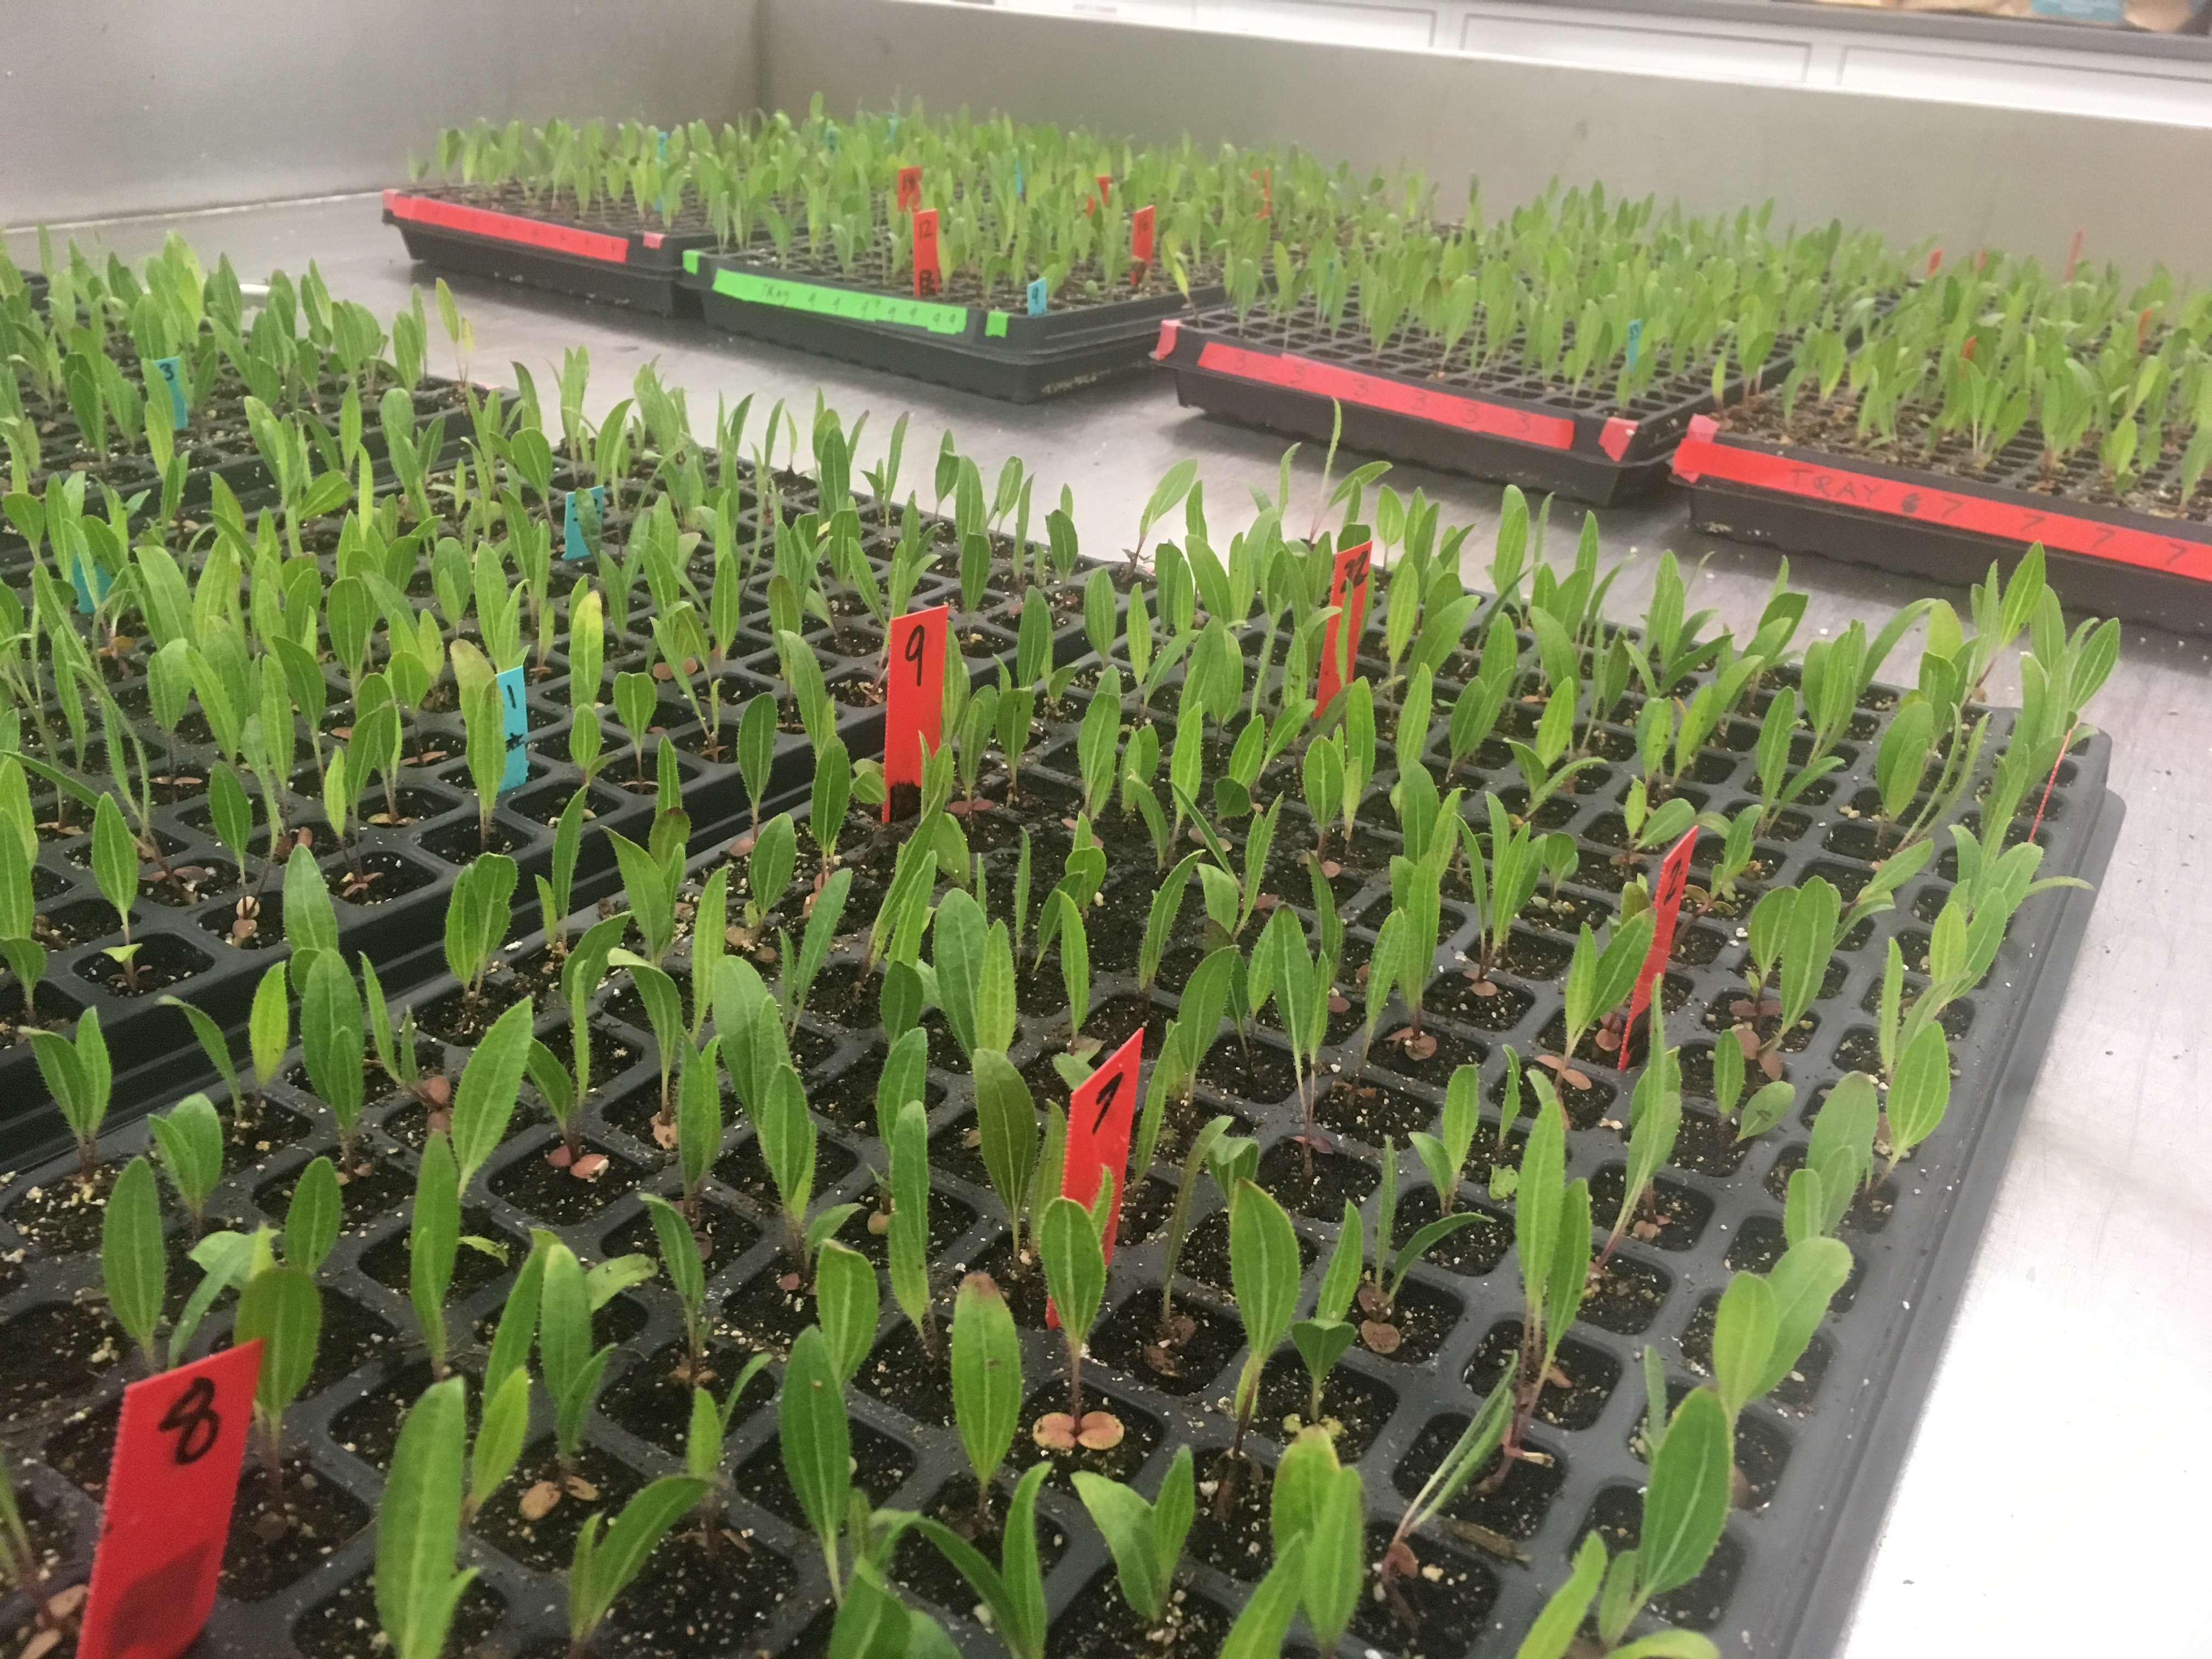
If you’ve been reading carefully, you’ll remember that we planted some seedlings here (at Echinacea Team “West” I guess) about a month and a half ago. Now, those seedlings are growing some big ol’ true leaves, and are almost ready to go in the ground!
 Happy, watered seedlings! We have ~1400 seedlings to plant in Minnesota, and more will be coming for College of Wooster. I’m currently working on putting together the master plan for putting these all in the ground. Watch out for a flog about that, because its going to be one busy, dirty day digging in the prairie
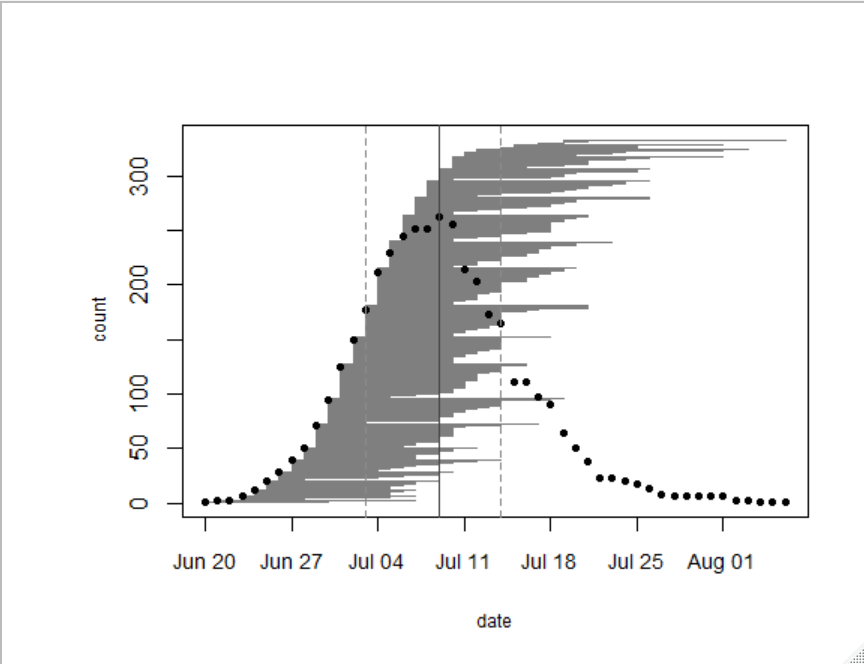
In 2018, we collected data on the timing of flowering in 333 individual plants growing in our naturally occurring prairie remnants: 119 plants at Staffanson Preserve and 214 at others remnants. Flowering began on June 20th – four days earlier than last year. The last date of flowering was on August 9th – the latest bloomer was a roadside plant that had been mowed early in the season but put up another stem later in the season. Peak flowering for the remnants we observed in 2018 was on July 9th, which again was 4 days earlier than 2017. That day there were 257 individuals flowering. The figure below was generated with R package mateable, which was was developed by Team Echinacea to visualize and analyze phenology data. 
From 2014-2016, determining flowering phenology was a major focus of the summer fieldwork, with Team Echinacea tracking phenology in all plants in all of our remnant populations. Stuart began studying phenology in remnant populations in 1996, but he didn’t know that keeping track of the dates was called “phenology.” In following years, several students & interns also studied phenology in certain populations. The motivation behind this study is to understand how timing of flowering affects the reproductive opportunities and fitness of individuals in natural populations.
Start year: 1996
Location: roadsides, railroad rights of way, and nature preserves in and near Solem Township, MN
Overlaps with: Phenology in experimental plots, demography in the remnants, reproductive fitness in remnants
Physical specimens:
- Amy Waananen harvested some heads in fall 2018 and is germinating seeds right now at the U of MN. She is keeping track of which plant (mom) each seedling came from. She aims to use DNA fingerprinting techniques to identify the pollen donor (dad) of each seedling to get a sense of how far pollen moves in fragmented prairie habitat.
Data collected: We identify each plant with a numbered tag affixed to the base and give each head a colored twist tie, so that each head has a unique tag/twist-tie combination, or “head ID”, under which we store all phenology data. We monitor the flowering status of all flowering plants in the remnants, visiting at least once every three days (usually every two days) until all heads were done flowering to obtain start and end dates of flowering. We managed the data in the R project ‘aiisummer2018′ and will add it to the database of previous years’ remnant phenology records. Ask Amy Waananen for more specific data regarding phenology in the 2017 and 2018 seasons.
GPS points shot: We shot GPS points at all of the plants we monitored. The locations of plants this year will be aligned with previously recorded locations, and each will be given a unique identifier (‘AKA’). We will link this year’s phenology and survey records via the headID to AKA table. Ask Amy Waananen for more specific data regarding phenology in the 2017 and 2018 seasons.
You can find more information about phenology in the remnants and links to previous flog posts regarding this experiment at the background page for the experiment.
 A pallida head. Notice the white pollen, which is the only 100% sure way you can be sure a head is pallida and not angustifolia Echinacea pallida is an Echinacea species that is not native to Minnesota, but instead ranges East of the range of E angustifolia (and SE of our research site). In the summer of 2018, we identified 96 flowering E. pallida plants with over 200 heads that were planted in a restoration at Hegg Lake WMA. Every year for the past several years, we have visited the E. pallida plants, taken phenology data, and chopped off their heads. We do this to prevent E. pallida from being a bad pollen source or sink for native E. angustifolia populations. We were able to do this early this year, as E. pallida flowers significantly earlier than E. angustifolia.
We went back to check if we missed any heads on in September and found 3. They were done flowering, but hadn’t dropped seeds. We collected those heads, and they are currently stored at CBG. We hope that we might be able to germinate them for tissue. We want to analyze the ploidy of pallida compared to angustifolia. We have sneaking suspicions that pallida may be tetraploid where angustifolia is diploid.
Start year: 2011
Location: Hegg Lake Wildlife Management Area restoration
Overlaps with: Echinacea hybrids (exPt6, exPt7, exPt9), flowering phenology in remnants
Physical specimens: 200+ heads were cut from E. pallida plants and removed then composted. We brought three heads back with us to Chicago Botanic Garden.
Data collected: All pallida data is in demap
GPS points shot: We shot points for all flowering E. pallida plants.
Products: In Fall 2013, Aaron and Grace, externs from Carleton College, investigated hybridization potential by analyzing the phenology and seed set of Echinacea pallida and neighboring Echinacea angustifolia that Dayvis collected in summer 2013. They wrote a report of their study. Pallida counts are being somewhat incorporated into demap.
Previous team members who have worked on this project include: Nicholas Goldsmith (2011), Shona Sanford-Long (2012), Dayvis Blasini (2013), and Cam Shorb (2014)
You can find more information about Echinacea pallida flowering phenology and links to previous flog posts regarding this experiment at the background page for the experiment.
The tallgrass prairie once occupied vast expanses of land across America’s heartland. Today, it is among the most threatened and least protected habitats in the world. Each year, parts of the tallgrass prairie continue to be lost to agriculture and development making the conservation and protection of this system of utmost importance.
Native bees are the most abundant and most important pollinators in the tallgrass prairie. The bees that we study for this project are called solitary bees. They are different from honeybees in that they are native to North America. They are also different from bumblebees (where many genera are native to North America) in that they do not form a colony and build their nests individually.
We know a lot about the kinds of things bees like to eat (pollen and nectar) and their foraging behavior. However, most solitary bees spend the majority of their life in their nests, yet we know so little about what conditions are suitable for them to build their nests. In the tallgrass prairie, over 80% of bees are solitary, ground-nesting bees. We have a lot to learn about the kinds of habitat suitable for them to build their nests in.
We know some things about what ground-nesting bees may like. Evidence suggests they might like sandy soil, bare ground, and well-drained, south-facing slopes. However, we don’t know what bees in the tallgrass prairie may like for their nesting habitat conditions as most of these studies have been done across other ecosystems.
Much of the prairie has been changed from its original condition. We call the history of this condition “land-use history.” I am interested in how the history of the land may determine where bees build their nests in the ground. Some common types of land use history are remnant prairies which are pristine habitats with untilled soil, prairie restorations which are plantings of prairie plants with disturbed soil, and old fields which are fields leftover from agriculture that may have been tilled or grazed.
Using emergence traps, we moved traps everyday for a total of 1,440 across the season. We caught 110 ground-nesting bees in traps across 24 sites this summer. I placed traps at 8 different locations, each with three different land types at each location (remnant prairie, prairie restoration, and old fields). We found that the most bees nest in the prairie (40), while restorations and old fields have the same numbers of nesters (35). While land use is not good at determining bee nests, we did find that the location and land use when combined are both important in determining where bees nests.
I also placed pan traps at all 24 sites and caught 564 bees. Pan traps were colored blue, white, and yellow to attract a diversity of foraging bees at every site. We will use these bees to compare the foraging and nesting communities at each site.
I also measured many microhabitat characteristics of the soil and vegetation at some of the traps. We found that bare ground is a good predictor of where bees build their nests. We also found that the soil texture, especially the amount of silt and sand help determine where bees nest. A diverse plant community with lots of native plants is also a good predictor for bee nests.
We still have a lot more work to do to determine where bees are building their nests. Our next steps are to identify all the bee specimens caught in ground nests and in pan traps. Once specimens are identified, we can learn more about the species specific results for ground nesting bees.
Two of the tents used to capture bees out in the field Start year: 2018
Location: Hegg Lake Wildlife Management Area restoration, Riley, Aanenson, East Elk Lake Road, and other non-project sites
Overlaps with: Pollinators on Roadsides
Physical specimens: 674 bees were brought back to CGB and are currently being pinned and photographed by Mike Humphrey. Soil samples were collected from every location where bees were caught + a random sample from other traps.
GPS points shot: We shot points for all trap locations. Ask/email Kristen for this data.
Products: This work is part of Kristen’s Master’s thesis
Previous team members who have worked on this project include: Anna Vold (2018)
Thanks so much to help from Team Echinacea 2018, especially Anna Vold who helped measure soil texture. Also many thanks to Emily Staufer from Lake Forest College who processed bees from HFW, and Mike Humphrey who has pinned some bees from this project.
Finally, I get to show all of you my poster!
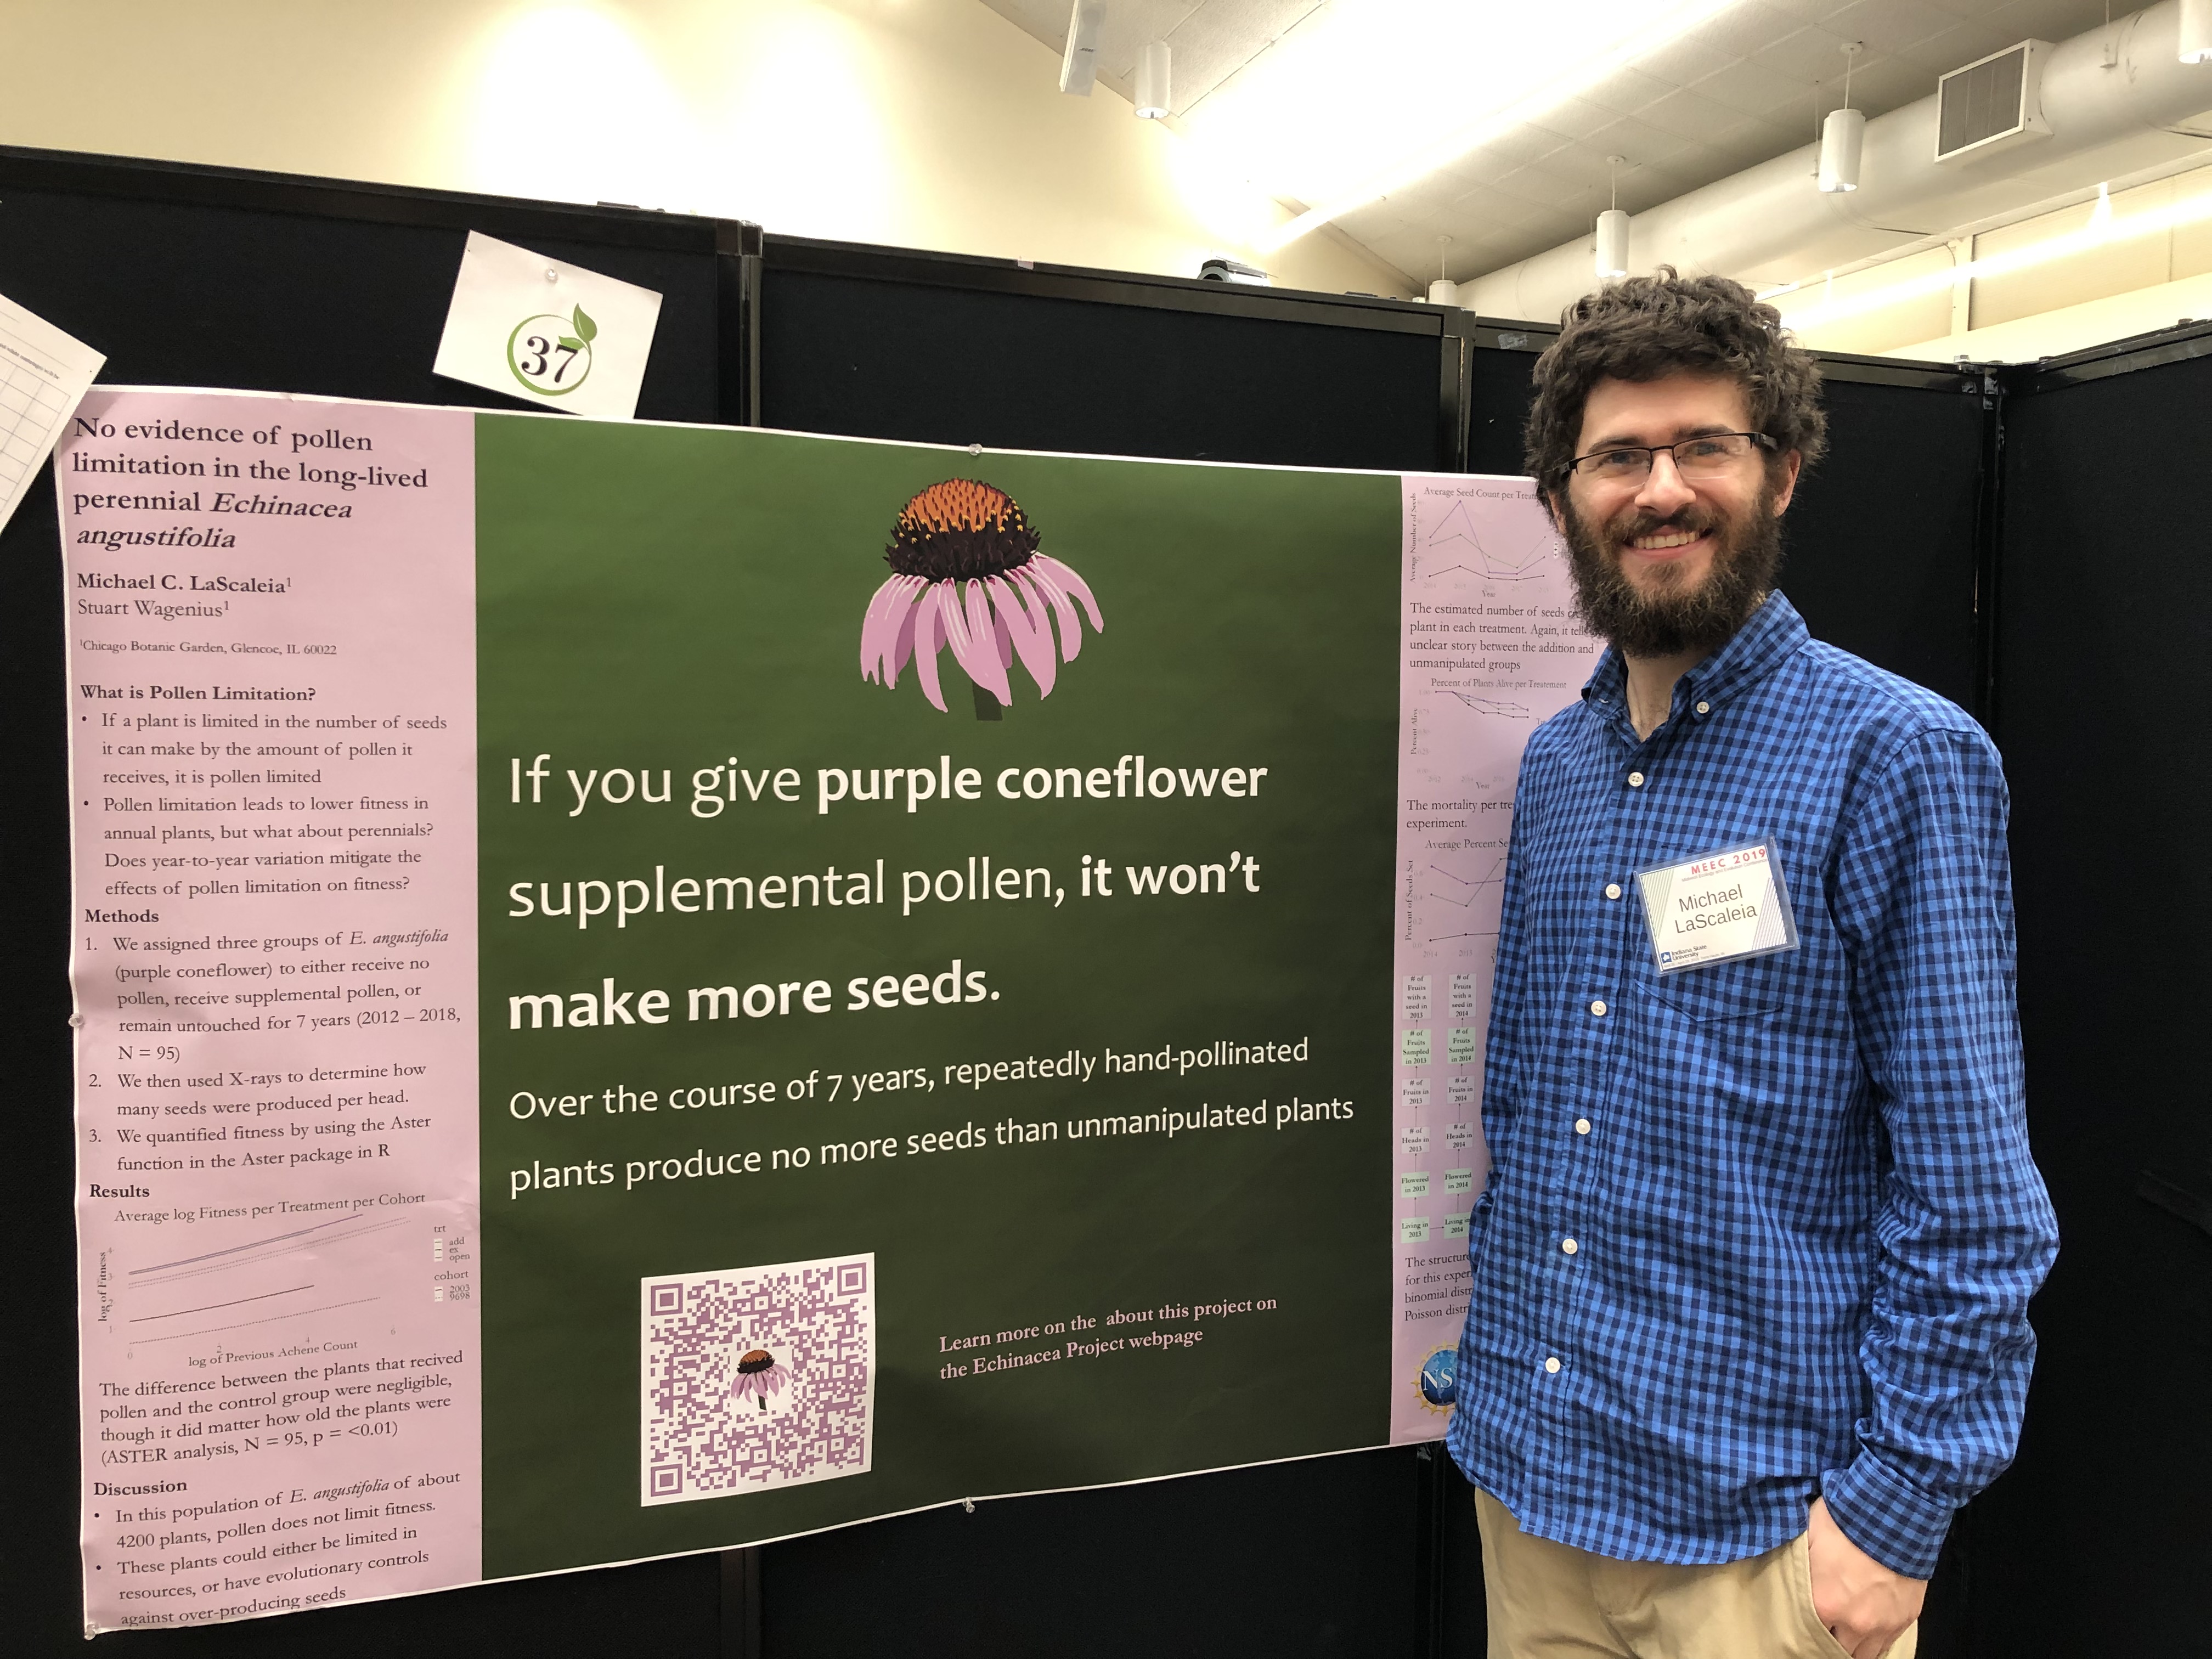
Like Tris, I am also presenting work related to pollen limitation in Echinacea. For my project, I simply tried to find whether pollen limitation is present in Echinacea or not. What I found – it’s not (though, after presenting this poster, there has been some controversy!). It just seems that echinacea produces as much seed as it can up to a certain limit, then stops, regardless of whether more styles were pollinated.
I went a little unorthodox with the way I designed this poster. Instead of the normal “wall of text” design, I instead opted to use the “better poster” design created by Mike Morrison. I really liked using this! It was so incredibly easy to make, and it really facilitated great conversations with everyone who stopped by poster slot #37. I’m very much looking forward to using this poster design each and every time I present from now on.
Michael with his pollen limitation poster Title: No evidence of pollen limitation in the long-lived perennial Echinacea angustifolia
Presented at: MEEC 2019 at Indiana State University in Terre Haute, IN
When: April 27th, 2019
Poster Link: MCL Pollen Limitation MEEC Poster
Welcome back to the next installment on this series of planting seeds for our new experimental plot. If you remember from the last post, I posed the question – do you think that this second planting would have more or fewer seeds than the last one?
More. It was more.
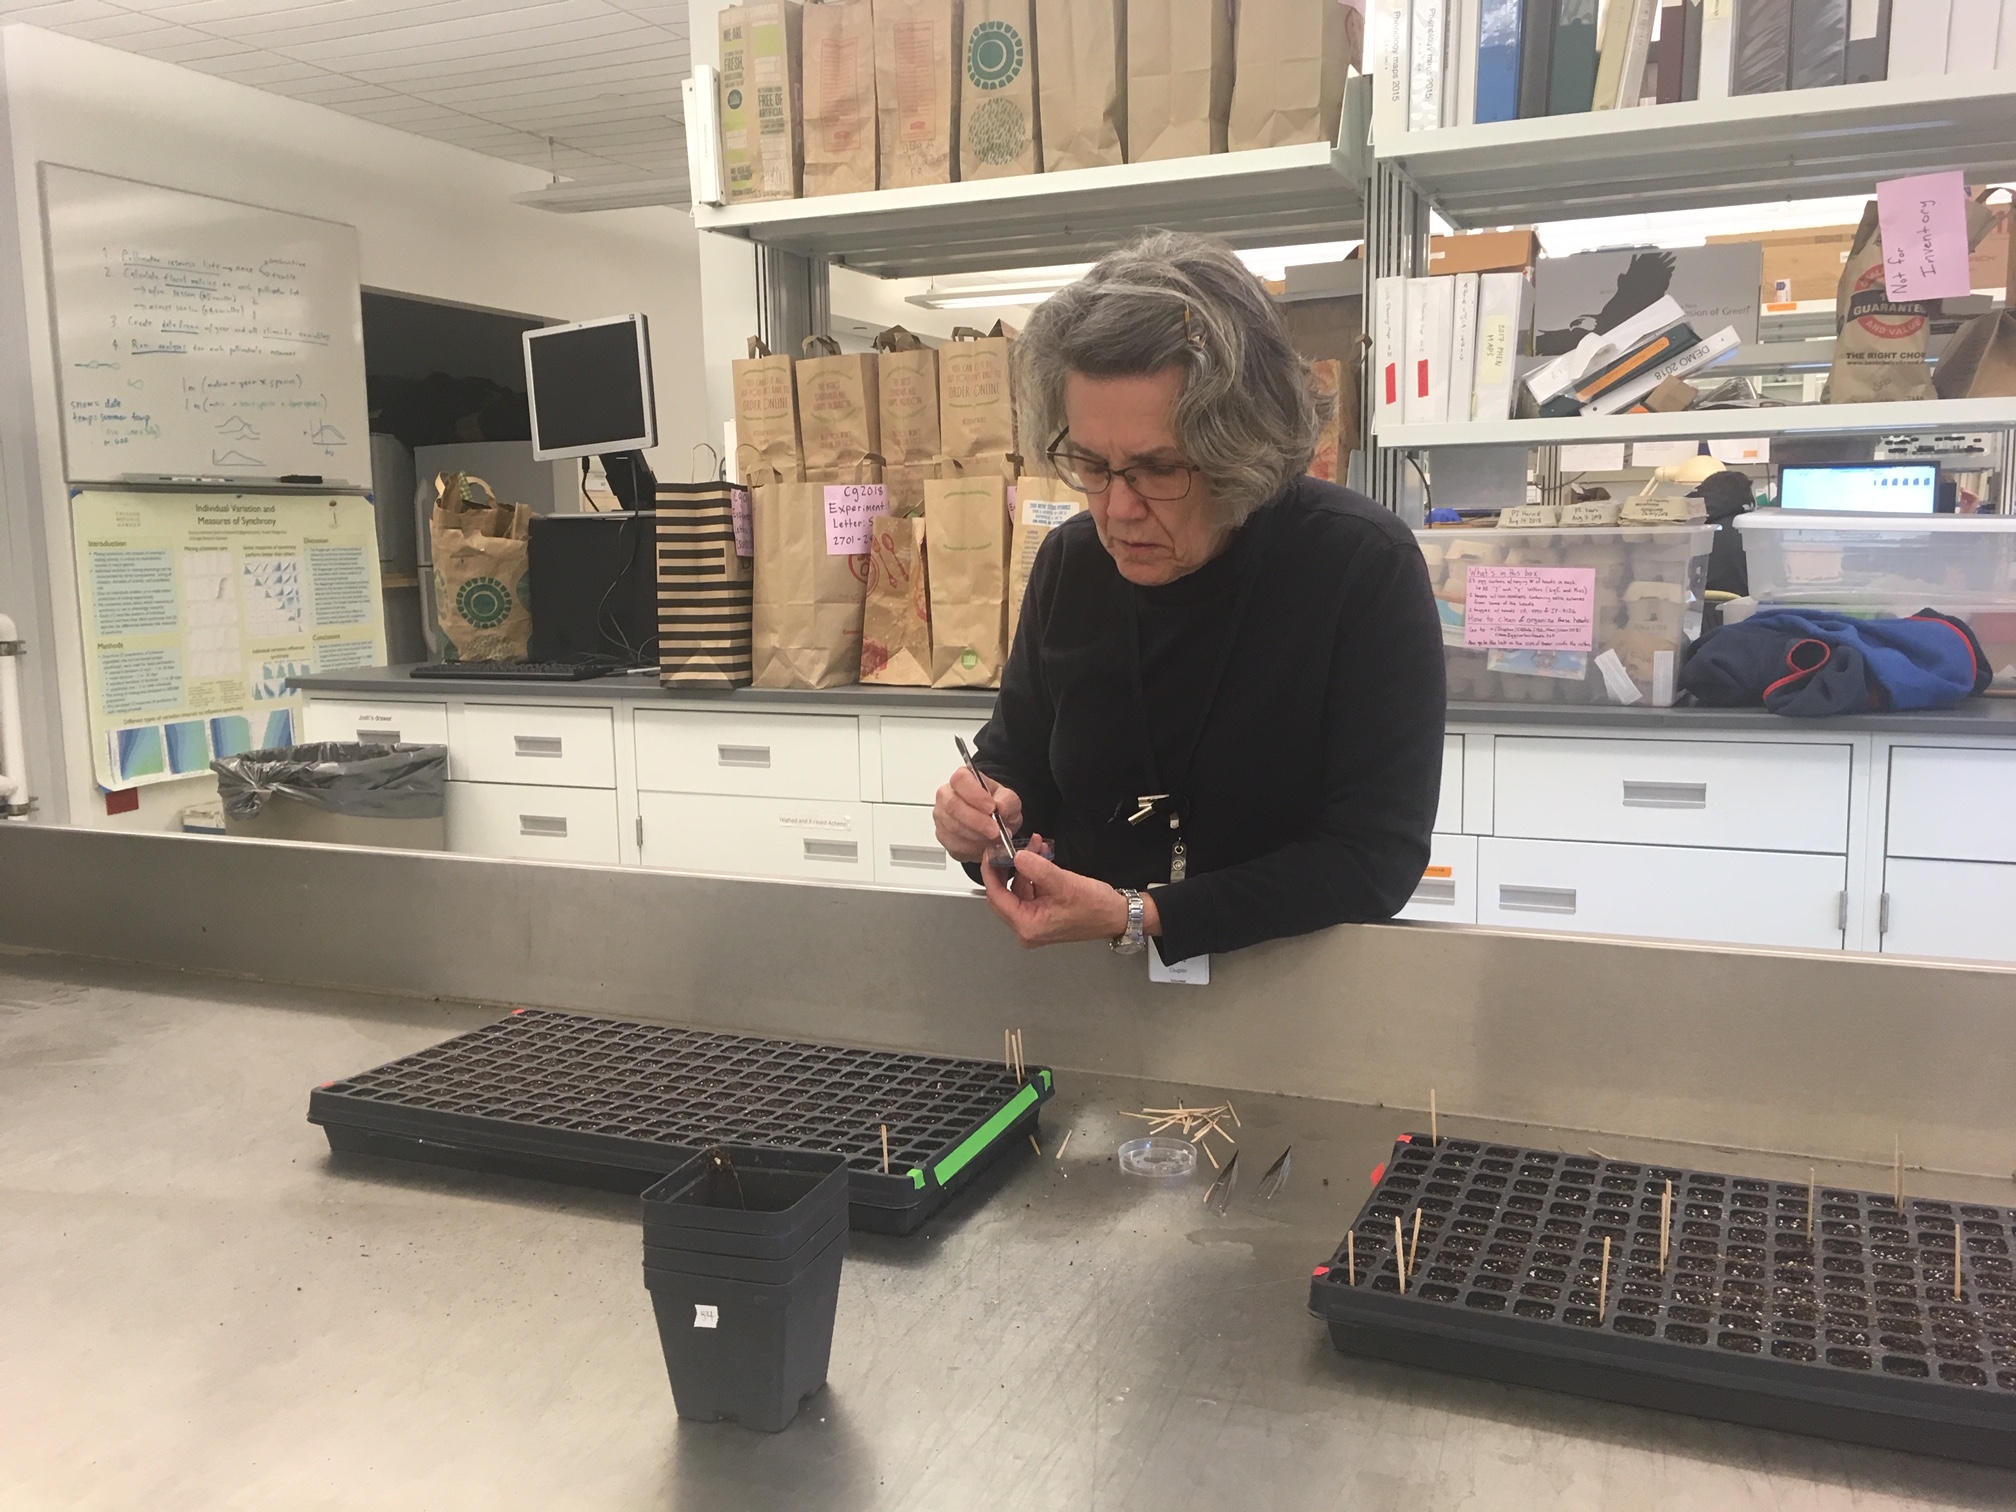
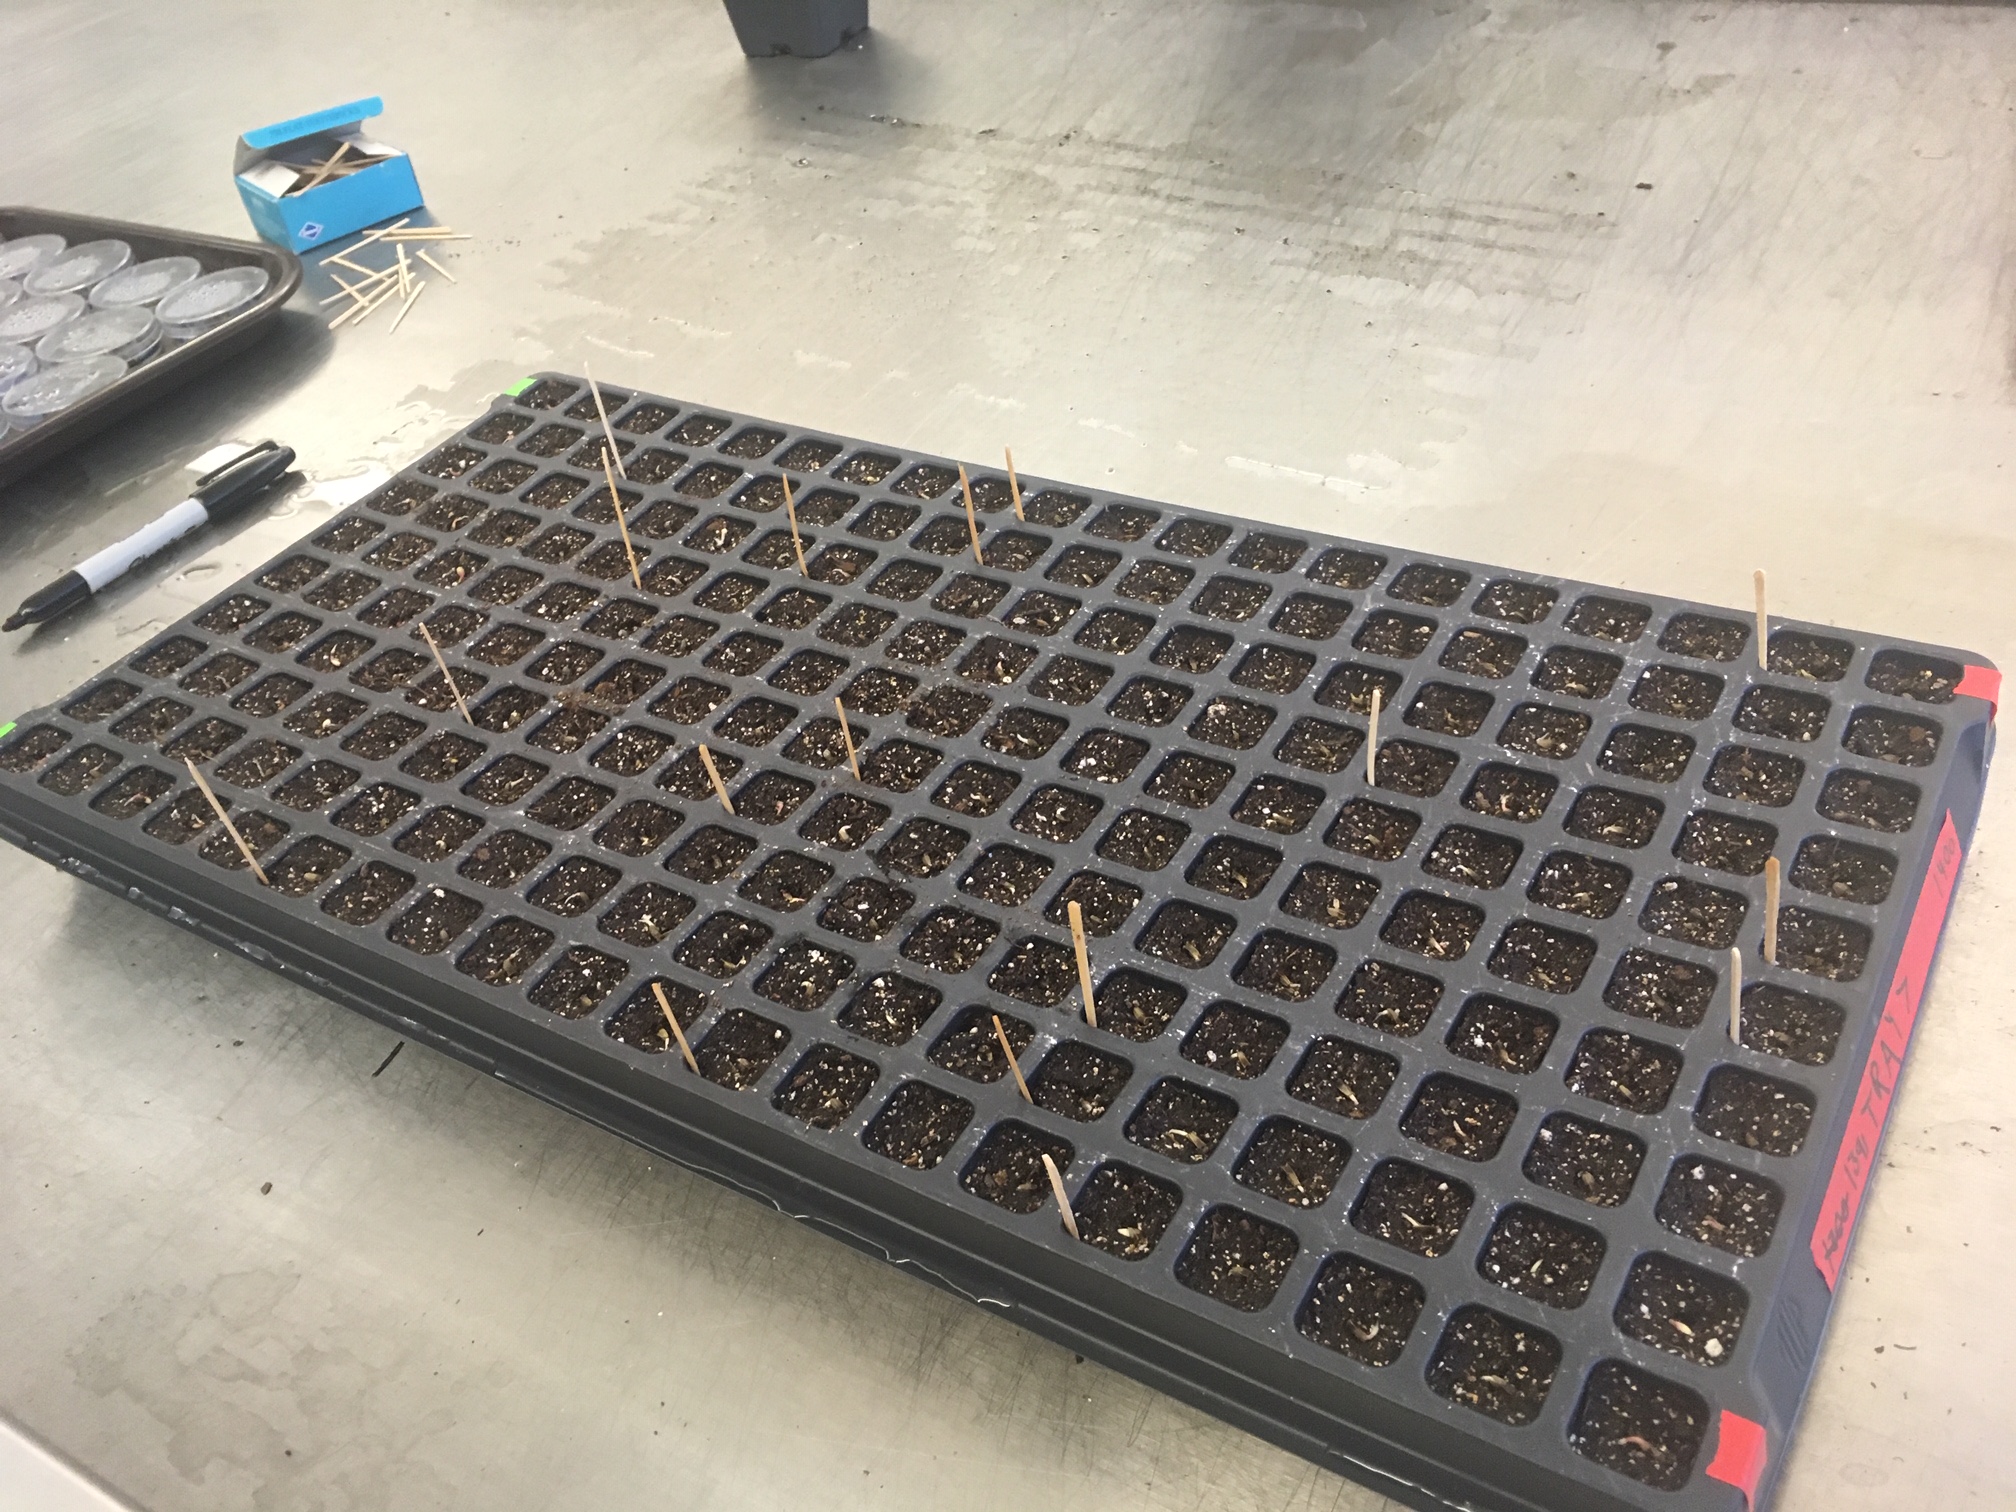
While we planted 800 seeds on Wednesday, on Friday we planted a good 1400 seeds. As you can imagine, this took considerably more time. But luckily, we had even more help! Anne and Priti both came to help with planting. Anne even came up with an ingenious way to use toothpicks to track which head each seed in a plug came from. Now, we have 2200 planted seeds! Seeing as our original goal was 1200 – I’d say that’s not to shabby.
Cotyledons are starting to burst through in our farthest ahead seedling and they are all chugging along at a steady pace. Personally, I love watching these little guys grow and get a lot of satisfaction from knowing that they will grow up to flower some day and be used in experiments for many years to come. That being said, it’s really going to be a monumentous effort to plant all of these guys. Hopefully team echinacea 2019 will be up to the task.
Oh yeah, be on the lookout for bios from Team Echinacea 2019 coming soon!
Anne grabbing a germinated seedling with tweezers Priti selecting seeds to be planted
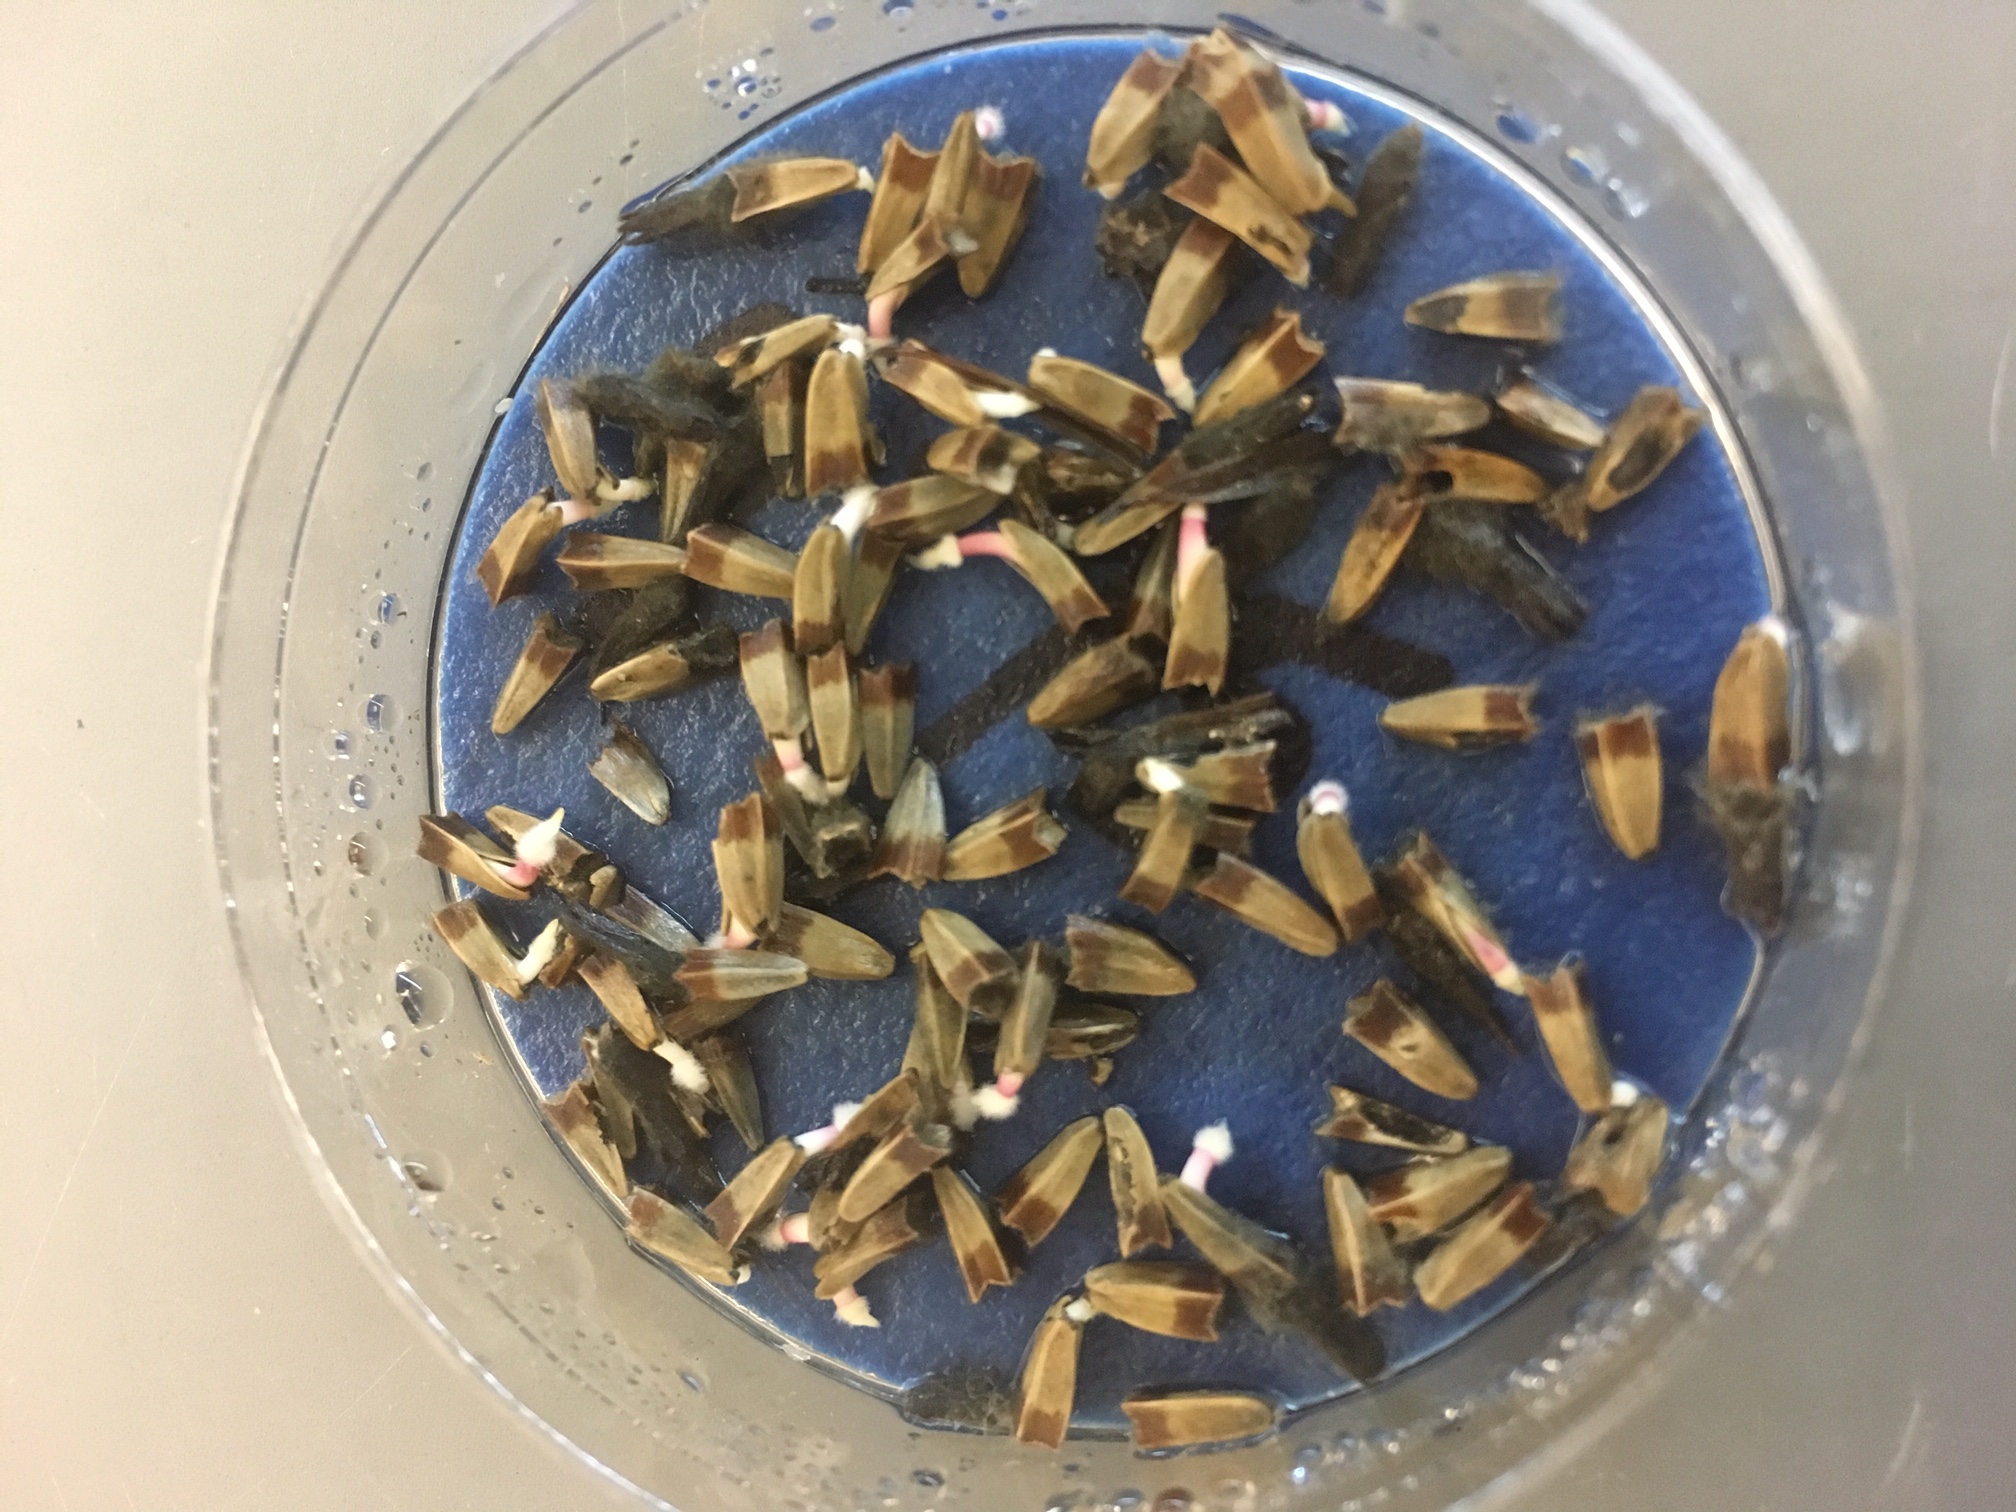
Welcome to germination part two! Here, I’ve got an update to what’s been happening with our seeds! Since the seeds in the petri dishes germinated so well, they have been moved in to plugs. Now, I’ve said “moved into plugs” as if it was a simple scoop and dump of seeds into soil. Wrong!
In our first session, we planted exactly 800 seeds into individual pots in a tray. These are called plugs. I stressed that there were exactly 800 because of two facts that line up perfectly:
- We planted every single seed that we found that had germinated, so if 801 had germinated, we would have planted 801 plugs
- plugs come in trays of 200
So hopefully you can now see why that was so great. No need to start that last pesky tray!
Obviously this was a huge job, and while I certainly planted a lot of the seeds (being on my feet for 5 hours was actually a bit of a relief – I much prefer it to sitting), I also had some help! Kathryn planted about 200 of the seeds in the morning, which was a big help.
We plant again in two days. Will we have more or fewer seeds to plant on that day? Stay tuned in!
A planted tray
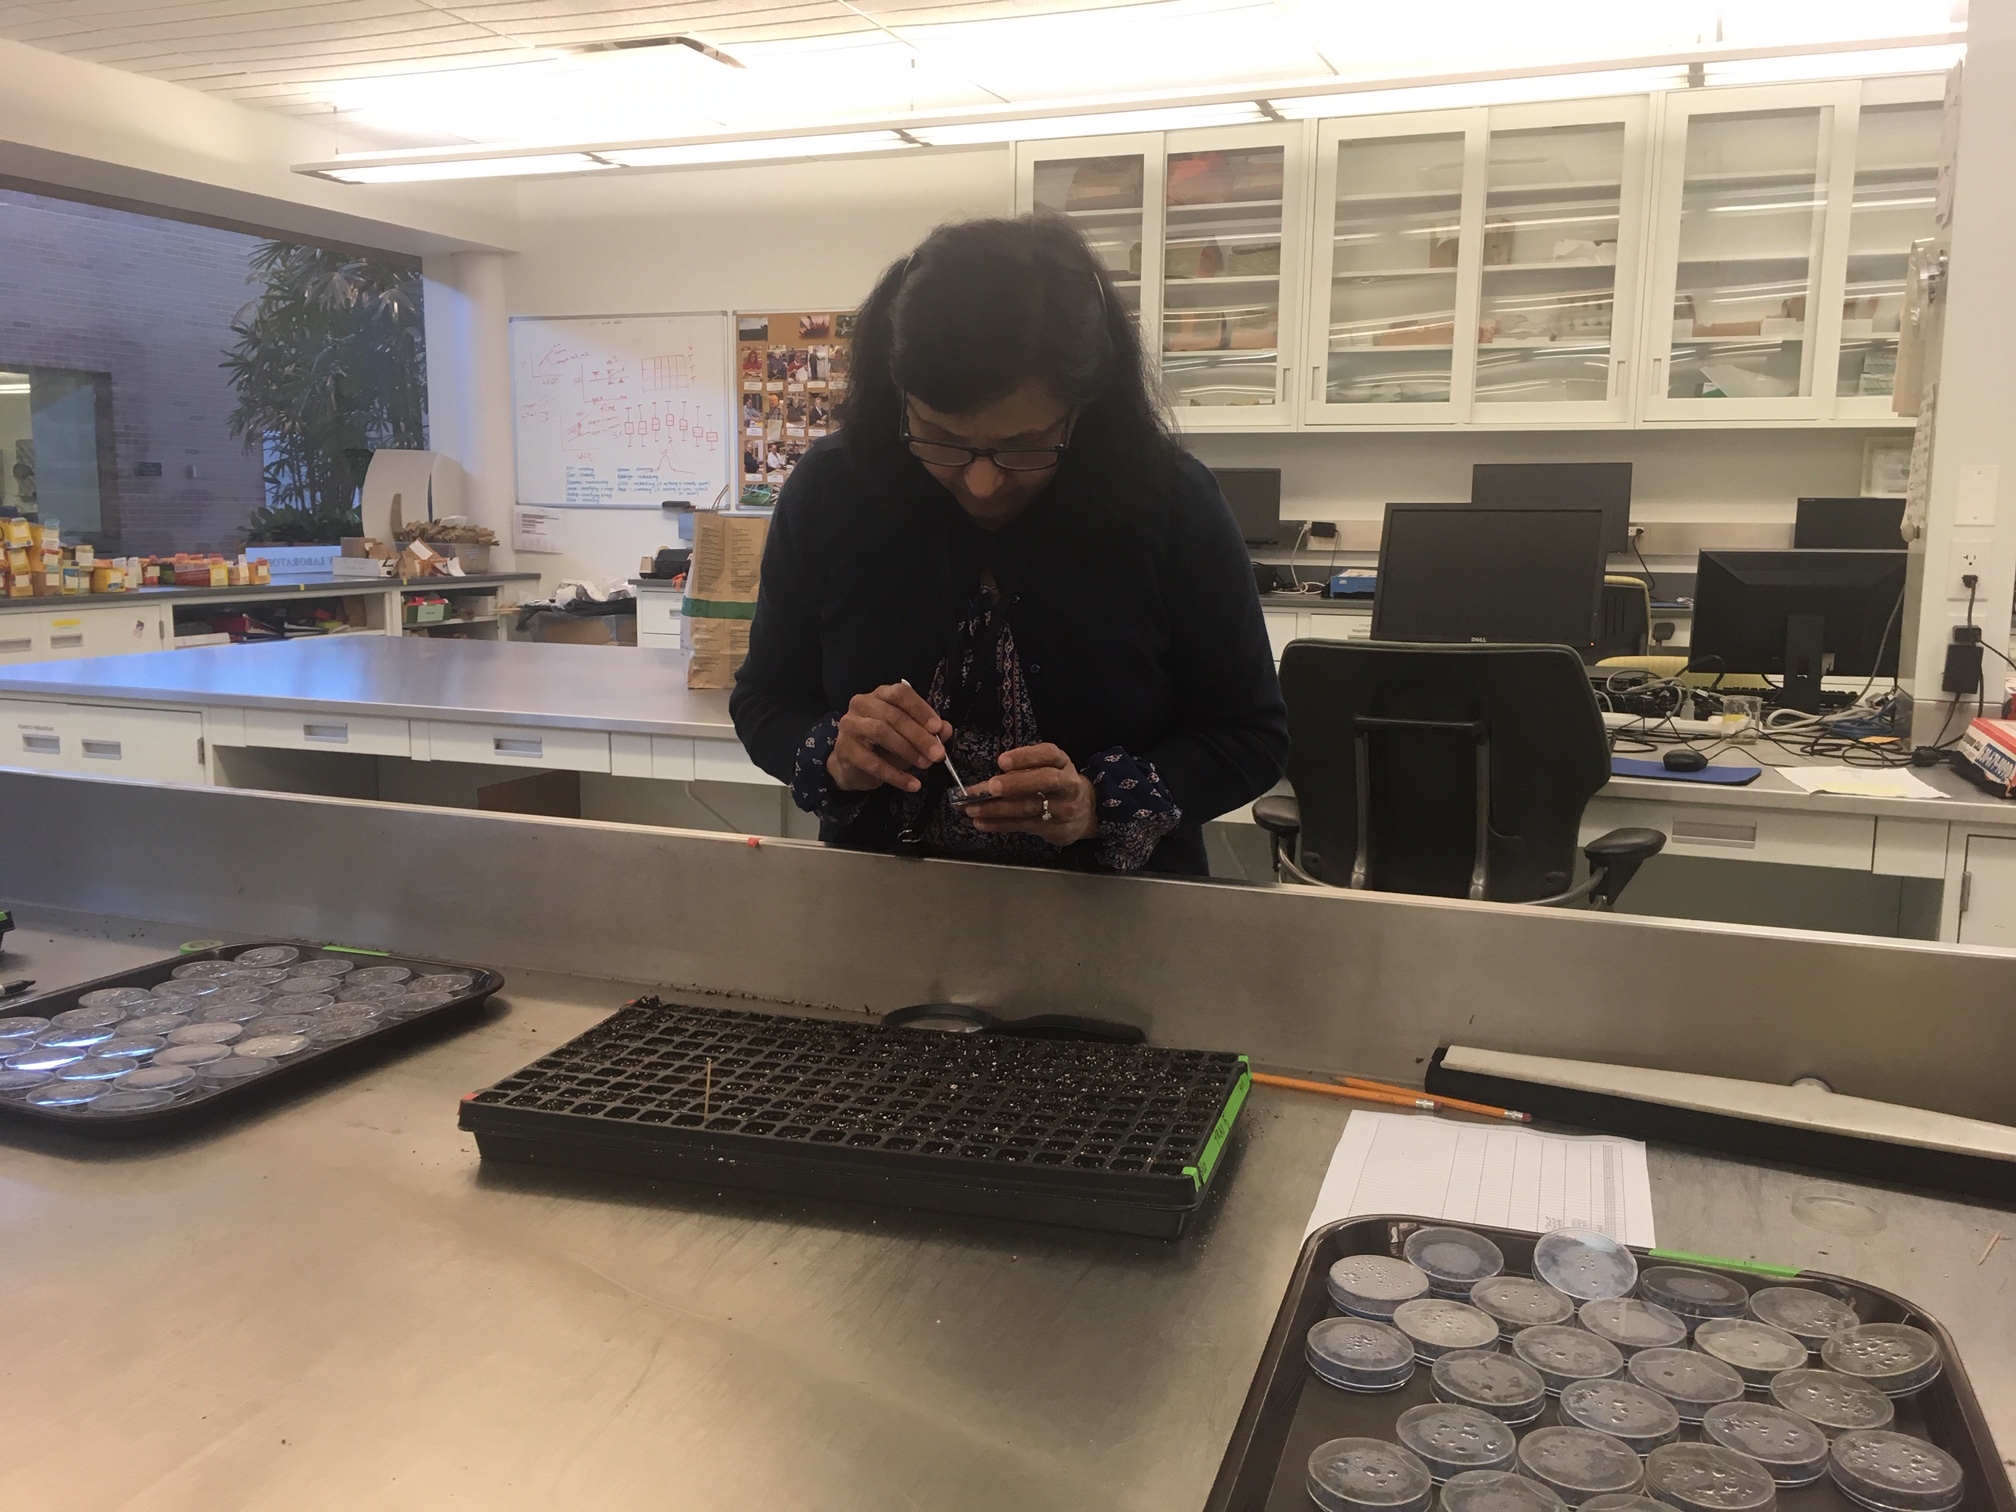
So it’s been a while since there’s been an update from inside the lab, but that certainly doesn’t mean that nothing’s been happening! Over the course of the last several weeks, we’ve been germinating seeds for the West Central Area Secondary School’s new Environmental Learning Center experimental echinacea plot. And I happy to say that we have many, many seedlings to plant!
Radicals galore! I wont spoil quite yet what ends up happening to all these lovely emerged seedlings – you’ll have to wait for a future flog post to see that. What I will say is that once these little guys get going, they can really grow! Look for more flog posts in the future tracking these guys all the way out into the field.
I have to add that after spending many months working with number regarding echinacea plants, it’s very exciting to be working with the plants themselves. Especially new baby plants! If all goes according to plan, many of the seeds you see here have a very long (and very well recorded) life ahead of them. You get to say that you’ve seen them on the day they were born (are plant’s born? That’s a question for another day)
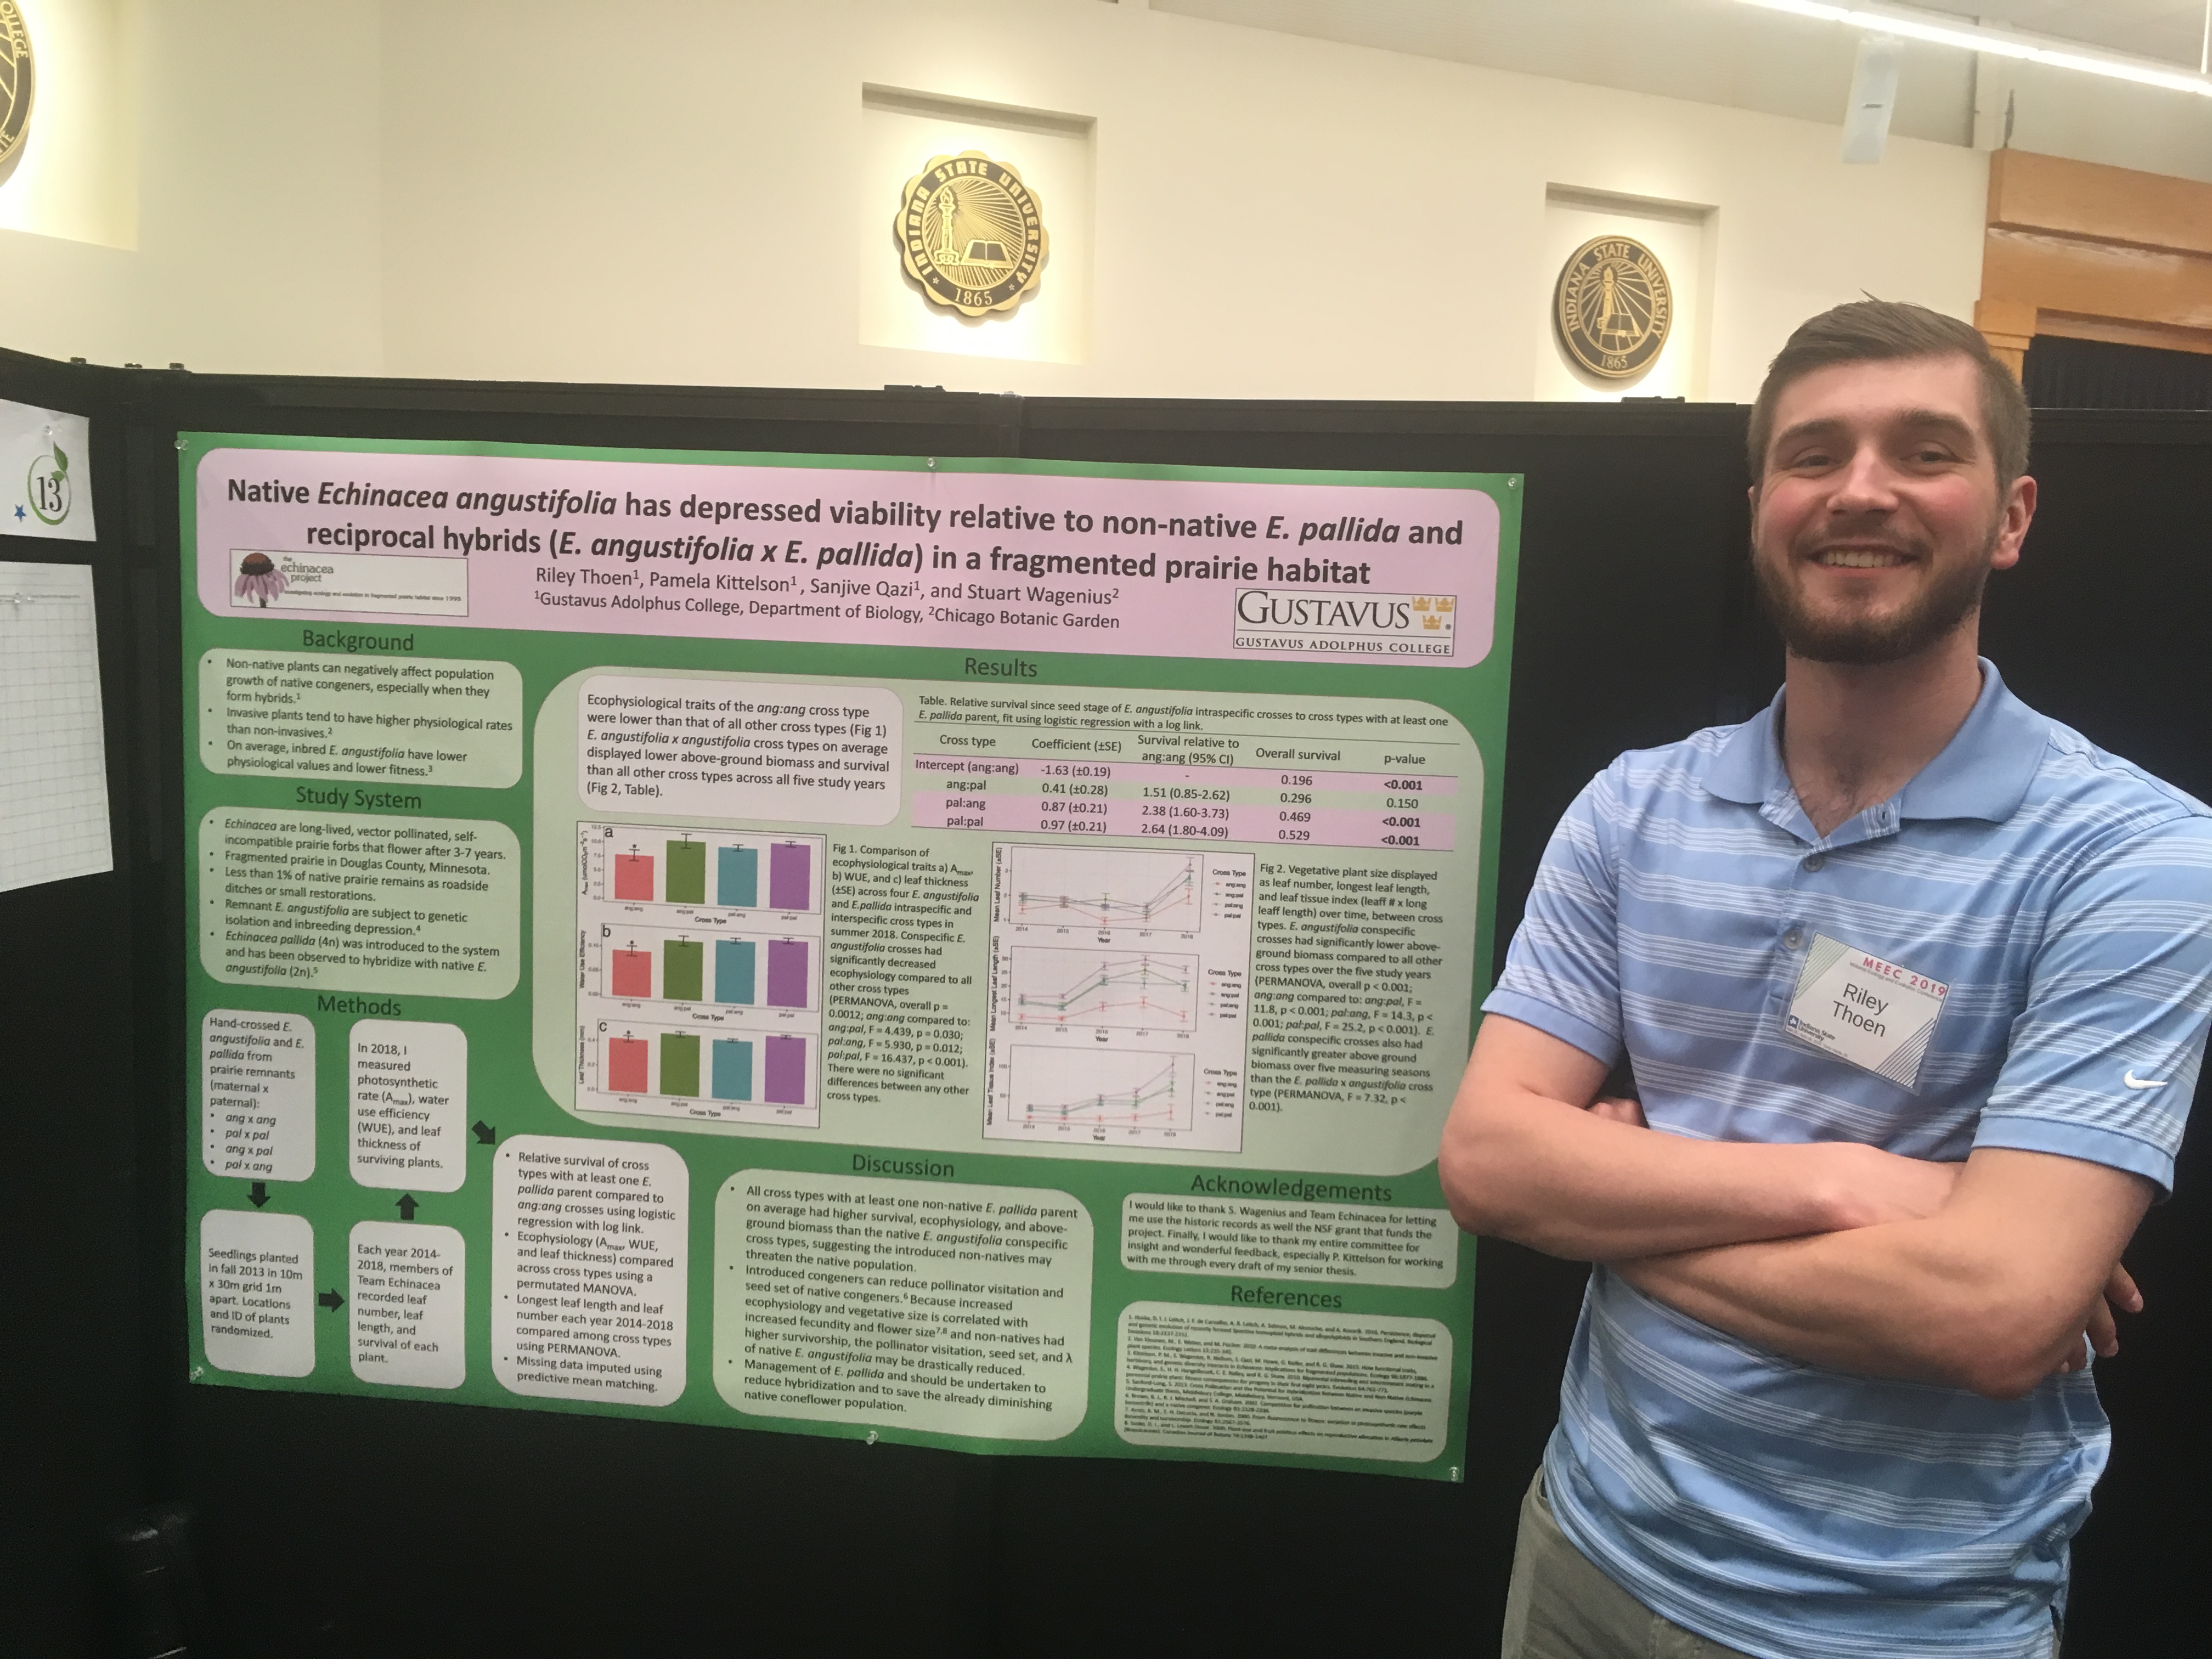
Next up from MEEC we have Riley’s poster about the photosynthetic rates of Hybrid plants in exPt7. Riley collected the data for this project in the summer of 2018, and has been working on aggregating and analyzing since then. The central question behind the research: do Echinacea hybrids between E. angustifolia and E pallida have higher photosynthetic rates than conspecifics?
Riley with his poster Overall (as the title says), Riley found that E. angustifolia may be in trouble if it has to compete with E. pallida. Both the hybrids and conspecific E. pallida plants were more photosynthetically active than E. angustifolia. Additionally, they had higher survival rates. And to put the final nail in the coffin, the only plant that has flowered in exPt7 is an E. pallida plant. All things considered, Riley’s work is crucial to finding out how to protect E. angustifolia from this invasive species!
Click the link bel0w for a full .pdf of Riley’s Poster
echinaceaPoster2_Thoen
Title: Native Echinacea angustifolia has depressed viability relative to non-native E. pallida and reciprocal hybrids (E. angustifolia x E. pallida) in a fragmented prairie habitat
Presented at: MEEC 2019 at Indiana State University in Terre Haute, IN
When: April 27th, 2019
Hello again!
I’m back with more updates from our team trip to Terre Haute for MEEC 2019. Today, I want to show off the incredible pollen limitation study poster presented by Tris Dodge. Tris joined Team echinacea this last November when he was a Carleton Extern at the Chicago Botanic Garden for three weeks before winter break. As an intern, Tris did a lot of work gathering and analyzing data on our pollen limitation study. If you want to learn more about that study, check out our background page. If you want to see the work that Tris did specifically, check out the flog posts that he has written. Tris’s flog posts include a direct link to his poster
In his analysis, Tris found out that creating seeds is basically free for echinacea plants. If they produce a lot of seeds one year, they can produce a lot of seeds the next year as well. This was not what we had predicted! Tris used the data from 7 years of the pollen limitation study to show that plants that had zero reproduction did not turn into big-leafed, multi-head super plants, but instead look exactly the same as those heads that produced many achenes.
Tris presenting his poster to Nate Title: Little cost of reproduction in the long lived perennial, Echinacea angustifolia
Presented at: MEEC 2019 at Indiana State University in Terre Haute, IN
When: April 27th, 2019
|
|