|
|
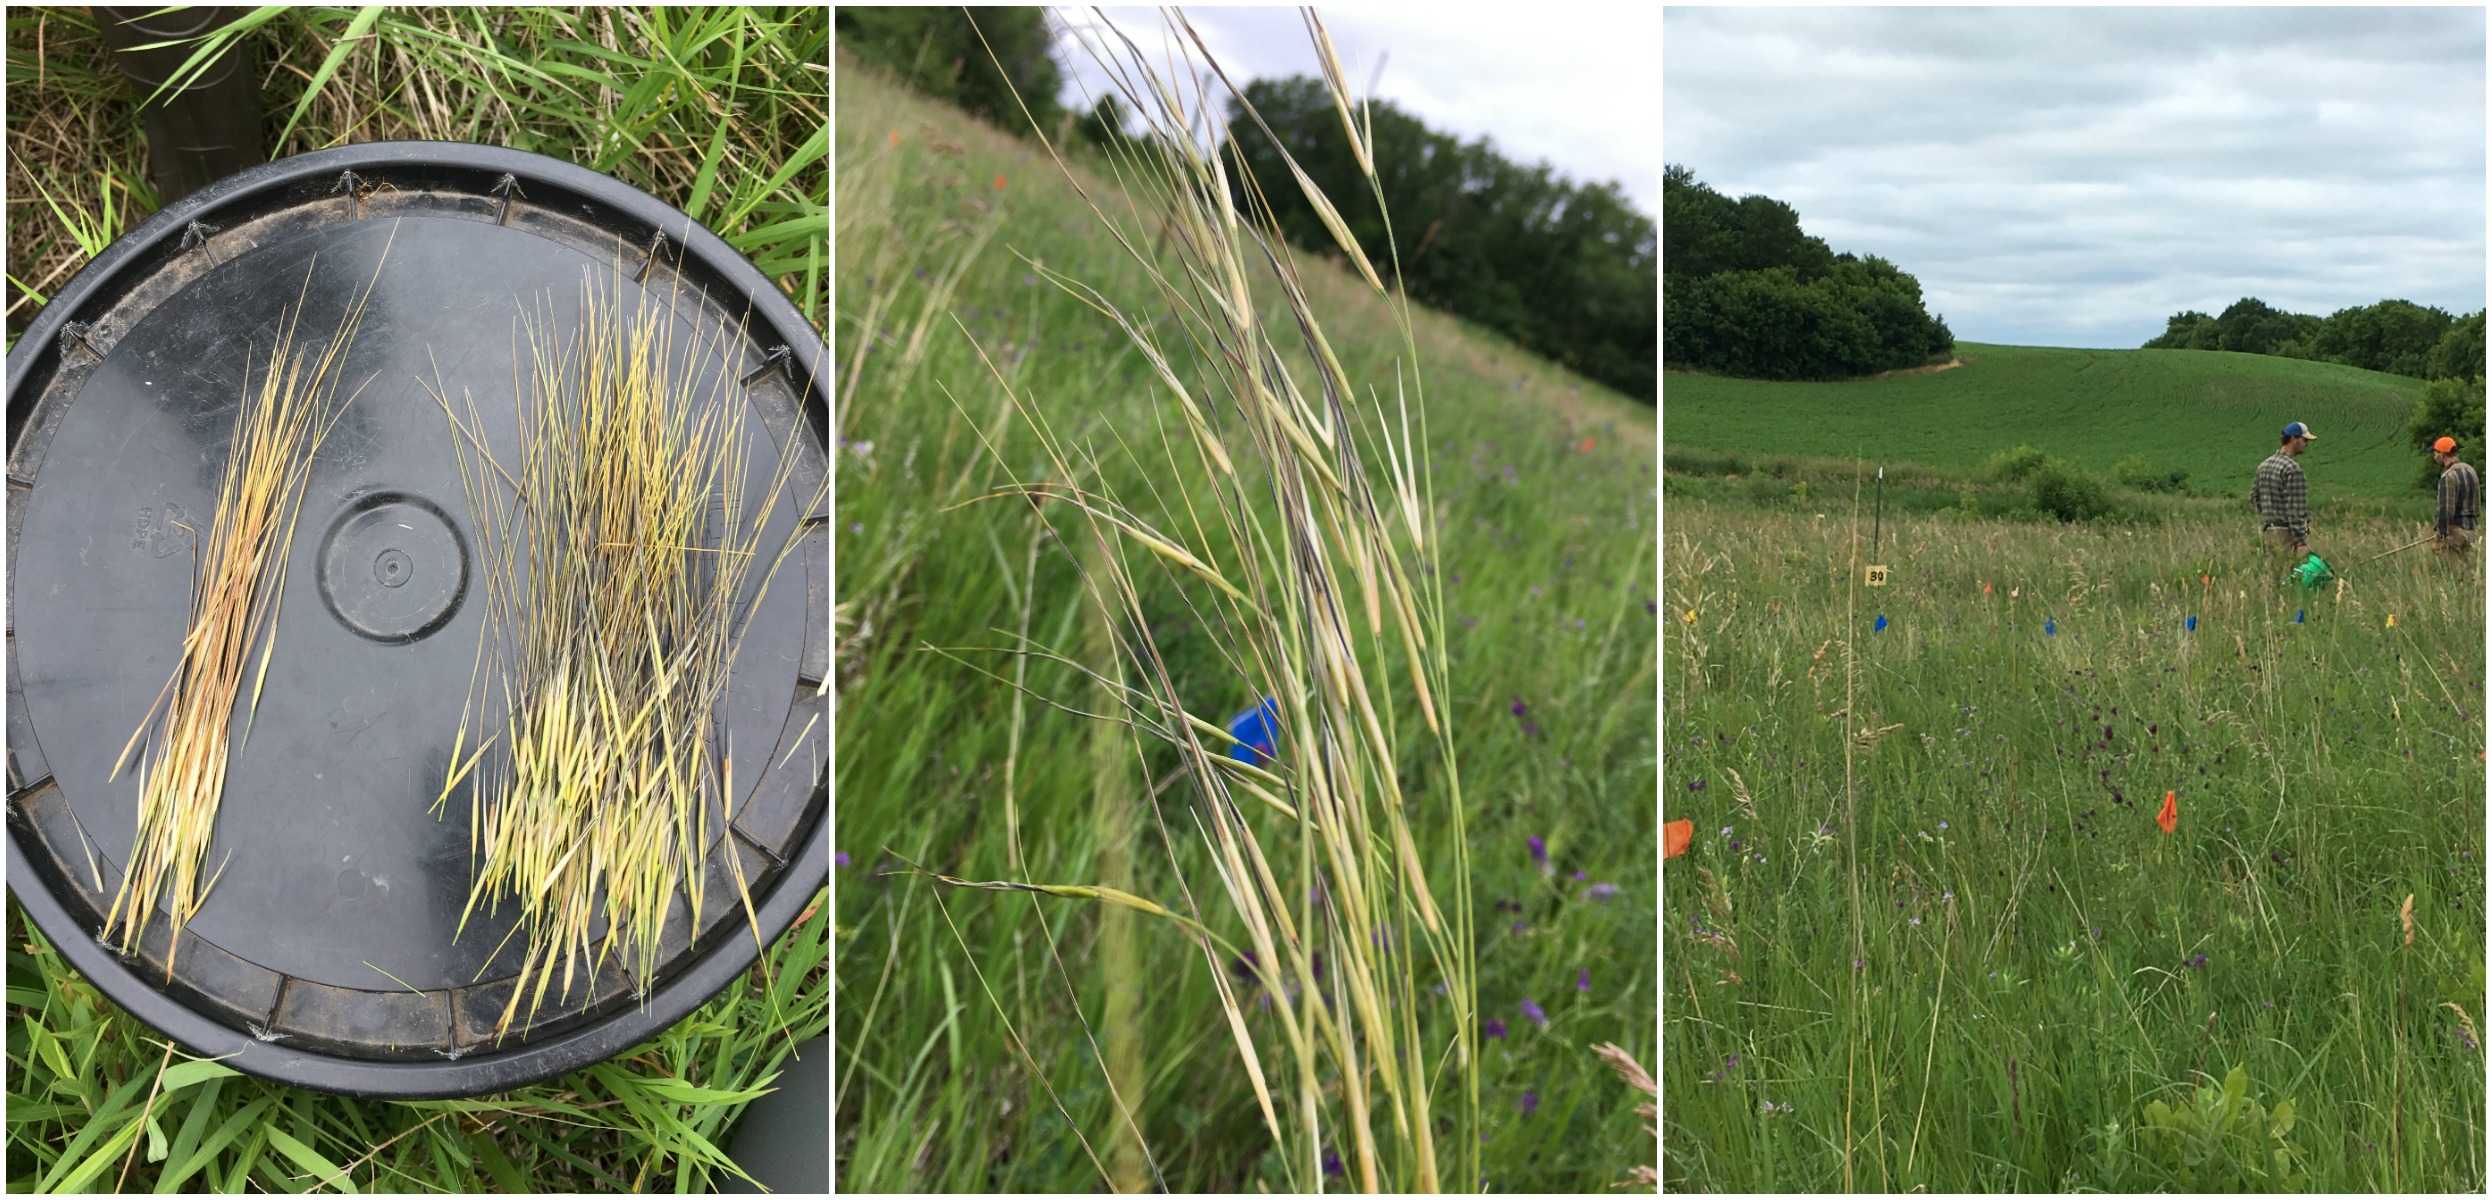
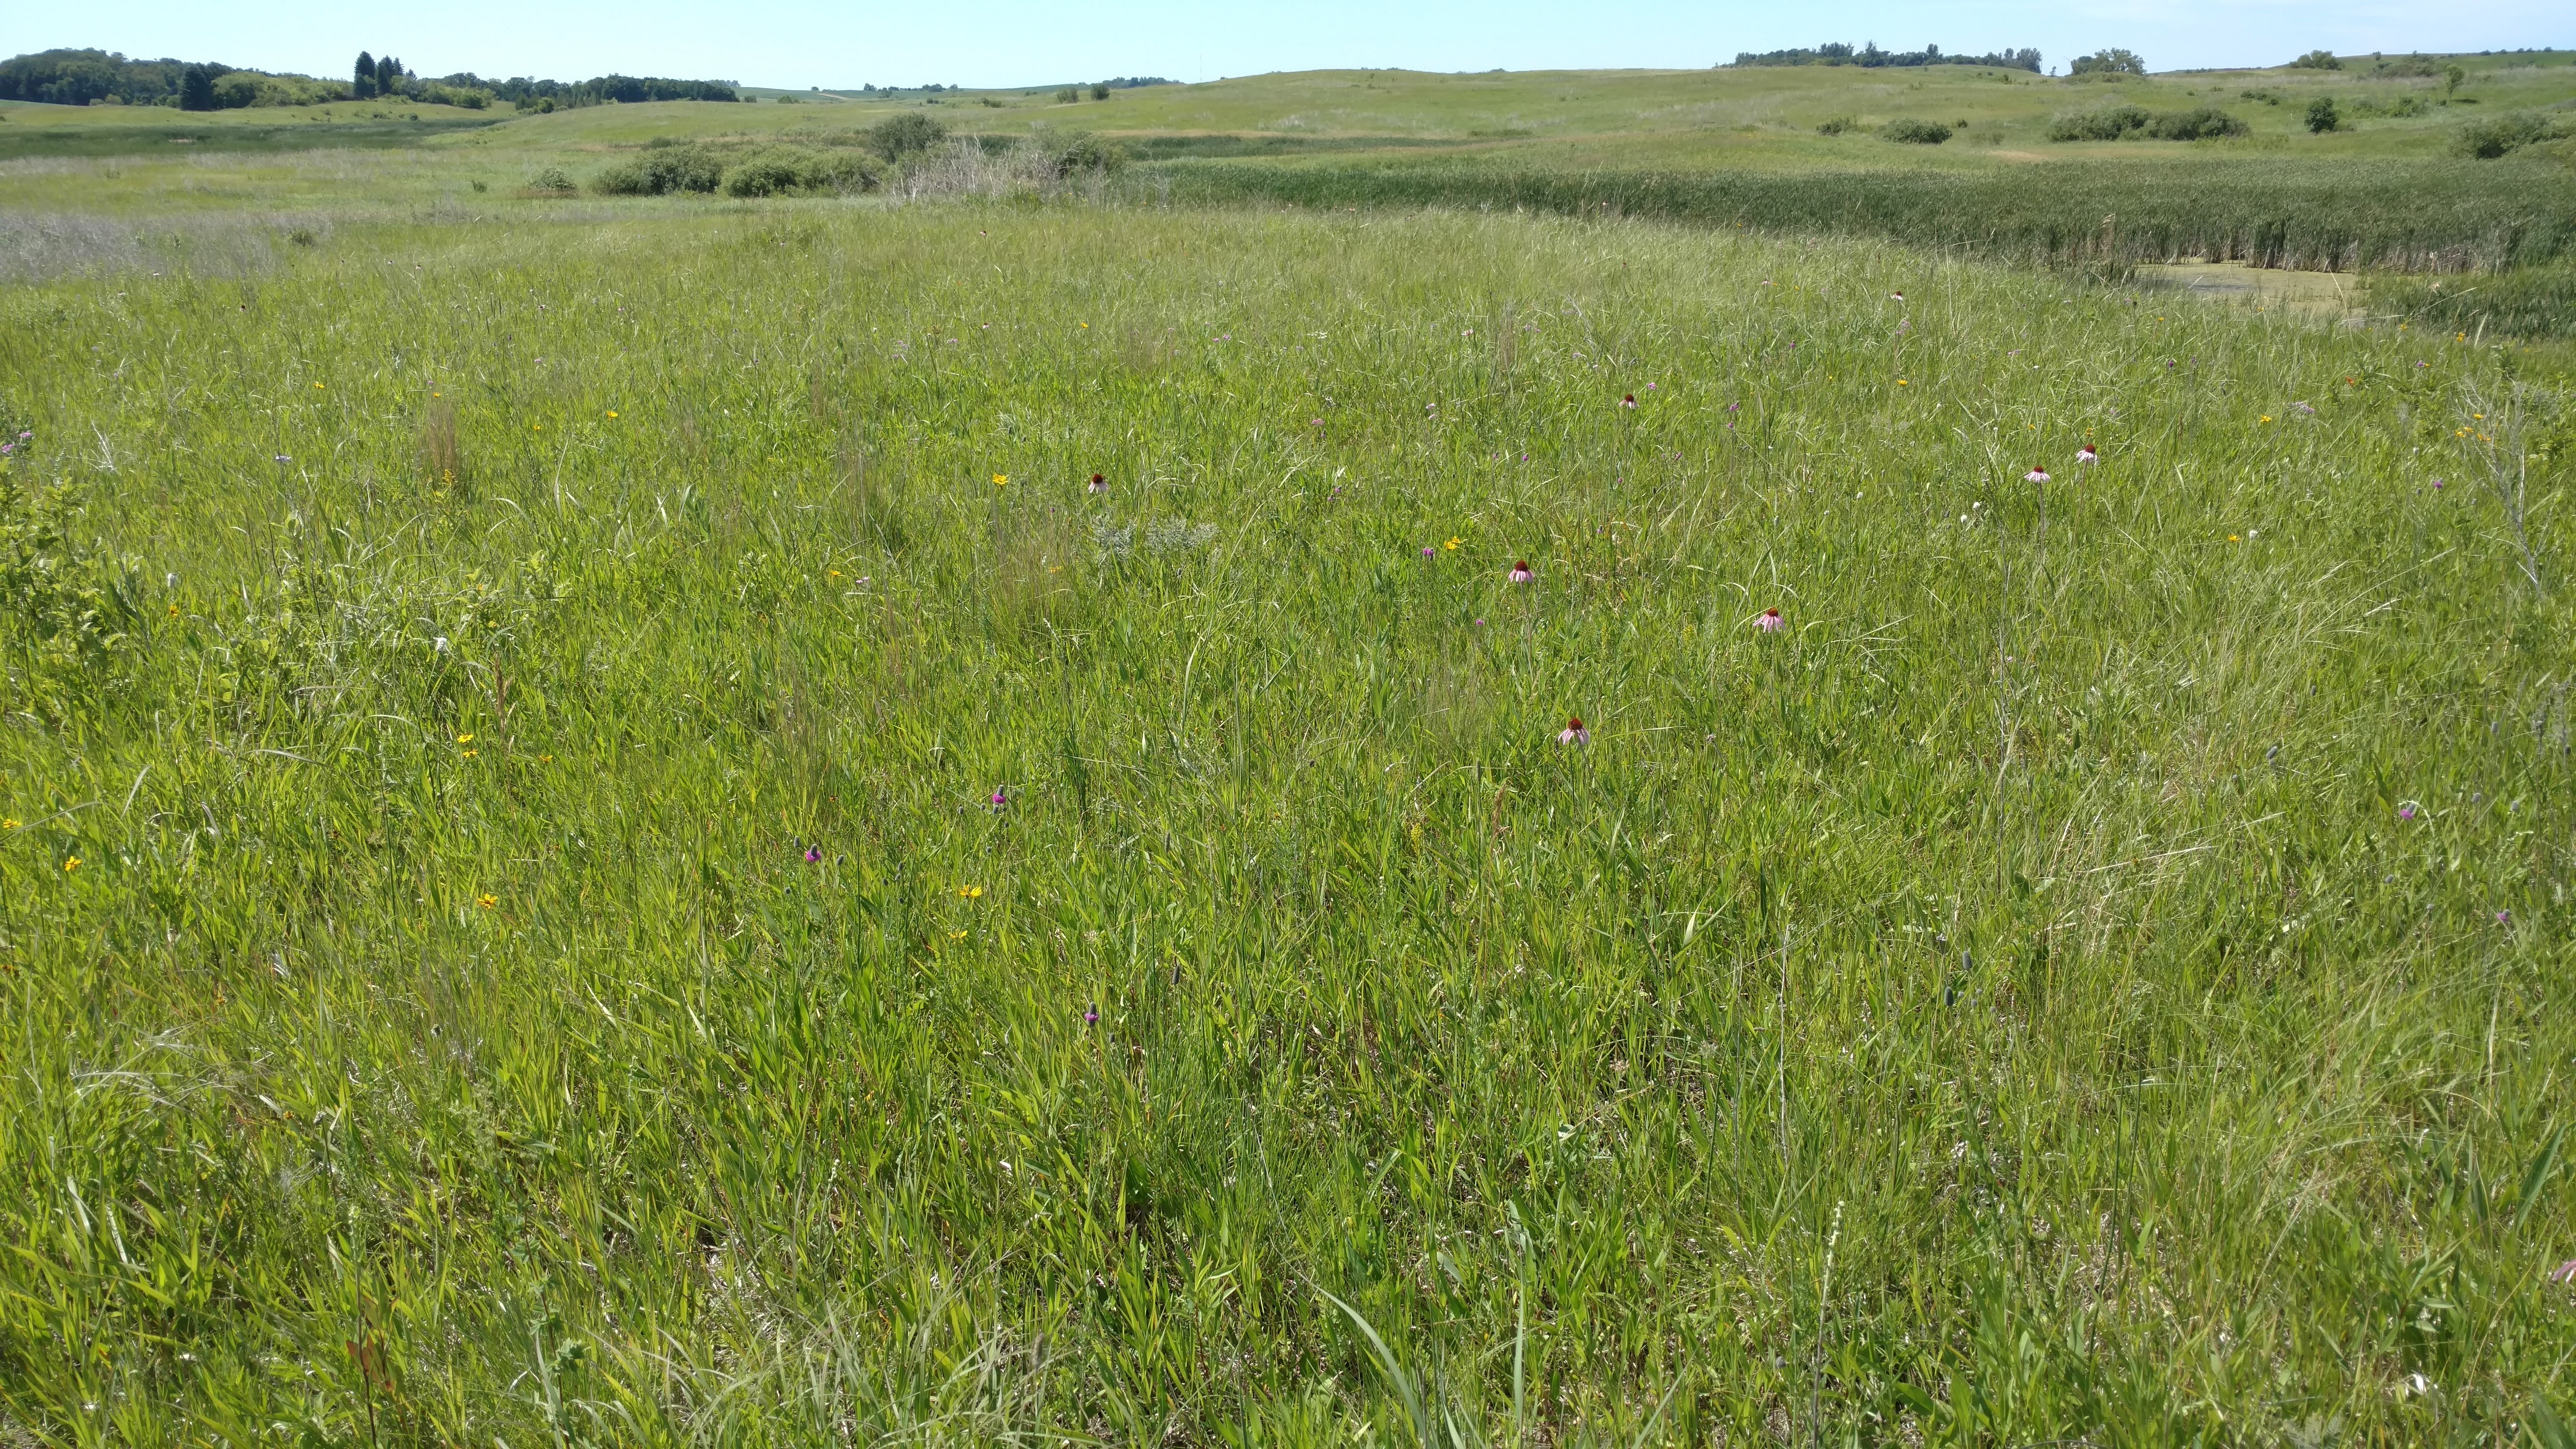
This summer we found 52 basal Stipa plants and 209 flowering plants! The flowering Stipa plants had a median of 15 fruit per plant. Our largest flowering Stipa plant had 301 fruits and 31 culms. We harvested around 5000 fruits from experimental plot 1! These Stipa plants, or porcupine grass (Hesperostipa spartea) were planted as seeds in 2009 and 2010.
 A Stipa collage created by Anna with collected fruits, a flowering plant, and Will and Wes searching for stipa. Start year: 2009
Location: Experimental plot 1
Physical specimens: Fruits from the 209 flowering plants were broadcasted in experimental plot 2.
Data collected: There are currently 3 datasets in the Stipa folder in CGData (~Dropbox/CGData/Stipa/225_measure/measure2017/)
- 20170628StipaSearchData.csv: 50 records from 28 June 2017. We searched for basal and flowering Stipa and recorded row and position, culm count, fruit count, aborted fruit count, missing fruit count, and notes.
- exPt1StipaSearch20170705.csv: 200 records from 28-29 June 2017. This csv includes rows with position 859 and status “Other (Note)”, indicating the row was searched but no stipa was found. When Stipa was found, status, row, position, culm count, fruit count, aborted fruit count, missing fruit count, and notes were recorded.
- 20171109StipaSearchData.csv: 69 records from 2 August 2017 and 9 August 2017. In this csv, predetermined rows and positions (where Stipa were found in previous years) were searched and the same information was collected as the other csvs. Since this was later in the season, all fruits had already dropped–but they could still be counted.
Products:
- Josh Drizin’s MS thesis included a section on the hygroscopicity (reaction to humidity) of Stipa awns. View his presentation or watch his short video.
- Joseph Campagna and Jamie Sauer (Lake Forest College) did a report on variation in Stipa’s physical traits within and among families in 2009
You can find out more about Stipa in the common garden and links to previous flog posts about this project on the background page for this experiment.
We had a big year for censusing plants in natural remnant populations. In 2017 we did both total demo, visiting all plants, and flowering demo, visiting just plants that flowered this year. Check out the chart below to see what we focused on at each site:
| Total Demo |
Aanenson, Around LF (partial), Common Garden, East of Town Hall, East Riley, Hegg Lake, Landfill West, Loeffler Corner East, NRRX, recruit he, recruit hp, recruit hs, Riley, RRX, South of Golf Course, Steven’s Approach, transplant plot |
| Flowering Demo |
Around LF, BTG, DOG, Elk Lake Road East, Golf Course, KJs, Krusemark, Landfill East, Liatris Hill, Loeffler Corner West, Near Town Hall, Nessman, NNWLF, North of Golf Course, NWLF, On 27, recruit el, recruit hw, recruit ke, recruit kw, RRXDC, Staffanson East Unit, Staffanson West Unit, Tower, Town Hall, West of Aanenson, Woody’s, Yellow Orchid Hill East, Yellow Orchid Hill West |
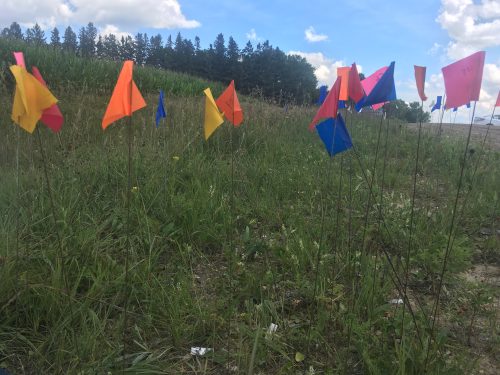
 We stake to locations where flowering plants have been found in the past and place a flag there. This is the East Riley roadside remnant, an area with a lot of Echinacea close together and a high chance of getting mowed. When we find a new flowering Echinacea plant, we give it a tag and get its location with a survey-grade GPS (better than 6 cm precision). Then, we can revisit this plant for years to come and monitor its survival and reproduction.
This season we added 5945 demo records and about 1375 survey records to our database. After over 20 years of this method, we now have a very rich longitudinal dataset of life histories including thousands of plants. REU Will Reed was a huge help organizing demo tasks for Team Echinacea over the summer and helping out with demap (the demographic census database) during the year.
Year started: 1996
Location: Roadsides, railroad rights of way, and nature preserves in and near Solem Township, Minnesota.
Overlaps with: Flowering phenology in remnants, fire and flowering at SPP
Data collected: demo records include Flowering status, number of rosettes, number of heads, neighbors within a 12 cm radius of plants found. These are all taken with PDAs that sync with an MS Access database. They are all transferred to the demap R repository in bitbucket with git version control.
GPS points shot: Points for each flowering plant this year shot mostly in SURV records, stored in surv.csv. Each location should be either associated with a loc from prior years or a point shot this year.
Products:
- Amy Dykstra’s dissertation included matrix projection modeling using demographic data
- Project “demap” merges phenological, spatial and demographic data for remnant plants
You can find out more about the demographic census in the remnants and links to previous posts regarding it on the background page for this experiment.
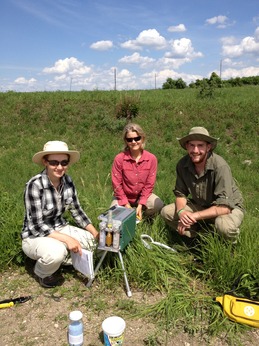
 Reina, Pamela, and Mike with the photosynthesis machine used in Kittelson et al. (2015) In 2017, of the original 1,470 plants in INB2, 473 were still alive. Of the plants that were alive this year, only 4 were flowering (0.8%) and 71% have never flowered. Interestingly, there are differences in survival for each cross level. 31% of the most inbred plants were living in 2017, compared to 39% of the plants in the between-remnant cross level. All individuals were planted in 2006.
The INB2 experiment investigates the relationship between inbreeding level and fitness in Echinacea angustifolia. Each plant in experiment INB2 originates from one of three cross types, depending on the relatedness of the parents: between maternal half siblings; between plants from the same remnant, but not sharing a maternal or paternal parent; and between individuals from different remnants. We continued to measure fitness and flowering phenology in these plants.
Read previous posts about this experiment.
Start year: 2006
Location: Experimental plot 1
Overlaps with: Phenology and fitness in P1, Inbreeding experiment–INB1
Physical specimens: We harvested 2 heads from INB2 that will be processed in the lab with other heads harvested from P1.
Data collected: We used handheld computers to collect fitness data on all plants in INB2.
Products: The below papers were published in summer 2015:
Kittelson, P., S. Wagenius, R. Nielsen, S. Qazi, M. Howe, G. Kiefer, and R. G. Shaw. 2015. Leaf functional traits, herbivory, and genetic diversity in Echinacea: Implications for fragmented populations. Ecology 96:1877–1886. PDF
Shaw, R. G., S. Wagenius and C. J. Geyer. 2015. The susceptibility of Echinacea angustifolia to a specialist aphid: eco-evolutionary perspective on genotypic variation and demographic consequences. Journal of Ecology 103:809-818. PDF
You can find more information about the Inbreeding experiment–INB2 and links to previous flog posts regarding this experiment at the background page for the experiment.
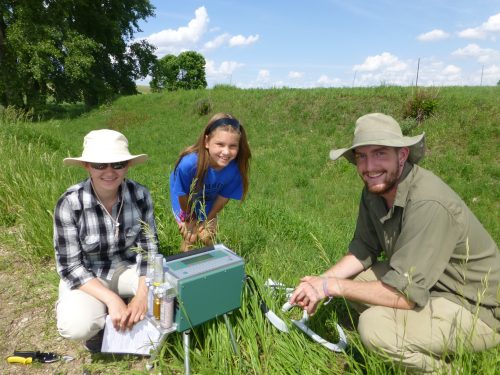
 Reina, Hattie, and Mike with the instrument used to measure photosynthesis in 2013. In 2017, of the original 557 plants in INB1, 180 were still alive. Of the plants that were alive this year, 7 (4%) were flowering and 23% have never flowered. Interestingly, there are differences in survival for each cross level. 21% of the most inbred plants were living in 2017, compared to 39% of the plants in the between remnant cross level. All individuals were planted in 2001.
The INB1 experiment investigates the relationship between inbreeding level and fitness in Echinacea angustifolia. Each plant in experiment INB1 originates from one of three cross types, depending on the relatedness of the parents: between maternal half siblings; between plants from the same remnant, but not sharing a maternal or paternal parent; and between individuals from different remnants. We continued to measure fitness and flowering phenology in these plants.
Read previous posts about this experiment.
Start year: 2001
Location: Experimental plot 1
Overlaps with: Phenology and fitness in P1
Physical specimens: We harvested 6 heads from INB1 that will be processed in the lab with other heads harvested from P1.
Data collected: We used handheld computers to collect fitness data on all plants in INB1.
Products: The below papers were published in summer 2015:
Kittelson, P., S. Wagenius, R. Nielsen, S. Qazi, M. Howe, G. Kiefer, and R. G. Shaw. 2015. Leaf functional traits, herbivory, and genetic diversity in Echinacea: Implications for fragmented populations. Ecology 96:1877–1886. PDF
Shaw, R. G., S. Wagenius and C. J. Geyer. 2015. The susceptibility of Echinacea angustifolia to a specialist aphid: eco-evolutionary perspective on genotypic variation and demographic consequences. Journal of Ecology 103:809-818. PDF
You can find more information about the Inbreeding experiment–INB1 and links to previous flog posts regarding this experiment at the background page for the experiment.
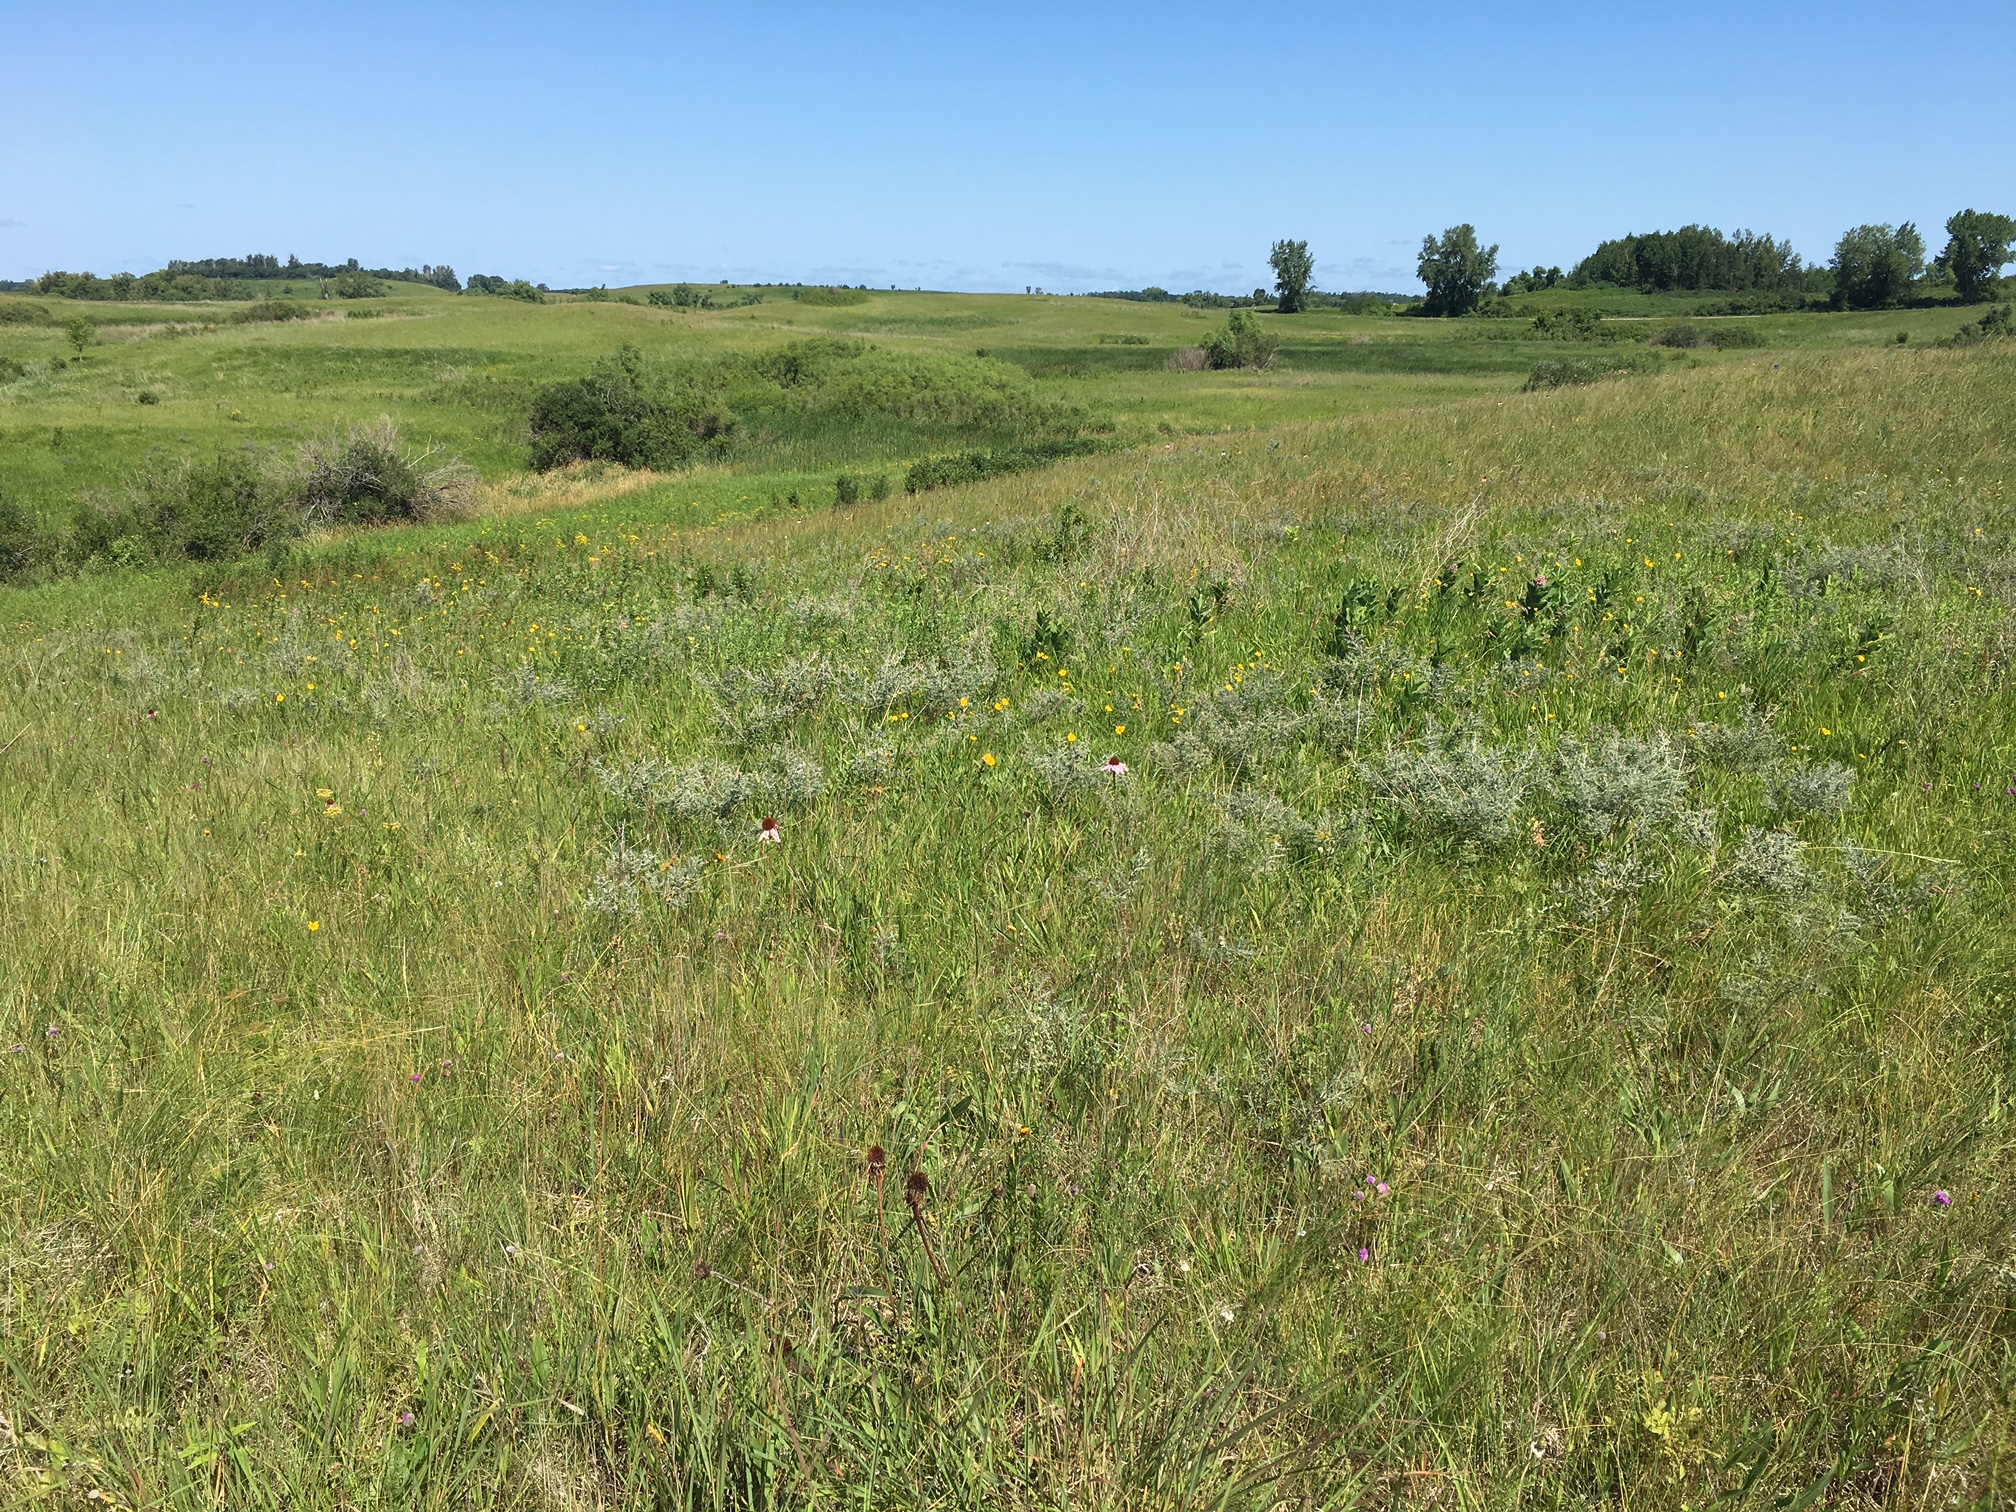
In 2017, we searched in 7 recruitment plots for flowering Echinacea angustifolia plants. For each flowering plant, we took demographic data- counting the number of rosettes, counting the number of flowering heads, and shooting a GPS point of the exact location of the plant. Four plots had no flowering plants, but three of the plots had a total of 43 flowering Echinacea plants. Of the plots with flowering plants, two plots (with 35 of the flowering plants) are located at Hegg Lake, a site managed by the Minnesota DNR, and one plots (with 8 flowering plants) is located at Eng Lake.
This recruitment experiment was originally established in 2000 to quantify seedling emergence and juvenile survival of Echinacea angustifolia during its reintroduction to sites with varying land-use history and burn schedules. Before 2014, detailed data was collected on each plant in the plots. Since 2014, we’ve censused each plot yearly to collect demographic data for every flowering plant.

Echinacea at Hegg Lake, photo by Wes Braker
Year started: Plantings in 2000-2002
Location: Ten study plots on state land with different land use histories: old-field and restored grassland.
Overlaps with: Demographic census in remnants
Data collected: Status, rosette count, flowering head count, GPS point for each flowering plant in each recruitment plot
Products:A paper (Wagenius et al. 2012) published in Restoration Ecology.
You can find more information about the effects of fire on seedling recruitment of Echinacea angustifolia on the background page for the experiment.
This summer, Amy and members of Team Echinacea continued to monitor the progress of Echinacea plants in her local adaptation plots. We found 221 basal plants, but no flowering plants this year. Amy has 3 sites: Western South Dakota, Central South Dakota, and West Central Minnesota. At each site achenes from all sites have been sowed. Team Echinacea is able to help with the assessment of survival and fitness traits of the individuals in the Minnesota plot.
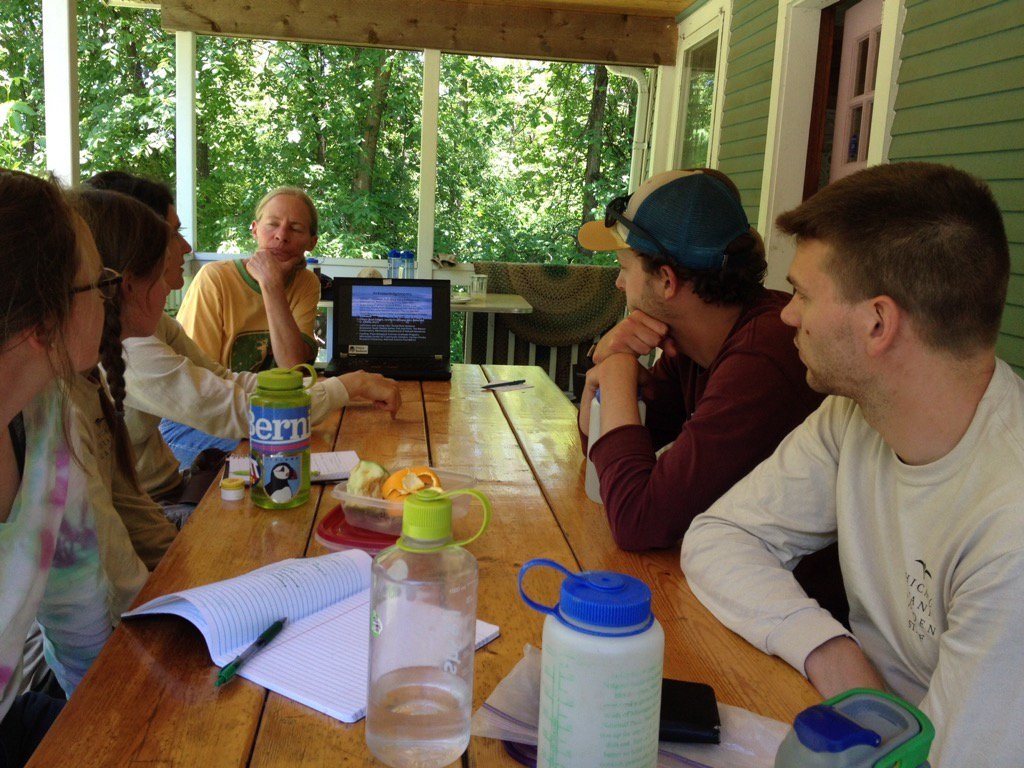
 Amy presents her local adaptation research so far at lunch this summer. Start year: 2008
Location: Grand River National Grassland (Western South Dakota), Samuel H. Ordway Prairie (Central South Dakota), Staffanson Prairie Preserve (West Central Minnesota), and Hegg Lake WMA (West Central Minnesota).
Overlaps with: Dykstra’s interpopulation crosses
Data collected: Plant fitness measurements (plant status, number of rosettes, number of leaves, and length of longest leaf)
You can find more information about Amy’s local adaptation experiment and links to previous flog posts regarding this experiment at the background page for the experiment.
This summer, we found 68 basal plants in the crossing experiment. None of these plants have ever flowered, but maybe next year! We measured plant status, number of rosettes, number of leaves, and length of the longest leaf of the individuals. We also noted damage (herbivory) to the leaves.
These data will allow Amy to test how mating with individuals from other populations affects Echinacea fitness. She planted 15,491 achenes, the offspring of crosses from six of the largest remnant populations. Populations might either benefit or suffer from crossing with plants from another population.
Hegg Lake WMA Start year: 2008
Location: Hegg Lake WMA
Overlaps with: Dykstra’s local adaptation
Data collected: Plant fitness measurements (plant status, number of rosettes, number of leaves, and length of longest leaf)
Products: Read about Amy’s analysis of the interpopulation crossing experiment in her flog post.
You can find more information about Amy’s experiment and links to previous flog posts regarding this experiment at the background page for the experiment.
 In 2017 only 2% of the surviving members of the 1996 cohort flowered! In 2017 only 7 plants flowered of the surviving 284 plants in the 1996 cohort. That means that 44% of the original plants are surviving and only 2% of the living individuals flowered! Five percent of living individuals flowered in 2016. In contrast, 45% of living plants flowered in 2015, followed by 37%, 34%, and 40% from 2014 back to 2012. We found that of the original 646 individuals, 284 were alive in 2017, only 7 fewer than last year. We are not sure why so few plants flowered this year. It’s possible that lack of fire in the plot influenced flowering rates. This plot was due for a prescribed burn in spring 2017, but weather and scheduling conflicts kept us from burning.
The 1996 cohort has the oldest Echinacea plants in experimental plot 1; they are 21 years old. They are part of a common garden experiment designed to study differences in fitness and life history characteristics among remnant populations. Every year, members of Team Echinacea assess survival and measure plant growth and fitness traits including plant status (i.e. if it is flowering or basal), plant height, leaf count, and number of flowering heads. We harvest all flowering heads in the fall, count all achenes, and estimate seed set for each head in the lab.
Start year: 1996
Location: Experimental plot 1
Overlaps with: phenology in experimental plots, qGen3, pollen addition/exclusion
Physical specimens:
- We harvested 8 heads. At present, they await processing in the lab to find their achene count and seed set.
Data collected:
- We used Visors to collect plant growth and fitness traits—plant status, height, leaf count, number of flowering heads, presence of insects—these data have been added to the database
- We used Visors to collect flowering phenology data—start and end date of flowering for all individual heads—which is ready to be added to the exPt1 phenology dataset
- Eventually, we will have achene count and seed set data for all flowering plants (stay tuned)
Products:
You can find more information about the 1996 cohort and links to previous flog posts regarding this experiment at the background page for the experiment.
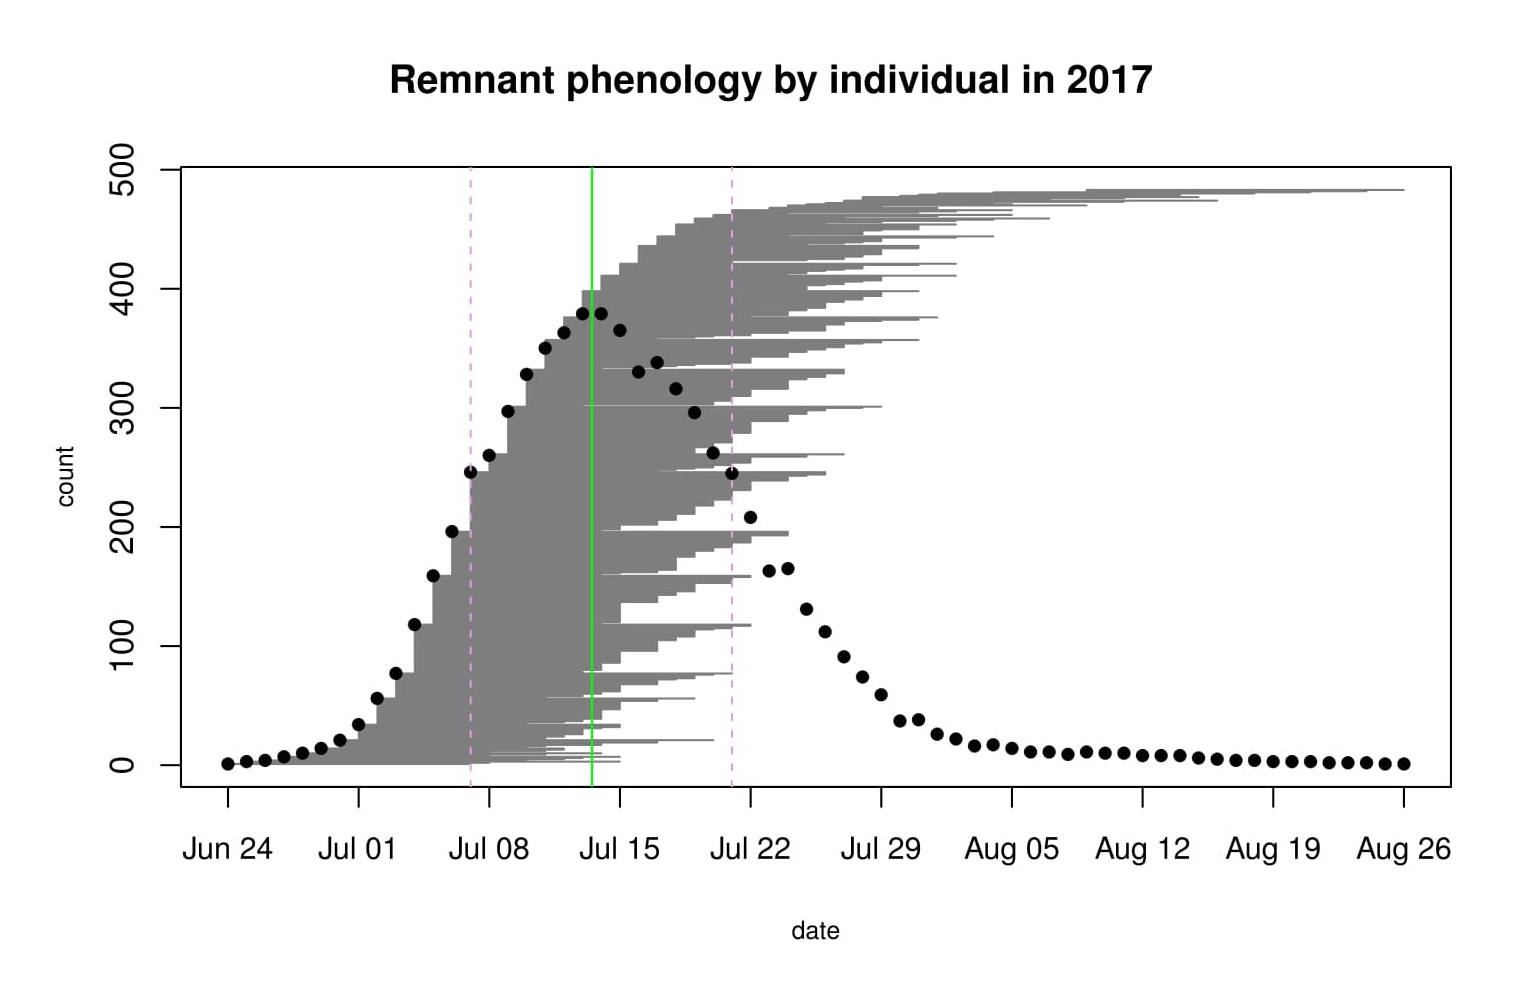
In 2017, according to our preliminary data, flowering began on June 24th with one head at the Aanenson remnant. The latest bloomer was a 5-headed plant at Steven’s Approach, and the last day its last head shed pollen was August 26th. Peak flowering for the 9 remnants we observed this year was July 13th. There was a total of 427 flowering plants producing 575 flowering heads. The figure below was generated with R package mateable, which was was developed by Team Echinacea to visualize and analyze phenology data.
 The gray shaded area is made up of horizontal gray lines, each representing the duration of one flowering head. The vertical green line represents the peak flowering date, July 13th. On average, heads flowered for approximately 2 weeks. From 2014-2016, determining flowering phenology was a major focus of the summer fieldwork, with Team Echinacea tracking phenology in all plant in all of our remnant populations. Stuart began studying phenology in remnant populations between 1996 and 1999 and several students also studied certain populations in following years. The motivation behind this study is to understand how timing of flowering affects the reproductive opportunities and fitness of individuals in natural populations.
Start year: 1996
Location: roadsides, railroad rights of way, and nature preserves in and near Solem Township, MN (2017: Aanenson, Around Landfill, East Elk Lake Road, Nessman, Northwest Landfill, Steven’s Approach, Staffanson Prairie Preserve, Town Hall)
Overlaps with: Phenology in experimental plots, demography in the remnants, reproductive fitness in remnants
Physical specimens:
- We harvested 121 Echinacea heads at 8 of the 28 remnants. These were harvested from Lea and Tracie’s “rich hood” (richness of neighborhood) plots. Not all harvested heads were monitored for the phenology dataset.
Data collected: We identify each plant with a numbered tag affixed to the base and give each head a colored twist tie, so that each head has a unique tag/twist-tie combination, or “head ID”, under which we store all phenology data. We monitor the flowering status of all flowering plants in the remnants, visiting at least once every three days (usually every two days) until all heads were done flowering to obtain start and end dates of flowering. We managed the data in the R project ‘aiisummer2017′ and will add it to the database of previous years’ remnant phenology records.
GPS points shot: We shot GPS points at all of the plants we monitored. The locations of plants this year will be aligned with previously recorded locations, and each will be given a unique identifier (‘AKA’). We will link this year’s phenology and survey records via the headID to AKA table.
You can find more information about phenology in the remnants and links to previous flog posts regarding this experiment at the background page for the experiment.
In 2017, we checked 119 focal plants at 12 remnants for nearby seedlings found in previous years. We found 123 out of the original 955 seedlings (25 fewer than the 148 found last fall). Although challenging to obtain, information about the early stages of E. angustifolia in remnants is valuable.
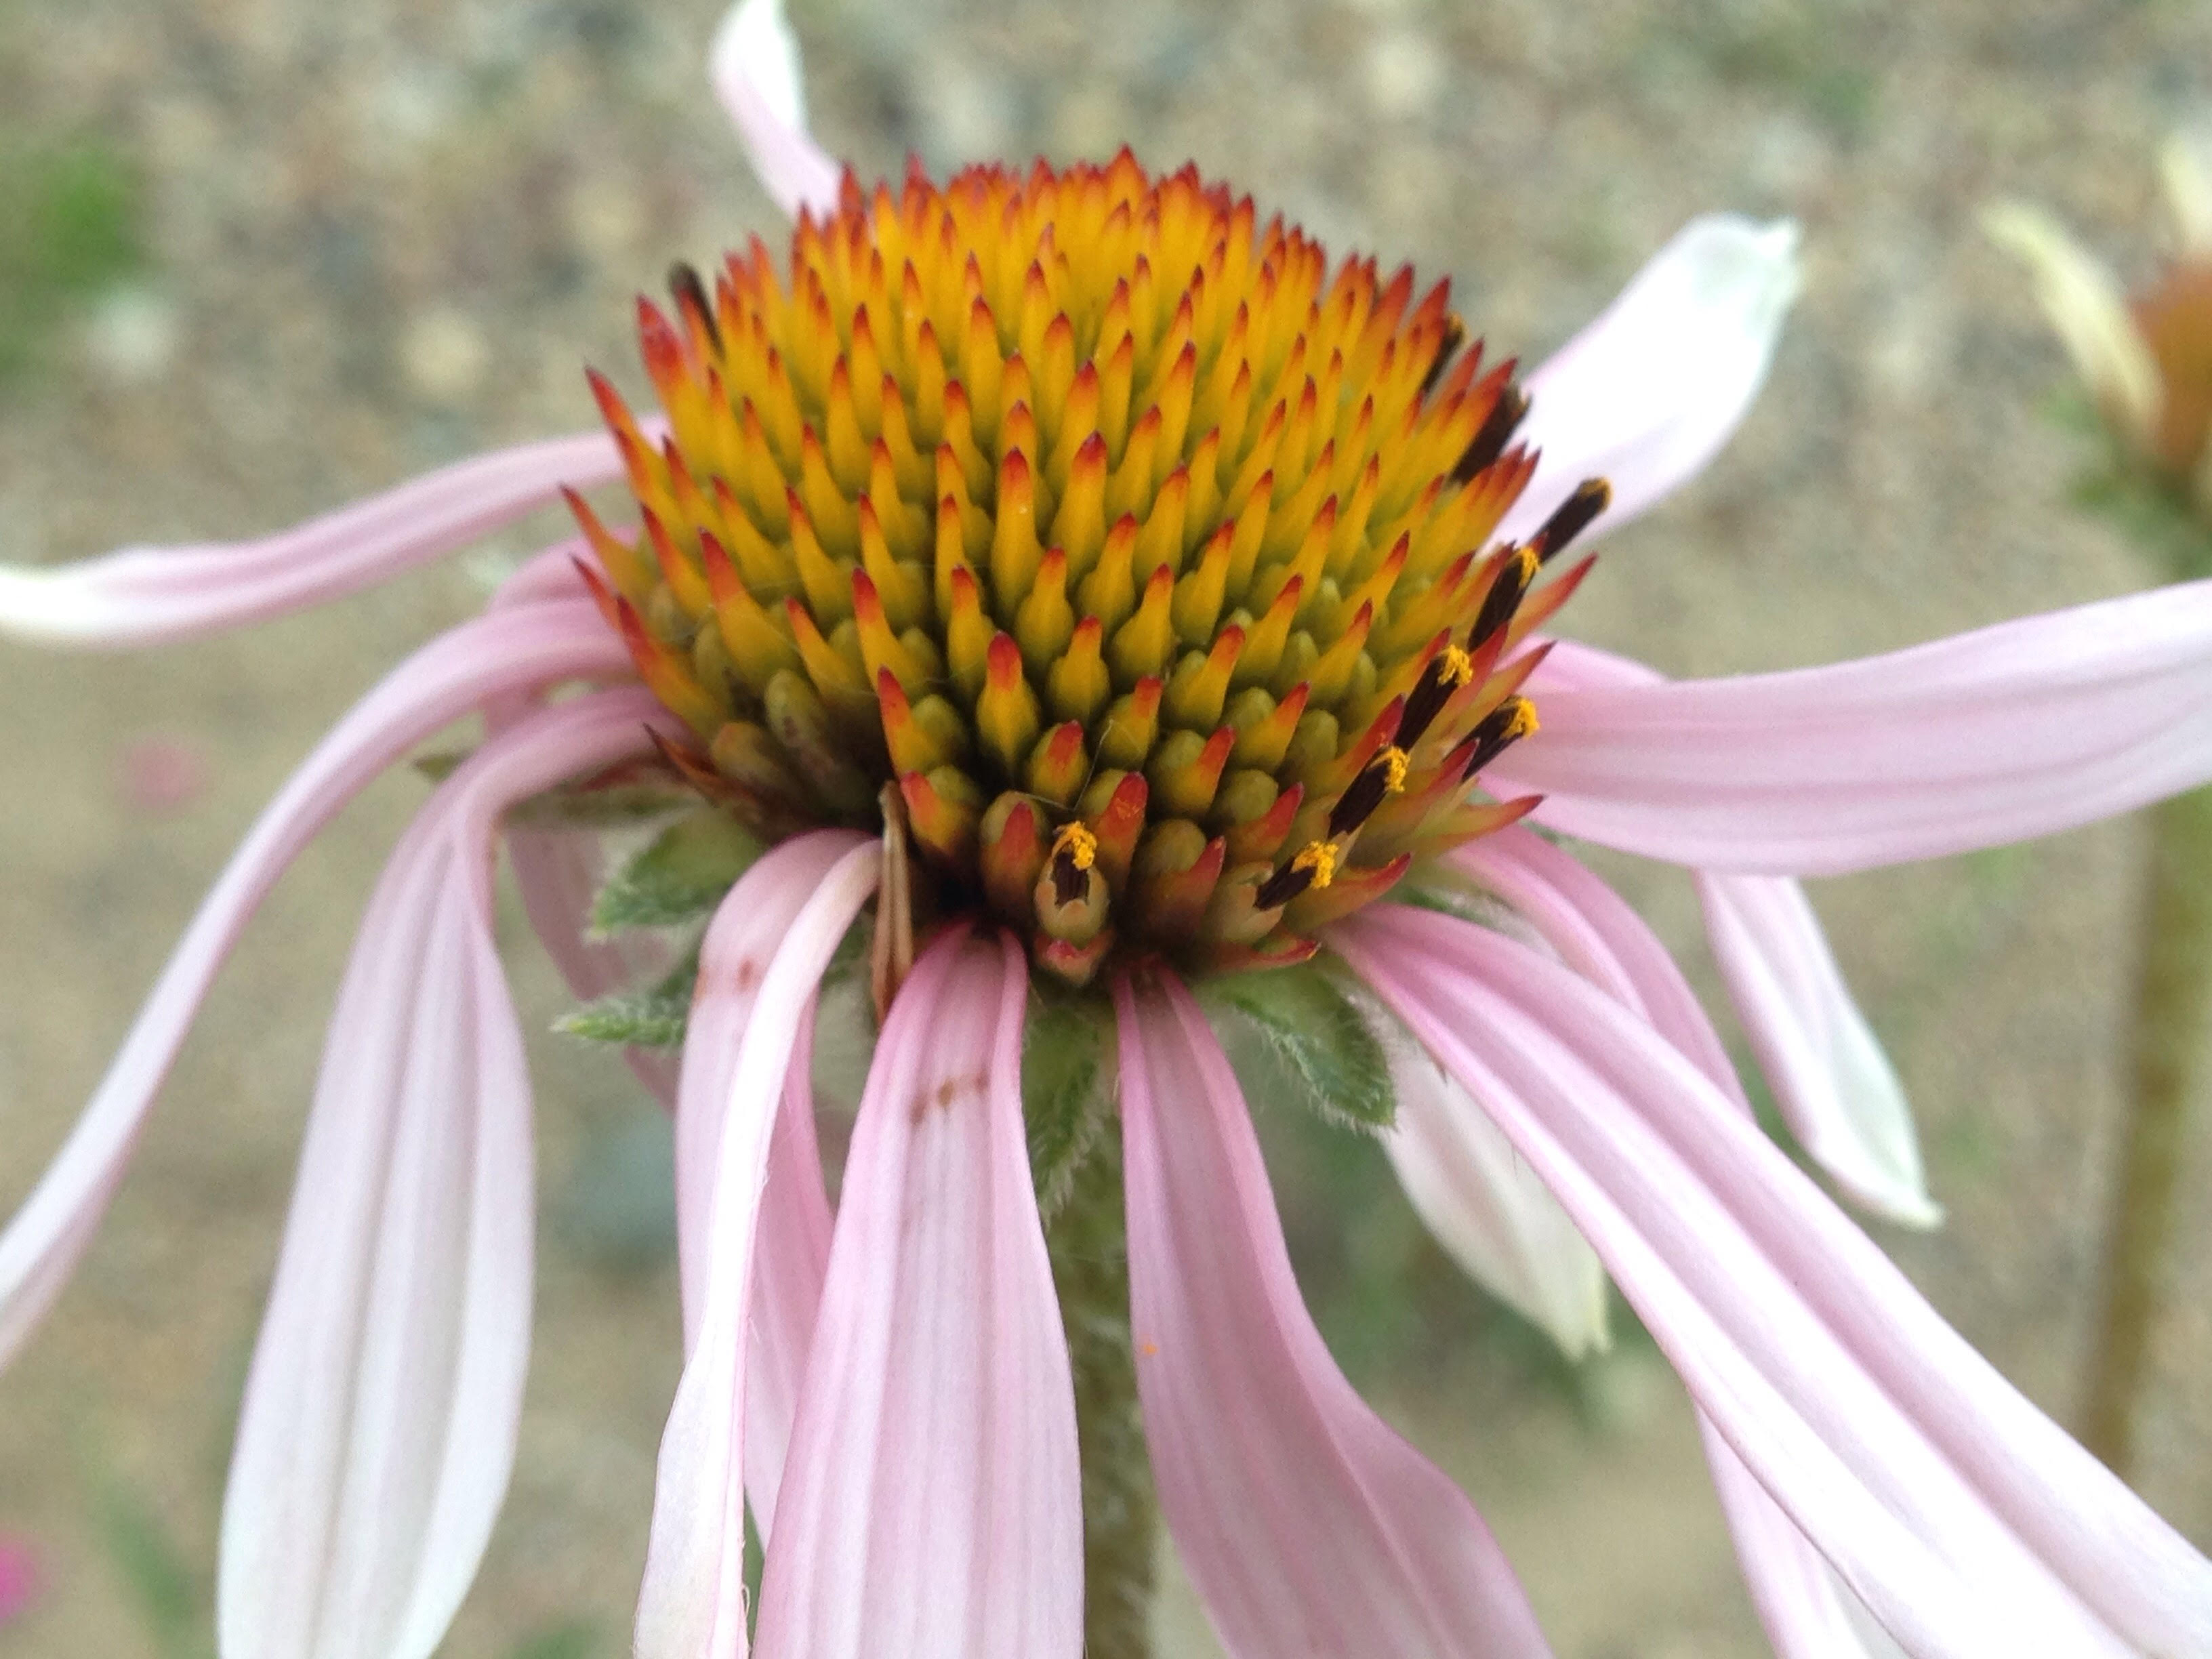
 Generations of Echinacea: A fallen head dropped achenes that have germinated. How many seedlings do you see? These data tell us how many years it takes plants to flower (a LONG time!) and the mortality rate for seedlings in remnants.
Between the summers of 2007 and 2013, team Echinacea observed the recruitment of Echinacea angustifolia seedlings around focal plants at 13 different prairie remnants. The locations of these seedlings were mapped relative to each focal plant and the seedlings (now former seedlings) are revisited each year. For each of these former seedlings, we make a record each year updating its status (e.g., basal, not found), rosette count, and leaf lengths. We also try to update the maps, which are kept on paper and passed down through the years.
Year started: 2007
Location: East Elk Lake Road, East Riley, East of Town Hall, KJ’s, Loeffler’s Corner, Landfill, Nessman, Riley, Steven’s Approach, South of Golf Course remnants and Staffanson Prairie Preserve.
Overlaps with: Demographic census in remnants
Data collected:
- Electronic records of status, leaf measurements, rosette count, and 12-cm neighbors for each seedling. Currently in Pendragon database
- Updated paper maps with status of searched-for plants and helpful landmarks
Products: Amy Dykstra used seedling survival data from 2010 and 2011 to model population growth rates as a part of her dissertation.
You can read more about the seedling establishment experiment and links to previous flog entries about the experiment on the background page for this experiment.
|
|