
Nina here! Today, Trevor and I continued analyzing the data that we collected during the first two weeks of our externship. We both kept working in R, perfecting our papers, and analyzing our results.
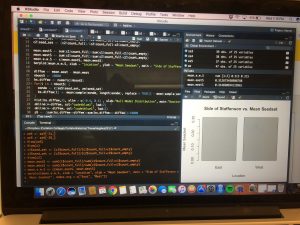
Trevor found the confidence intervals for mean seed-set for Liatris and was very excited to see that the two intervals didn’t overlap, strengthening his confidence in his previous findings. Next, he aggregated and merged Solidago data before repeating the analysis he did for Liatris on the Solidago data, but with very different results. It seems as if Solidago was not effected by the burn that occurred in the site (as you can see from the photo on the left), but stay tuned for more updates!
Meanwhile, I looked the diversity function within R’s ‘vegan’ package to use Shannon’s and Simpson’s Diversity Indices on my plant community from each plot. I plotted seed-set, fecundity, and achene count against each index and found the highest correlation when looking at achene count. Next, I calculated species richness as well as the Shannon’s and Simpson’s Diversity Indices including only flowering plants. More updates to follow! After finishing up my actual analysis, I got back to working on my paper (which you can see a preview of on the right) and started thinking about which portions of my results and which graphs I might want to include in my paper.
Leave a Reply