|
|
Synchrony between plants is important as higher synchrony with other plants leads to more potential pollen sources and a greater likelihood of a seed being pollinated and becoming viable. At this point, synchrony is measured by counting the number of nearby flowering echinacea plants, but my malo curve data allows us to measure synchrony using the number of florets open on a given day for the entire population and comparing it to the number of florets for a given plant. As shown by the graph below, measuring synchrony by counting the number of flowering plants can overestimate synchrony later in the season when flowering plants have less open florets. Time to explore these graphs for different populations and look at the potential impacts.

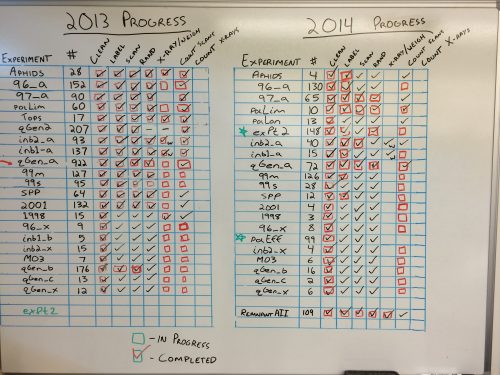
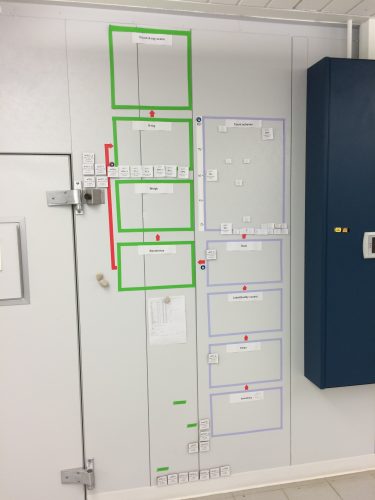
Though Stuart, Gretel, and Amy will be headed to Minnesota for the summer, our wonderful team of volunteers will still be here in Illinois working hard. We’ve used a couple systems to measure progress in the past few years but we’re going to make a simplified version for the summer before completely redoing our lab workflow visualization. We wanted to give our progress boards a proper send off before replacing them with a simpler summer-oriented progress board. More details to come!
 The progress board before being erased.  The progress wall before tape removal
Nina presented her poster “Competitive Exclusion Between Echinacea angustifolia and Echinacea purpurea” at the Illinois Math and Science Academy student research symposium (aka the 28th Annual IMSAloquium) on April 28th.
You can read all of the abstracts. She gave a great presentation. It was a pleasure to have Nina on the team.
After working on my analysis for a few days I have realized that whether or not the head is unique to an Echinacea plant does not affect the malo curve for the individual head, or in real world terms, it doesn’t affect the flowering schedule of the head. This conclusion brought up two more questions.
The first question I have is what, if anything, explains the variations in the malo curve for the head if its uniqueness to the plant doesn’t. To try to answer this question I will be investigating is including the population of origin for the plant and the year it was planted in the investigation. I hope that this information will shed some light on the variations in the malo curves.
The second questions I have is how do multiple heads on an Echinacea plant interact to form the malo curve of the plant as a whole. The first thing I did was graph all the heads on a common plant on the same graph, which produced a lot of variation.
 Two heads with no overlap.  Two heads with almost complete overlap.  A plant with 6 heads! Now that I’ve visualized the differences in the data, I’m excited by all the variation that I see. My next step is to produce malo curves for the plants as a whole and start an analysis. With two viable paths of investigation, I’m expecting a lot of work in the next few days.
 Keke hard at work counting the q3 offspring Keke is a senior Environmental Studies major at Lake Forest College who has been working in the lab for the past semester. For her project, she focused on the maternal plants of qGen_3. In that experiment, we crossed individuals in p1 with pollen collected from plants at Staffanson and Landfill during the summer and planted the seeds from those crosses in the fall. When dissecting the heads, we only selected achenes that we knew had been crossed properly.
This left ray achenes and achenes that may have been contaminated with other pollen, plus any achenes that we missed! Although we didn’t want to plant inviable or contaminated achenes, knowing the fecundity of the maternal plants is an important part of estimating fitness, so we wanted to have accurate achene counts for each mom. This is where Keke comes in. She removed all of the “extra” achenes and counted them, along with the rest of the maternal achenes which had been scanned in the fall.
Keke also analyzed the effect of a new pollen management procedure that we followed for q3. This procedure involved collecting pollen in multiple vials and taking care to only remove a vial from the refrigerator for crossing once. This was in an effort to reduce exposure of pollen to repeated warming and cooling cycles, which we thought might have reduced its viability in q2. Keke assessed the percent of successful crosses in q2 versus q3 and found that the percent of successful crosses increased 5% with the new procedure. Cool!
You can read more about what Keke did this winter and spring in her report, which can be found here:
Keke’s Q3 Report
Thanks Keke and best of luck in all of your future endeavors!
For the past several weeks, I have been busily going through tons of data from previous years in an effort to isolate only the data I need for my project. As a reminder, I’m looking at how prairie fire changes the mating scene and mate availability for Echinacea. I am using data from 1996, 1998, 2007, 2009, 2012, 2014, and 2015. With the exception of 2015 when no burn occurred, part of Staffanson Prairie Preserve underwent a controlled burn during each of these years.
From a file containing all seed set data for all plants that the Echinacea Project has ever collected, I extracted data for plants that flowered in both 2015 and at least one of the previous burn years. I ended up with 26 plants that met this description, and I will compare reproductive success of each of these plants on an individual basis in burn years compared to non-burn years.
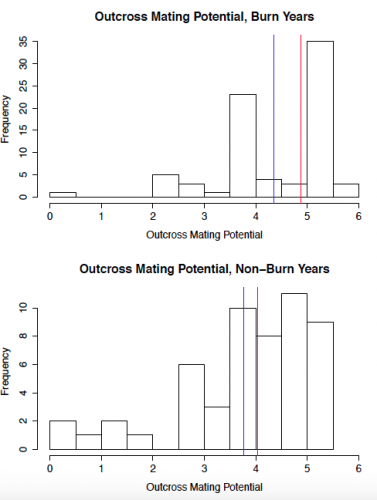
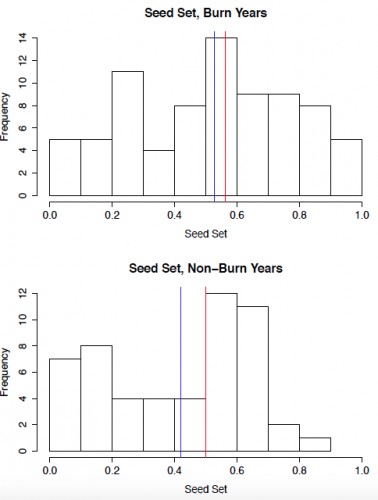
To start out, I created some histograms of the data to get a quick insight into patterns that might be present. In order to roughly quantify the quality of the mating scene for a given plant, I calculated outcross mating potential (OMP), which takes into account the distances to the 6 nearest flowering neighbors. A higher value indicates a greater density of available mates. The second set of histograms shows seed set, with a higher number indicating greater reproductive success. While I will need to conduct statistical analyses to get a better understanding of what these data mean, initial impressions indicate that both the mating scene and reproductive success may be better in burn years.
 
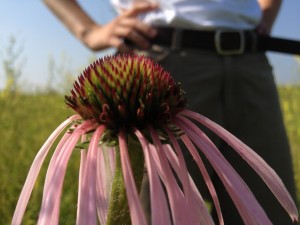
In 2015, we continued an experiment that investigates hybridization between the native Echinacea angustifolia and the unintentionally planted non-native E. pallida. This year, out the the 758 plants planted in spring 2014, 521 were still alive which is a survival rate of 68.7%.
In the late summer of 2013, members of Team Echinacea collected heads from Echinacea angustifolia and Echinacea pallida from two nearby populations at Hegg Lake Wildlife Management Area. Unlike previous experiments, we performed no artificial crosses. This allows us to determine if hybridization is occurring naturally. In the winter of 2014, Lydia English germinated seeds from these heads. In the spring, Lydia and Stuart planted 758 seedlings at Hegg Lake WMA near experimental plot 7. We took fitness measurements, such as number of rosettes and leaf lengths, this year.
In addition to the experimental plot, we collected heads and tissue samples from 28 E. angustifolia that were near the restoration with E. pallida. We have not yet done any analysis on these plants but we are hoping to determine if hybridization in continuing.
Read more posts about this experiment here.
 Echinacea Pallida at Hegg Lake Start year: 2014
Location: Hegg Lake Wildlife Management Area – Experimental plot 9
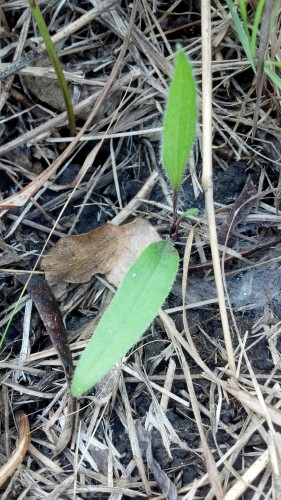
 A hybrid at Hegg Lake In 2015, we continued an experiment that quantifies fitness of Echinacea angustifolia x pallida hybrids and pure-strain plants. Out of the the original 522 plants, 323 were still alive in 2015, which is a survival rate of 62%. The mean leaf length of these plants was roughly 11.7 cm. Stuart planted the 522 seedlings at Hegg Lake WMA in spring 2013. The seedlings result from hand reciprocal crosses conducted by Shona Sanford-Long during the summer of 2012.
Read more posts about this experiment here.
Start year: 2013
Location: Hegg Lake Wildlife Management Area – Experimental plot 7
In 2015, we continued an experiment investigating fitness of Echinacea angustifolia x E. pallida hybrids. This year, out the the original 66 plants, 55 were still alive. That’s an impressive survival rate of 83% since they were planted in 2012. The mean leaf length of the plants was roughly 16 cm. In the summer of 2011, Nicholas Goldsmith and Gretel Kiefer performed reciprocal crosses between 5 plants of Echinacea pallida (non-native) found in a prairie restoration at the Hegg Lake Wildlife Management Area and 31 plants of the native Echinacea angustifolia from experimental plot 1 to determine the hybridization potential of these two species. In the summer of 2012, team members planted 66 seedlings.
Read more flog posts about this experiment here.
Echinacea Pallida on Hegg Lake Start year: 2012
Location: Experimental plot 6
On this day inaugural National Citizen Scientists’ Day, we acknowledge the hard-work and dedication of our team of Citizen Scientists in the Echinacea Project’s lab the Chicago Botanic Garden. Some of the citizen scientist members of our Team have been working on the project almost 15 years!
Read profiles of our fabulous citizen scientist Team members:
Aldo — — Anne — — — Art — — — Bill
Bob — — Char — — — Kathryn — — Laura
Leslie — — Lois — — — Lou — — — Marty
Naomi — — Shelley — — Suzanne — — Susan
Two humble volunteers declined to have profiles posted. We respect their privacy.
Read about some of the ways in which they contribute.
Read about what some of the activities from this past week.
Read many flog posts about our volunteer citizen scientists as written by members of Team Echinacea.
|
|