|
|
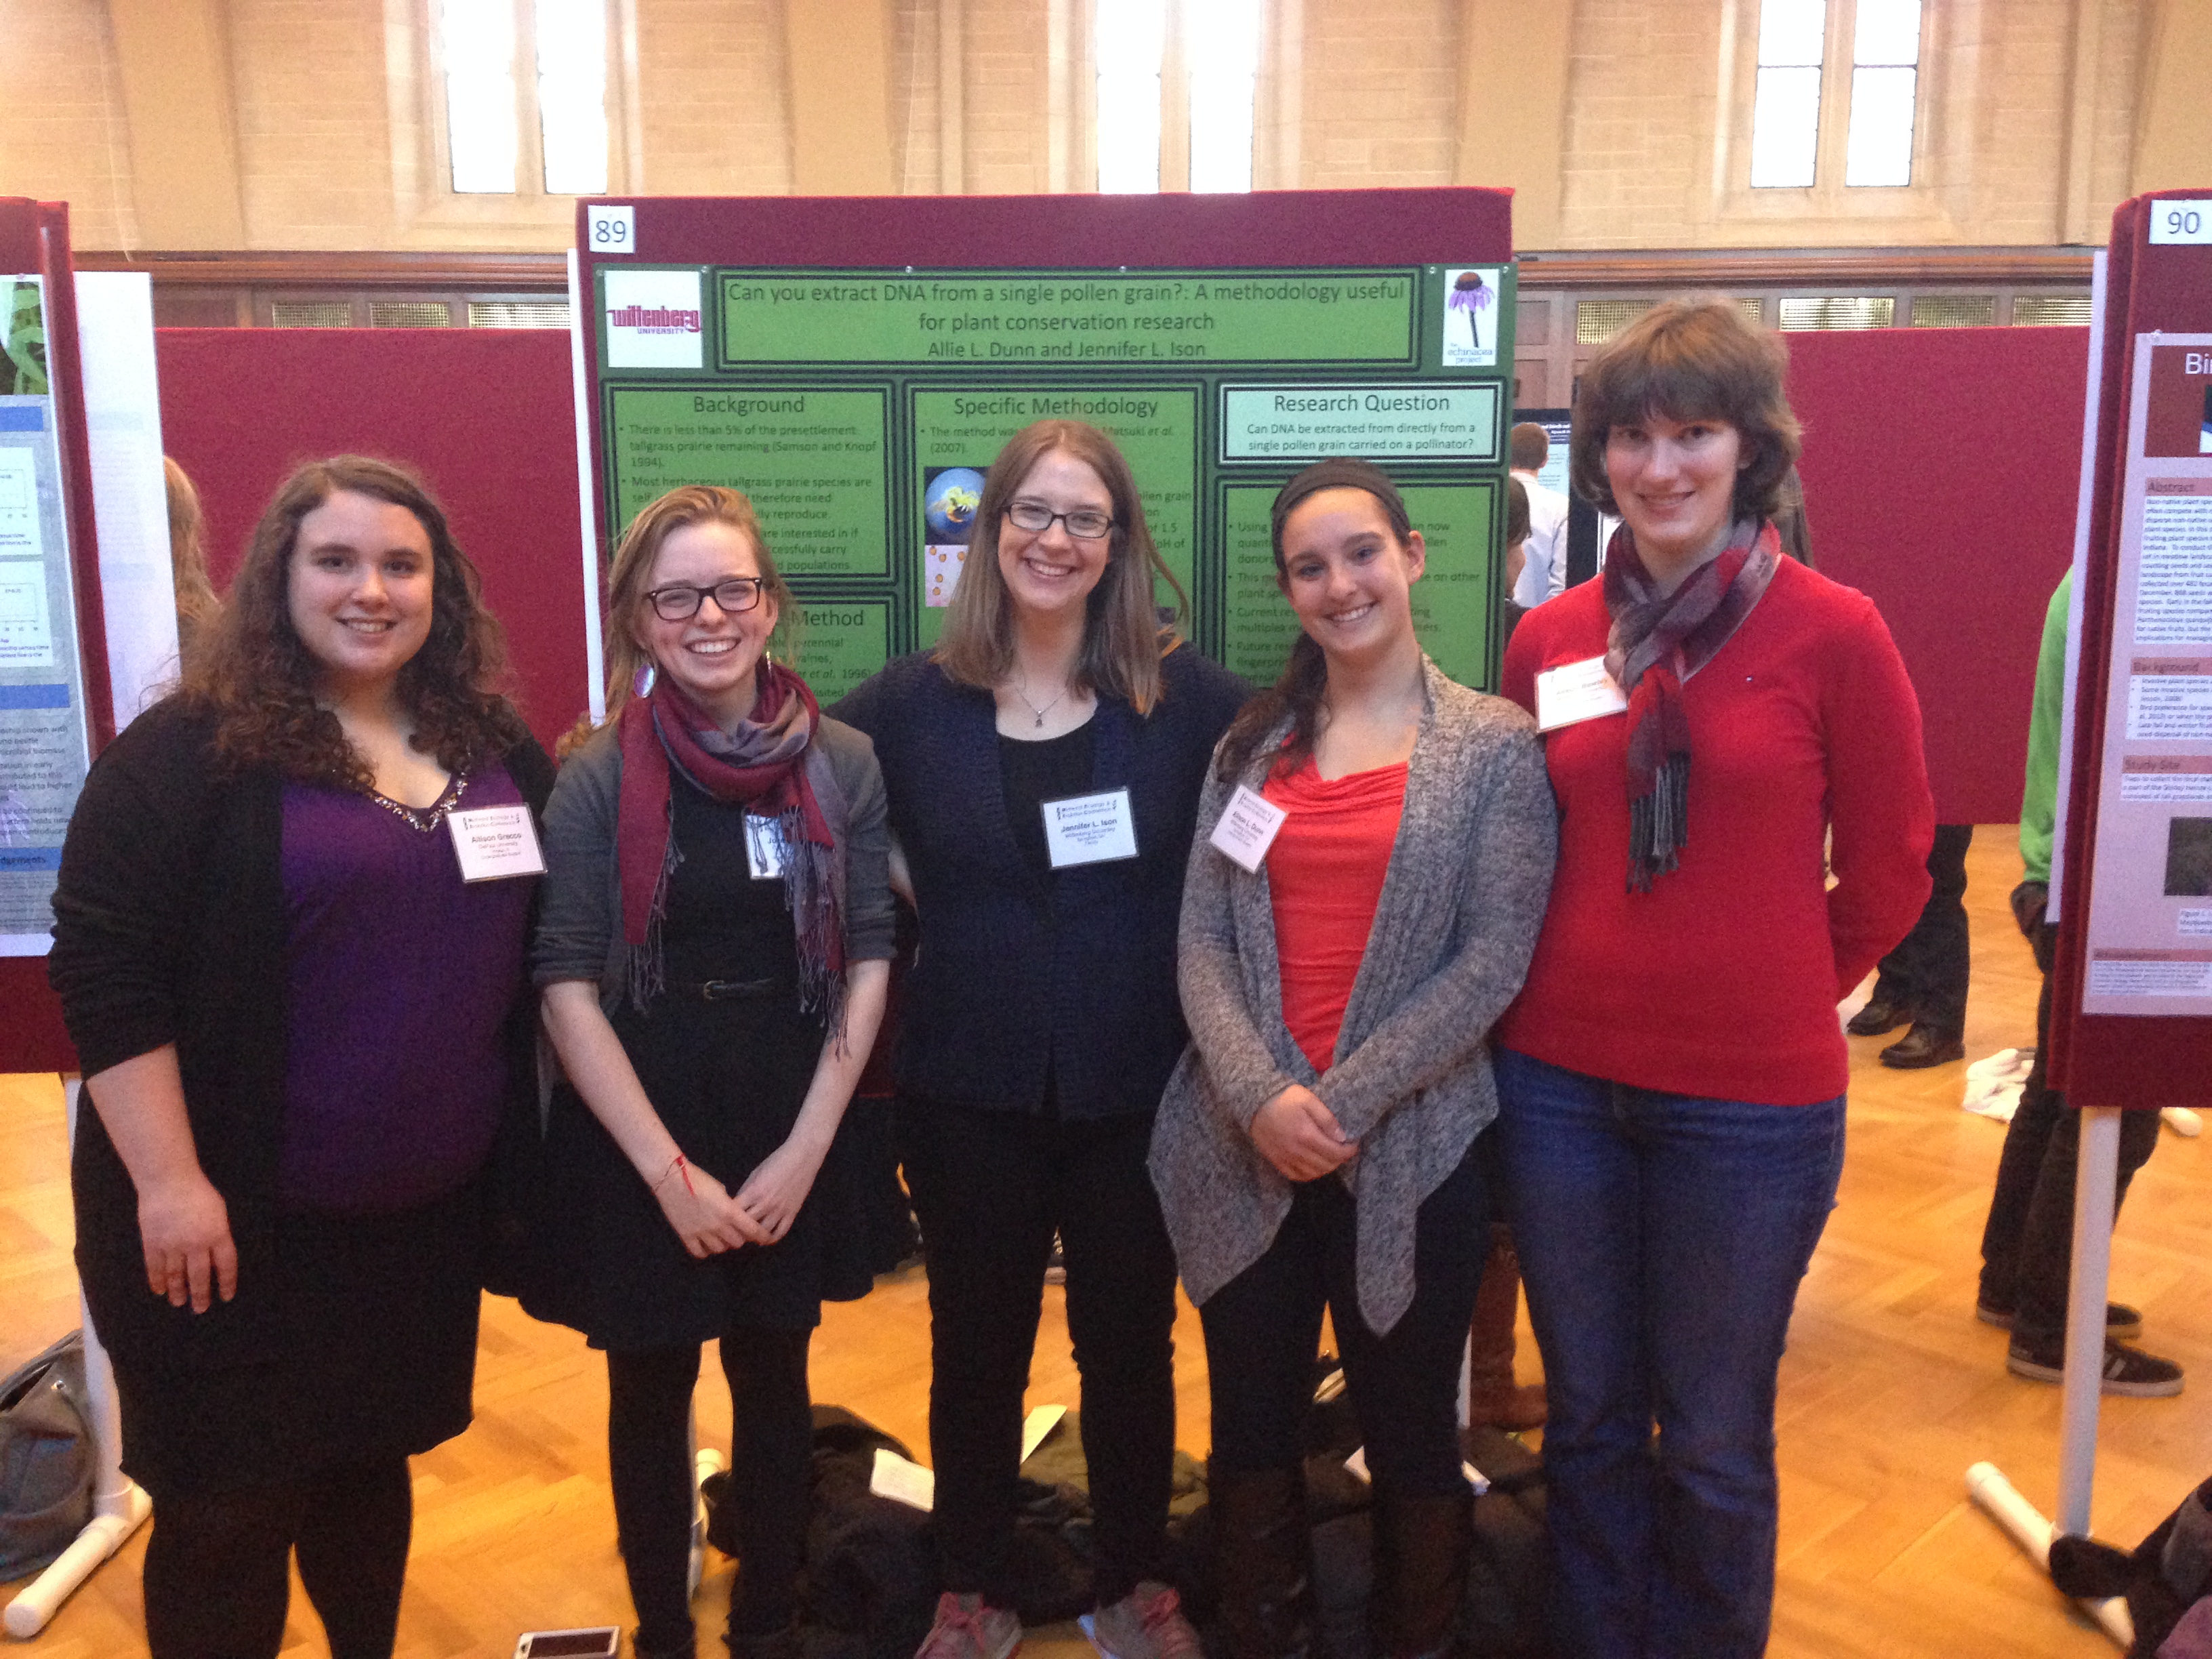
Team Echinacea made a great showing at MEEC — The 2015 Midwest Ecology and Evolution Conference. Members of the team gave great presentations and learned a lot from the other presenters. When Stuart gets back from vacation he will post Allie’s poster, Josie’s poster, and Alison’s presentation.
 Team Echinacea at MEEC 2015:
Alli Grecco, Jocelyn York, Jennifer Ison, Allie Dunn, Alison Bewley
We are in the process of reviewing many excellent applications for research internships. Thanks to references who sent in letters of recommendation! Thanks to all applicants–we will contact you soon.
Meanwhile, Jared has returned for a field trip to California, Stuart finished grading final papers, we are preparing for the SER meeting, and our citizen scientists continue clean heads, count achenes, and take random samples for x-raying. Yay team!
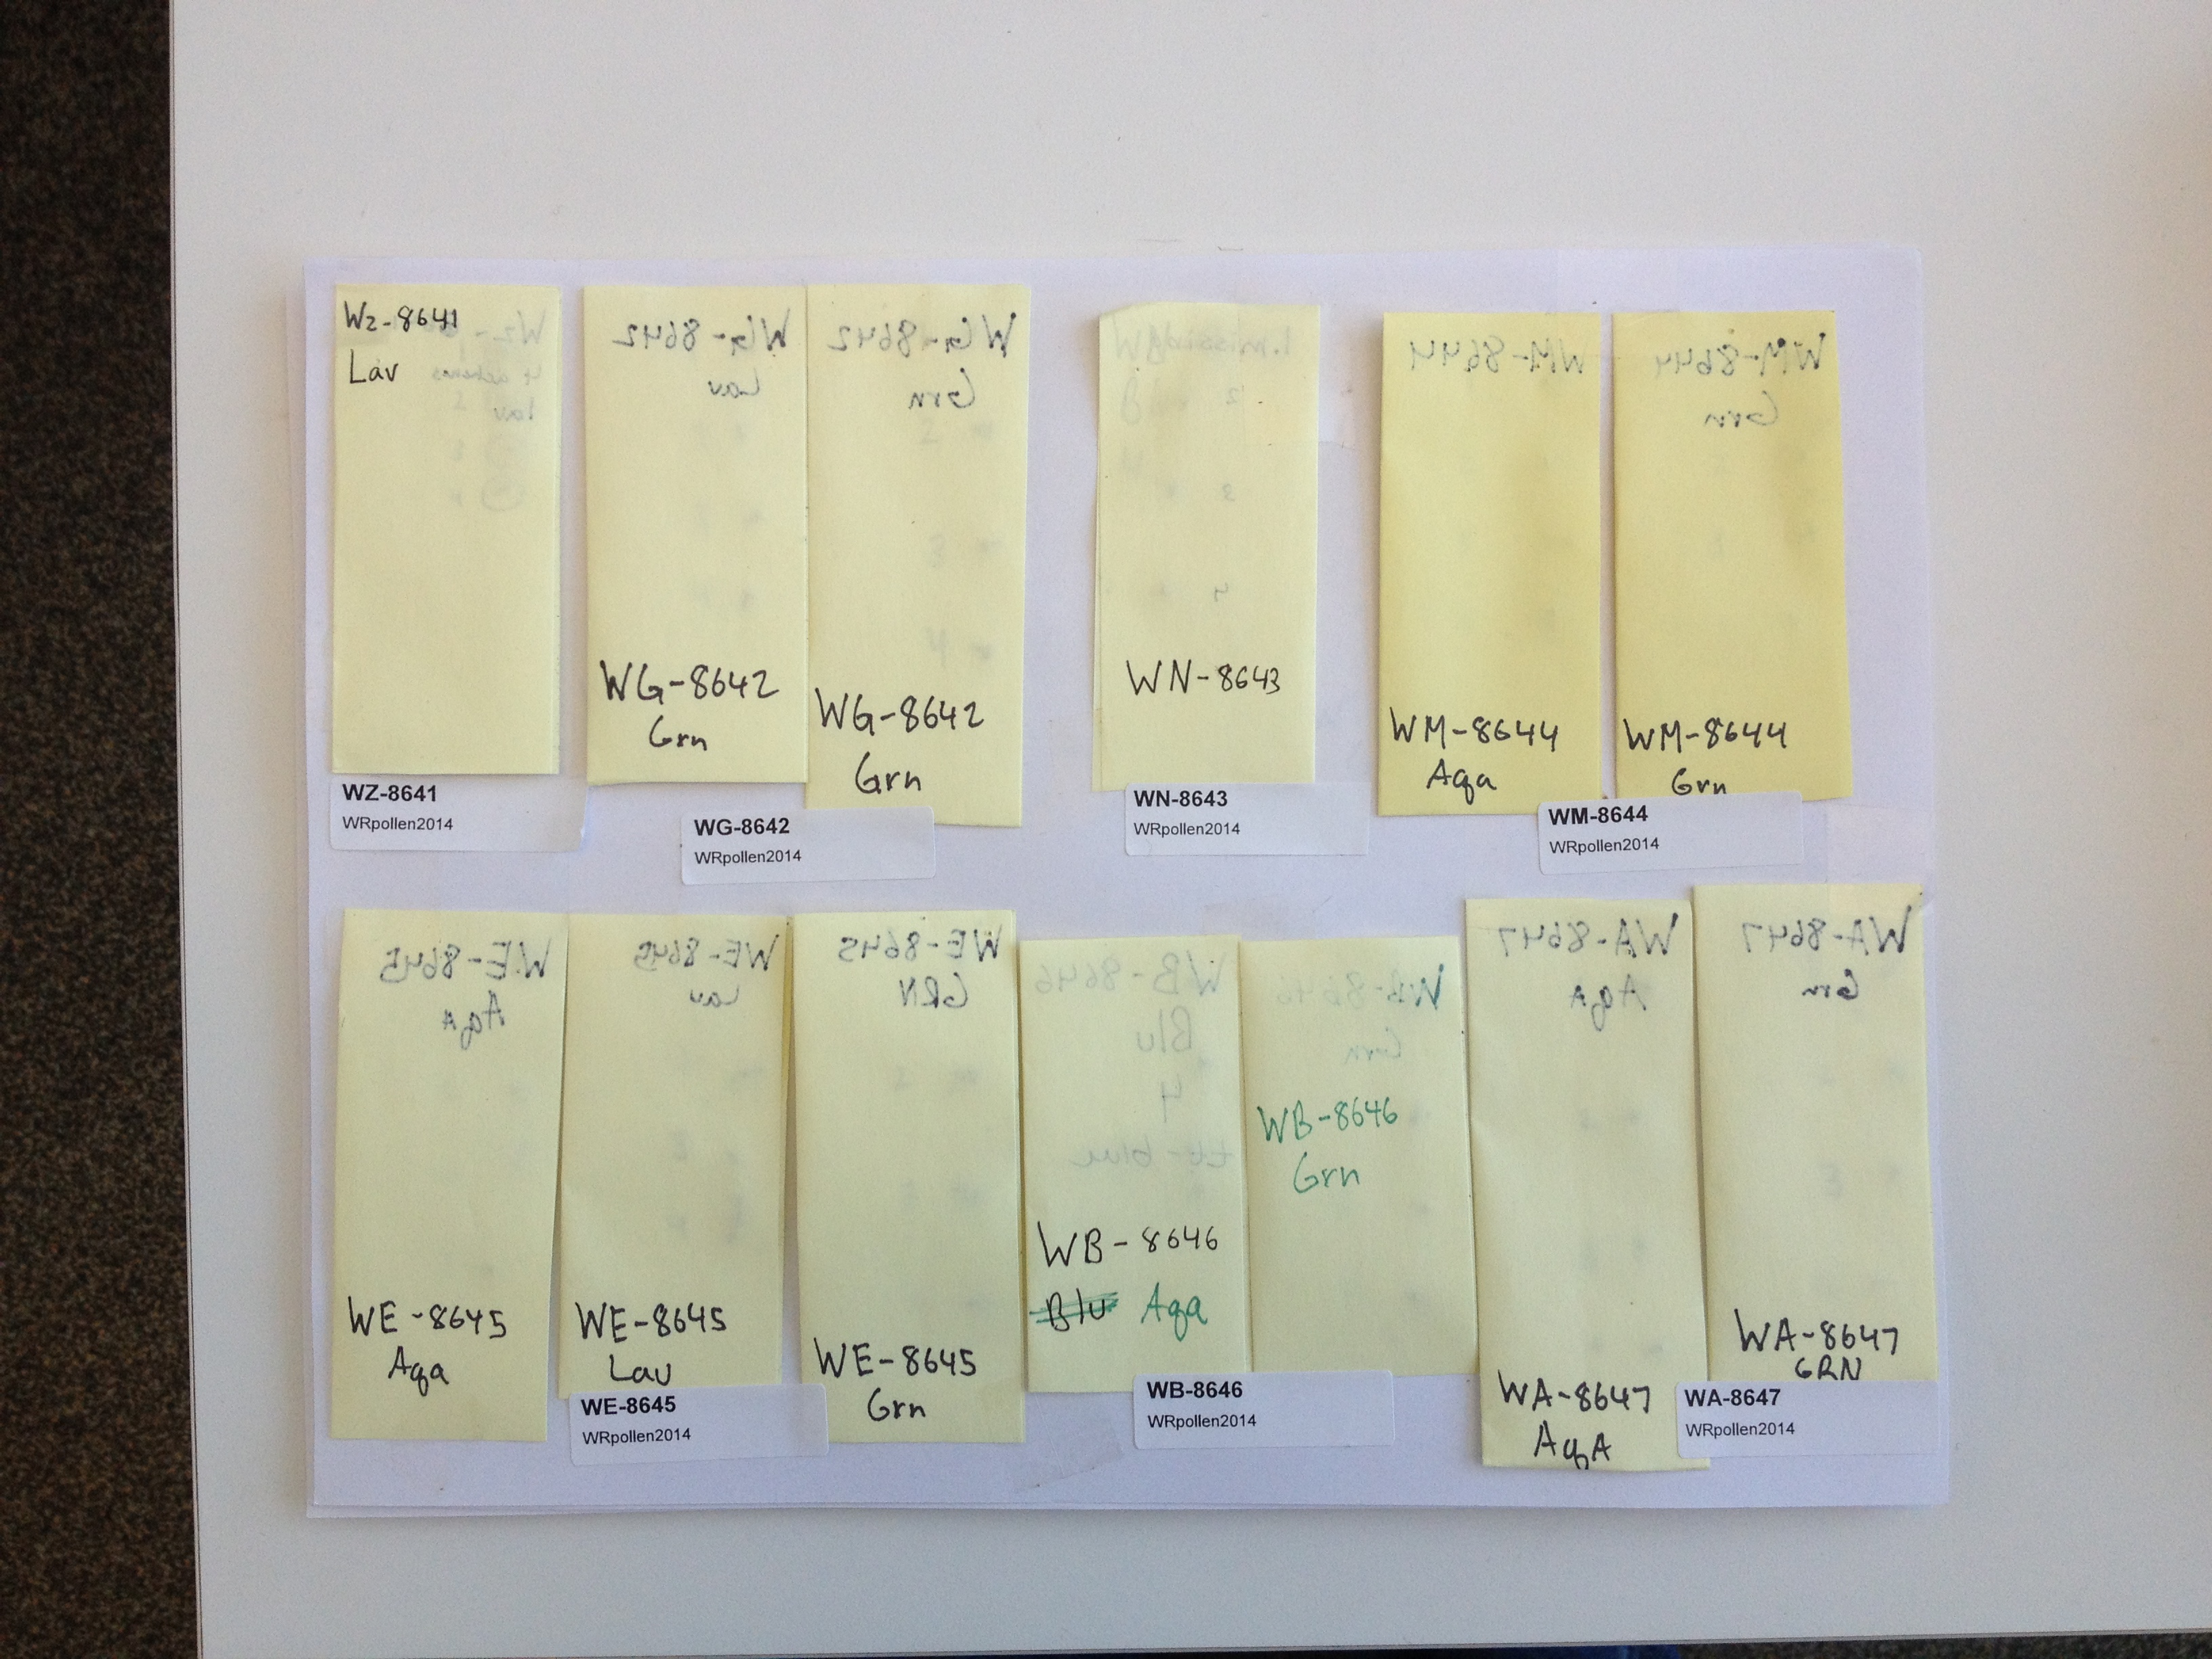
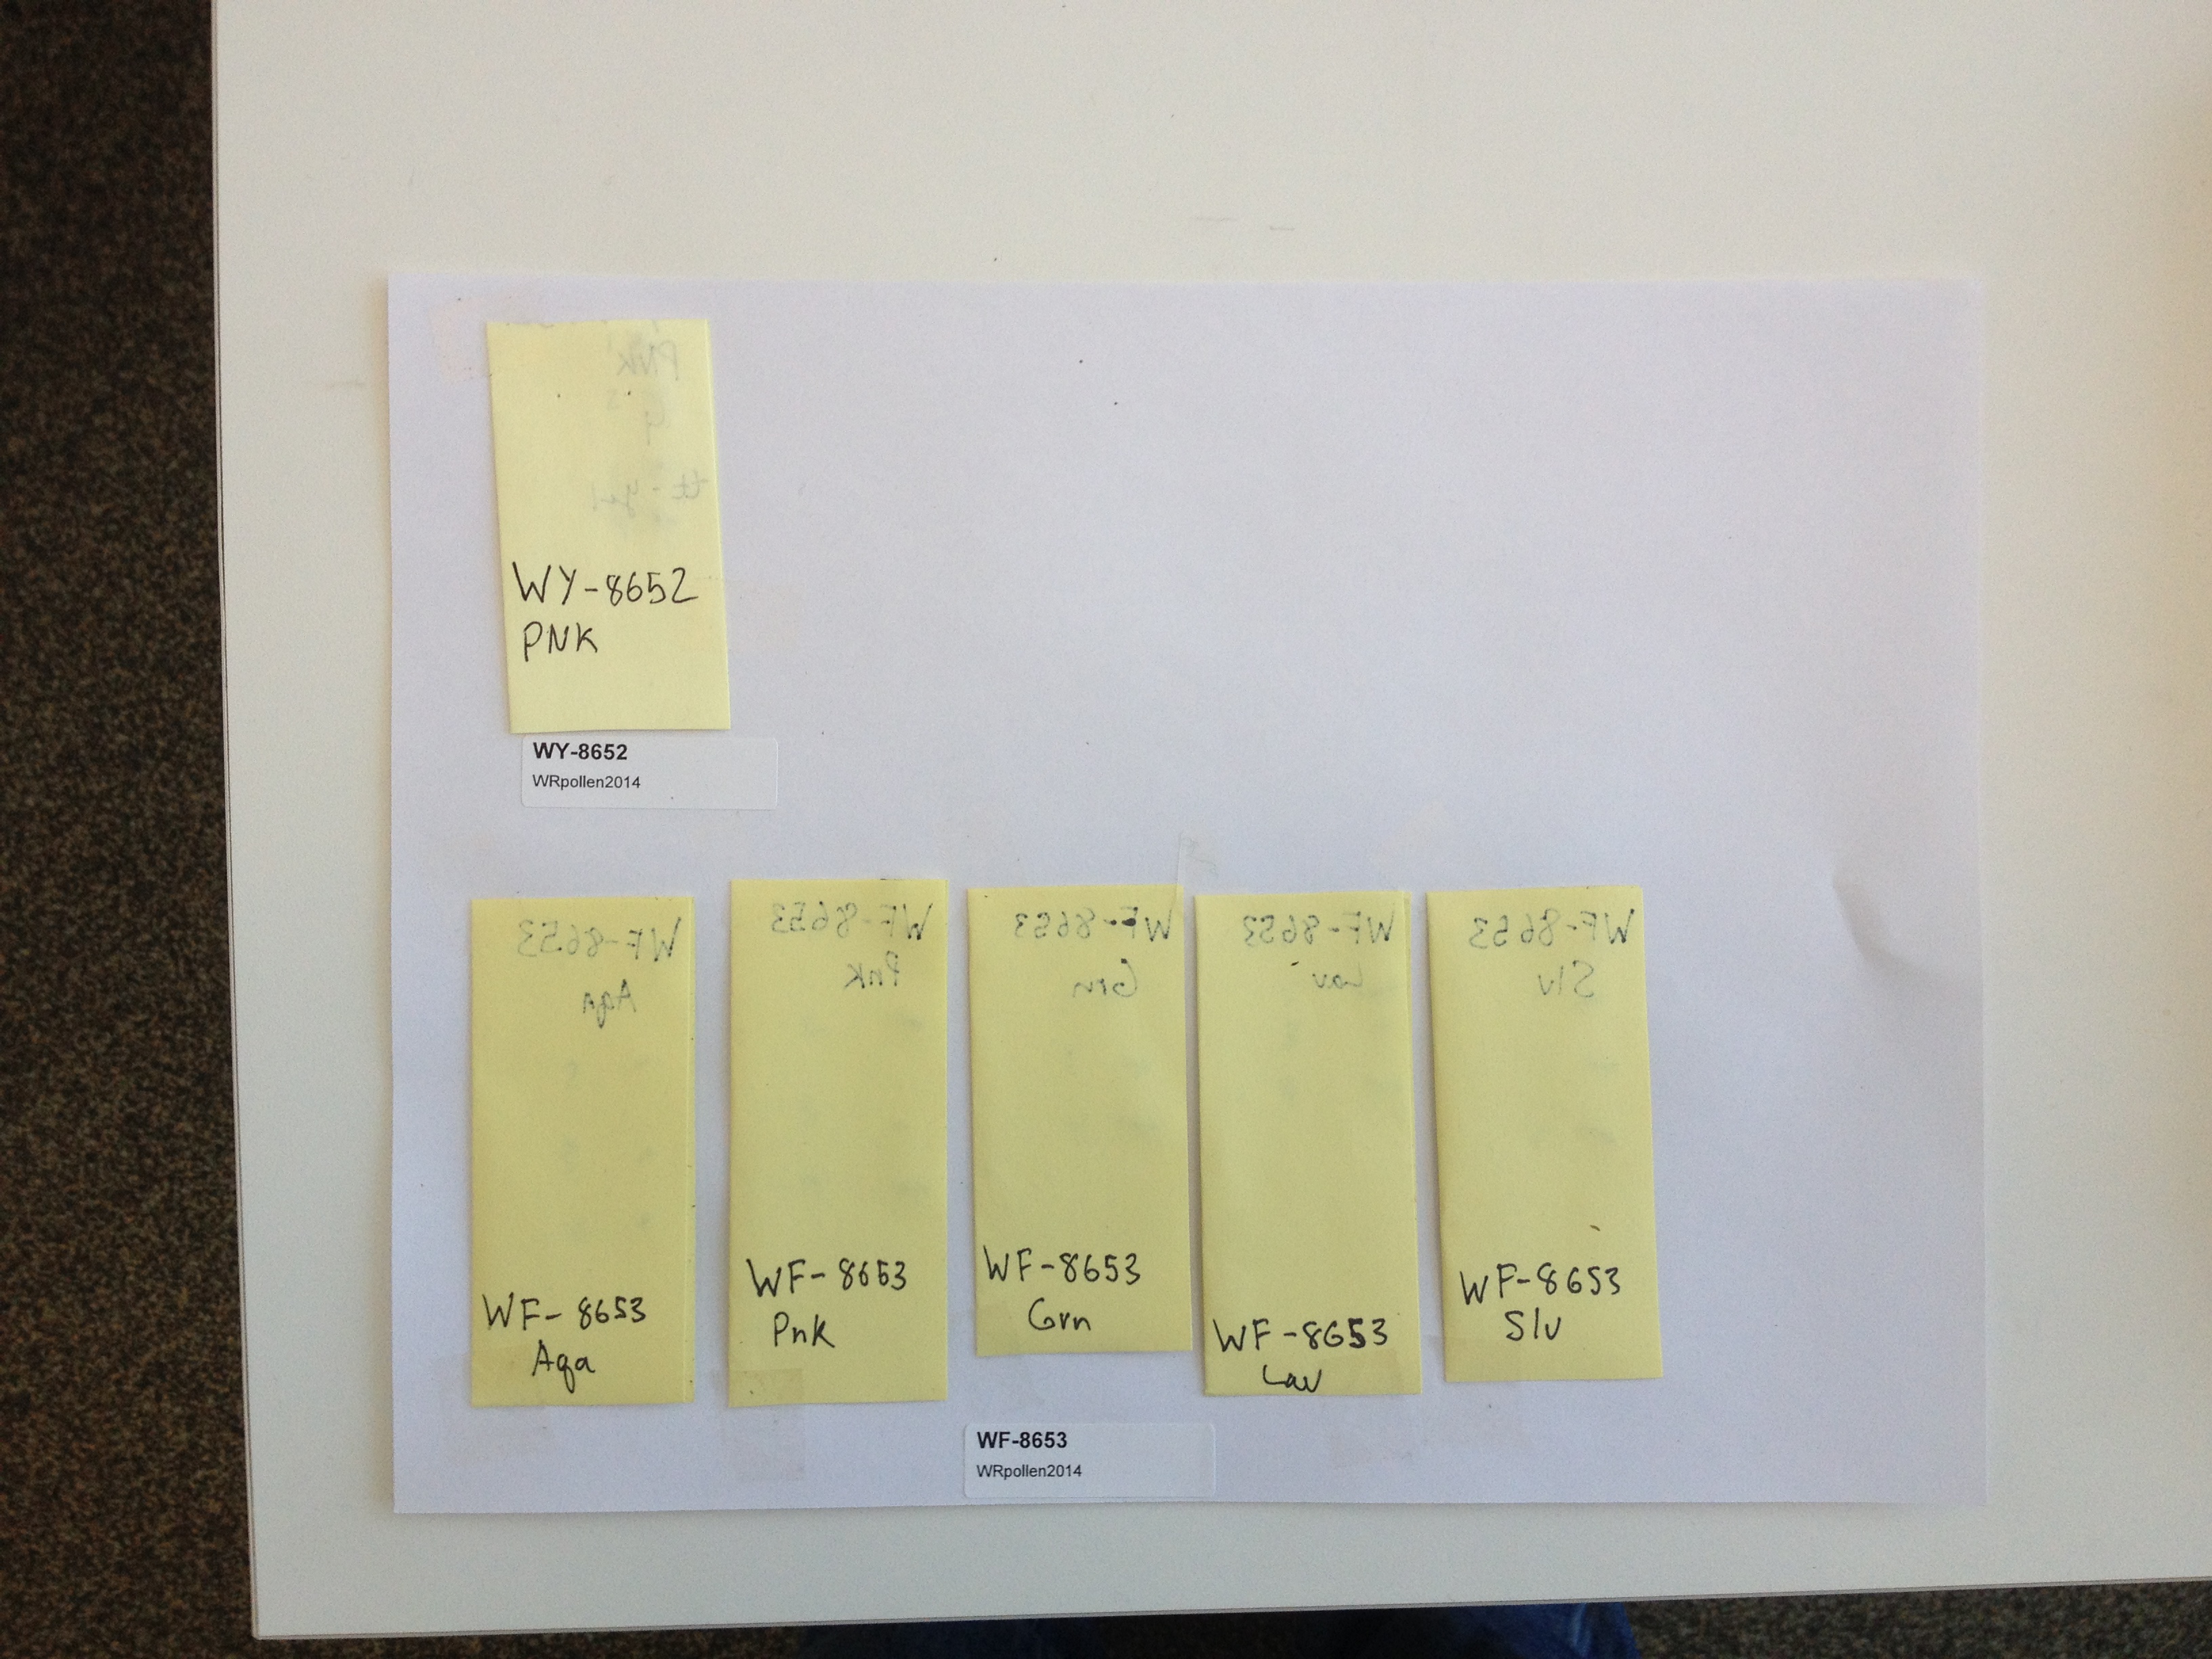
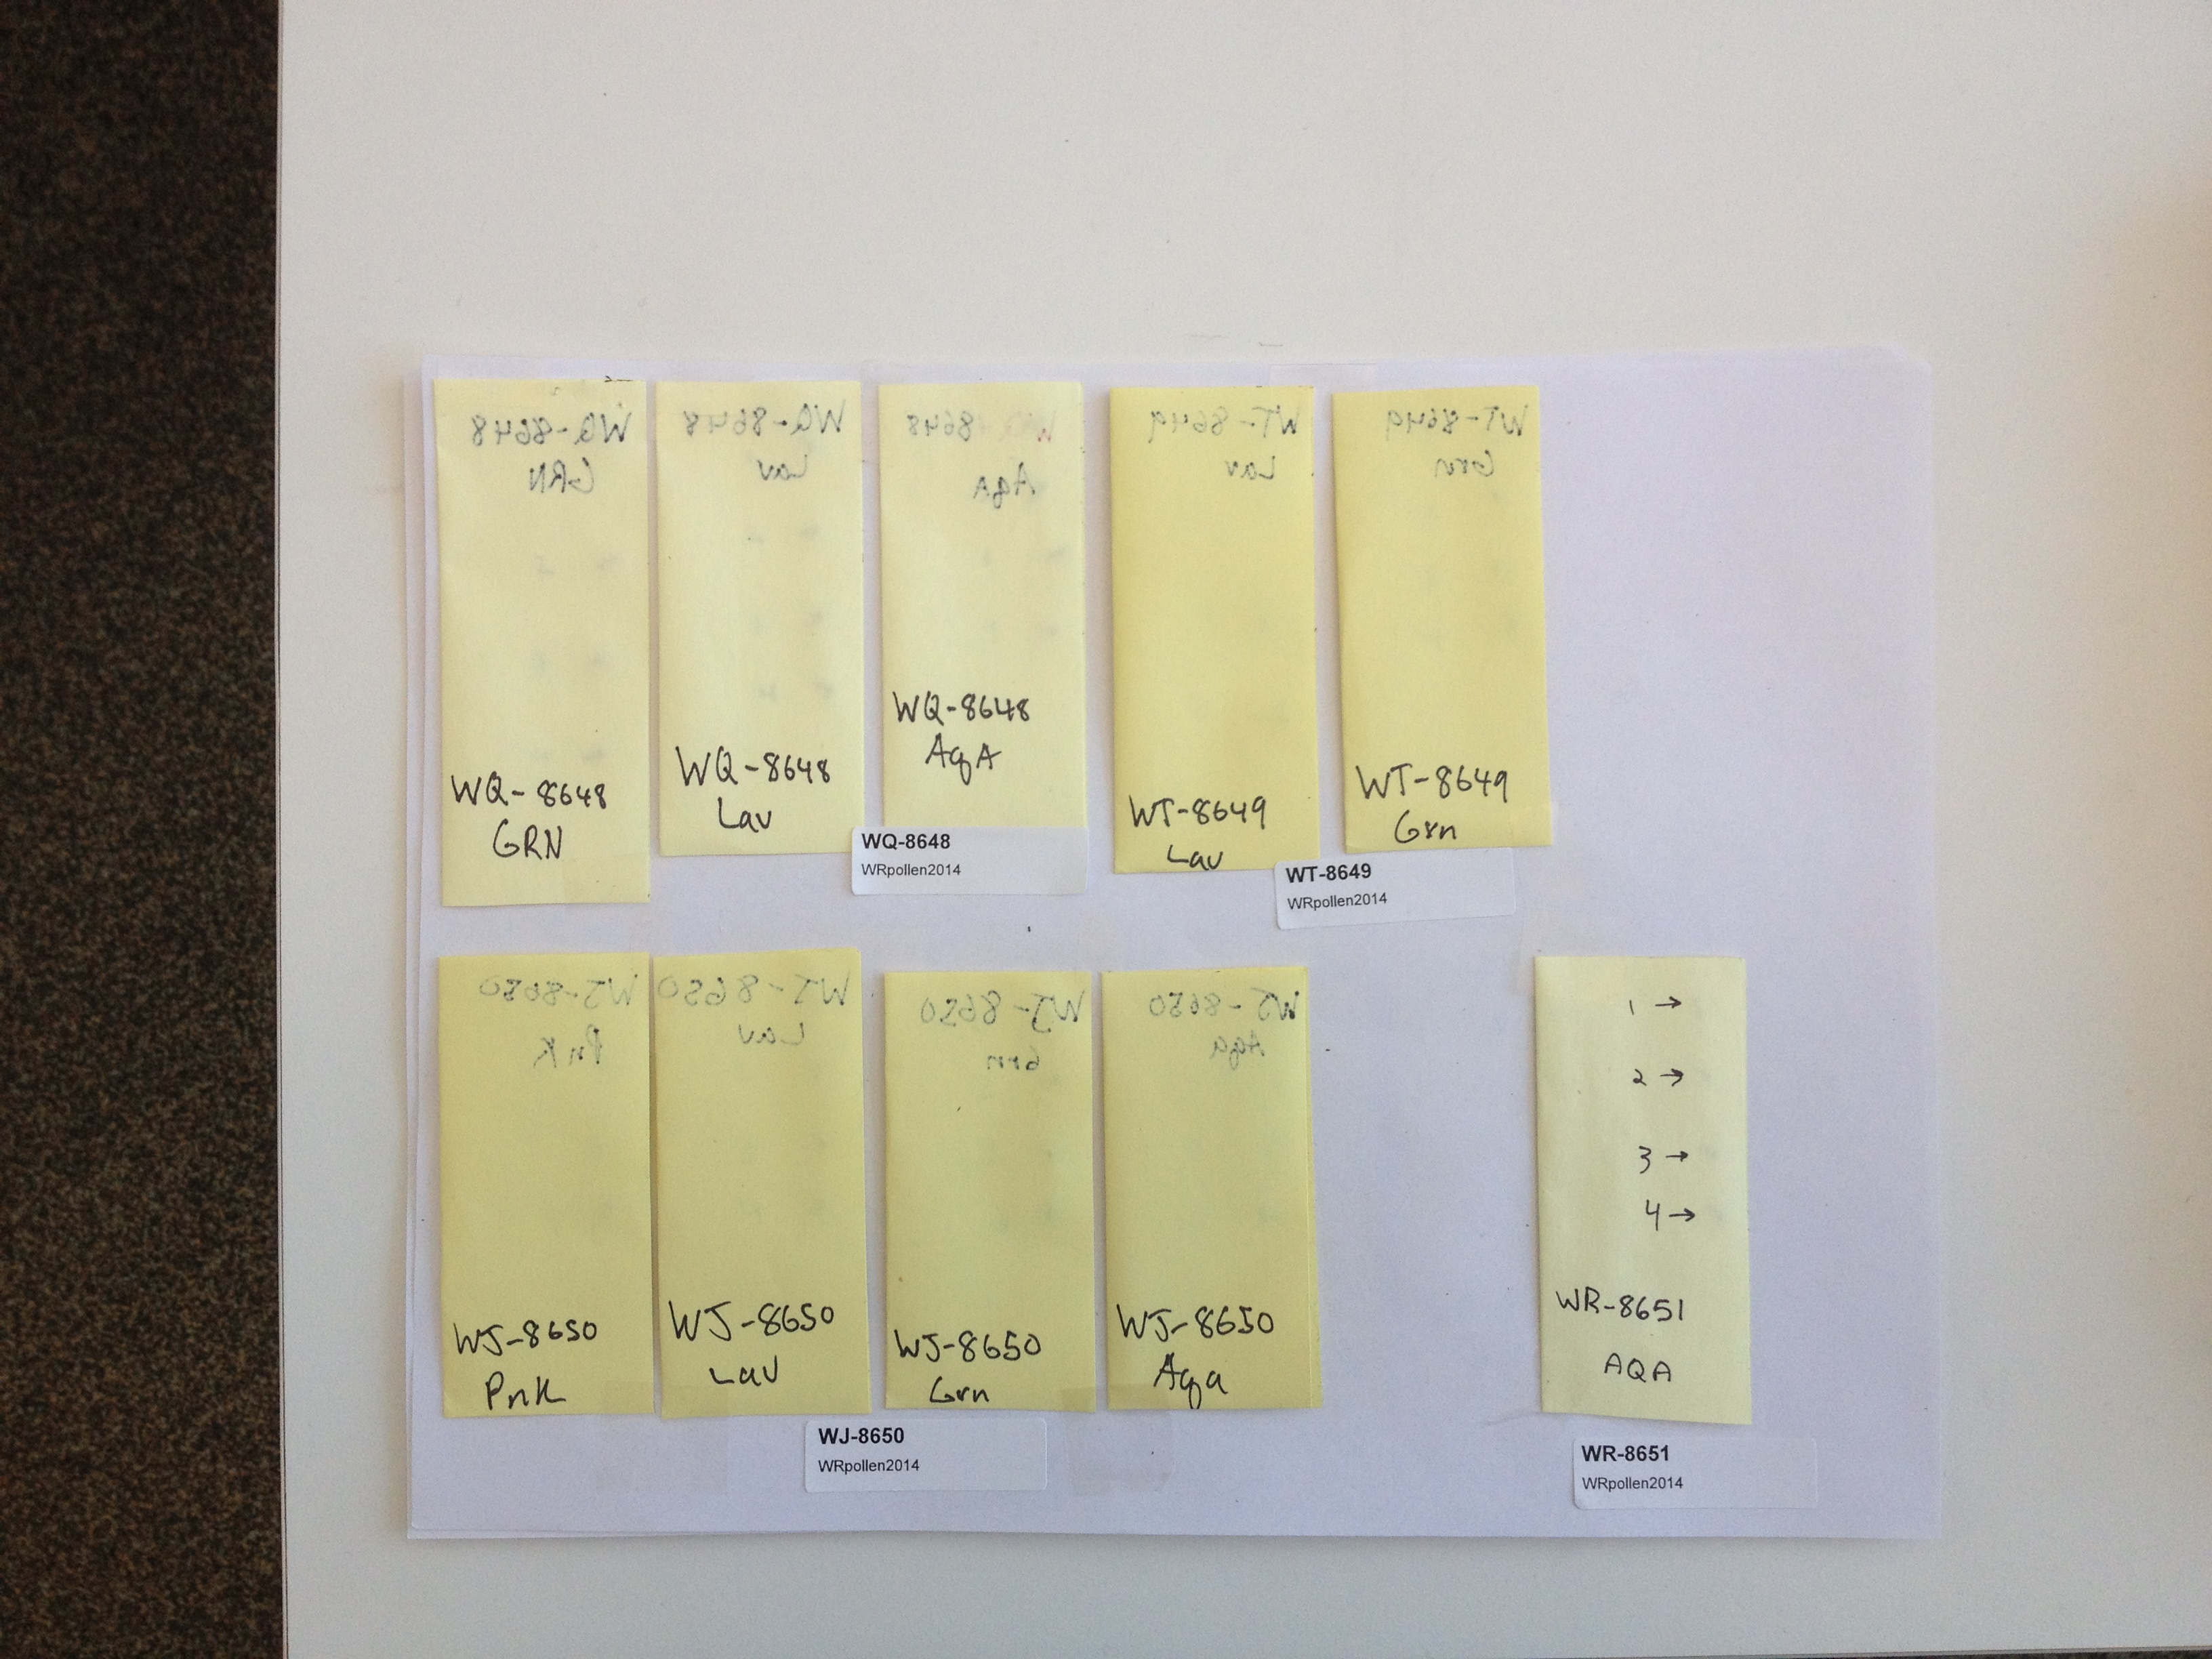
Photos of the sheets of sticky notes containing achenes (Echinacea fruits) that Will dissected at the U of Minnesota and that Jared will x-ray at the Chicago Botanic Garden this afternoon.
Will used freeze-dried pollen to pollinate the flowers that produced these fruits. During the summer styles of those flowers shriveled shortly after Will deposited pollen, providing evidence that the pollen was still alive. More backstory.
Do these these achenes contain embryos? We’ll find out this afternoon.
Live Science in real time!

We are starting to review applications for summer research internships for undergraduates (REU). Get your application in! We’ll accept applications until positions are filled.
Apply!
https://echinaceaproject.org/summer-reu-internship-2015-ech/
In our lab we use UTHSCSA ImageTool to count thousands and thousands of achenes (fruits) every year on thousands of images. It has a straightforward interface and easily does exactly what we want: click cursor on an achene, a dot appears on the achene and the counter increments by one, click cursor on next achene, a new dot appears, counter increments, repeat until all achenes are tagged, then read the counter. Voila!
We are now going to classify achenes in x-ray images as full, partially full, or empty. We need software with the capability to tag three colors and make three separate counts per image. However, we don’t need software that is complicated, and can do everything. We want software that can do this one thing efficiently.
ImageJ will work, but it is clunky, taking many steps to set up the counting on each image. Can anyone recommend software suitable for our needs?
I found a few software packages to investigate, listed below, but would appreciate any advice or leads on other software.
http://fiji.sc/Welcome
http://marvinproject.sourceforge.net/en/index.html
http://itk.org/
http://imglib2.net/
http://imagej.net/ImageJ2
http://www.jmicrovision.com/
http://loci.wisc.edu/software/imagej
http://meesoft.logicnet.dk/Analyzer/
http://icy.bioimageanalysis.org/
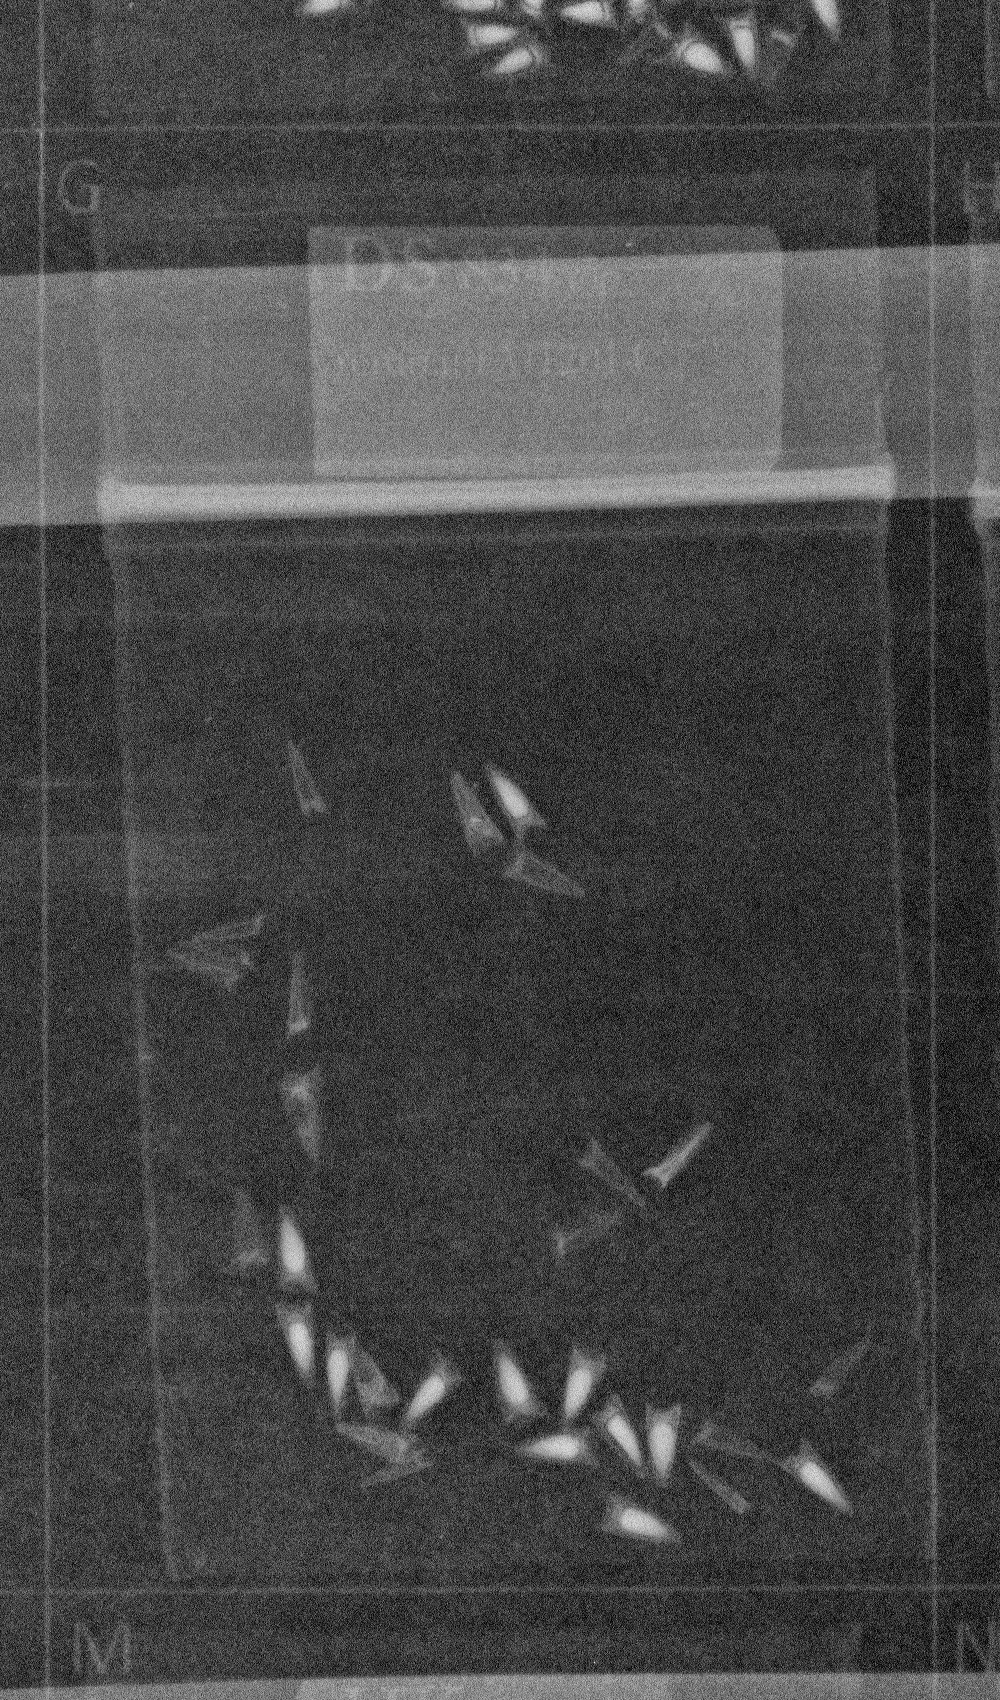
Click to enlarge the below images.
 X-ray image of Echinacea achenes
We count 12 full, 18 empty, and zero partially filled fruits (achenes).
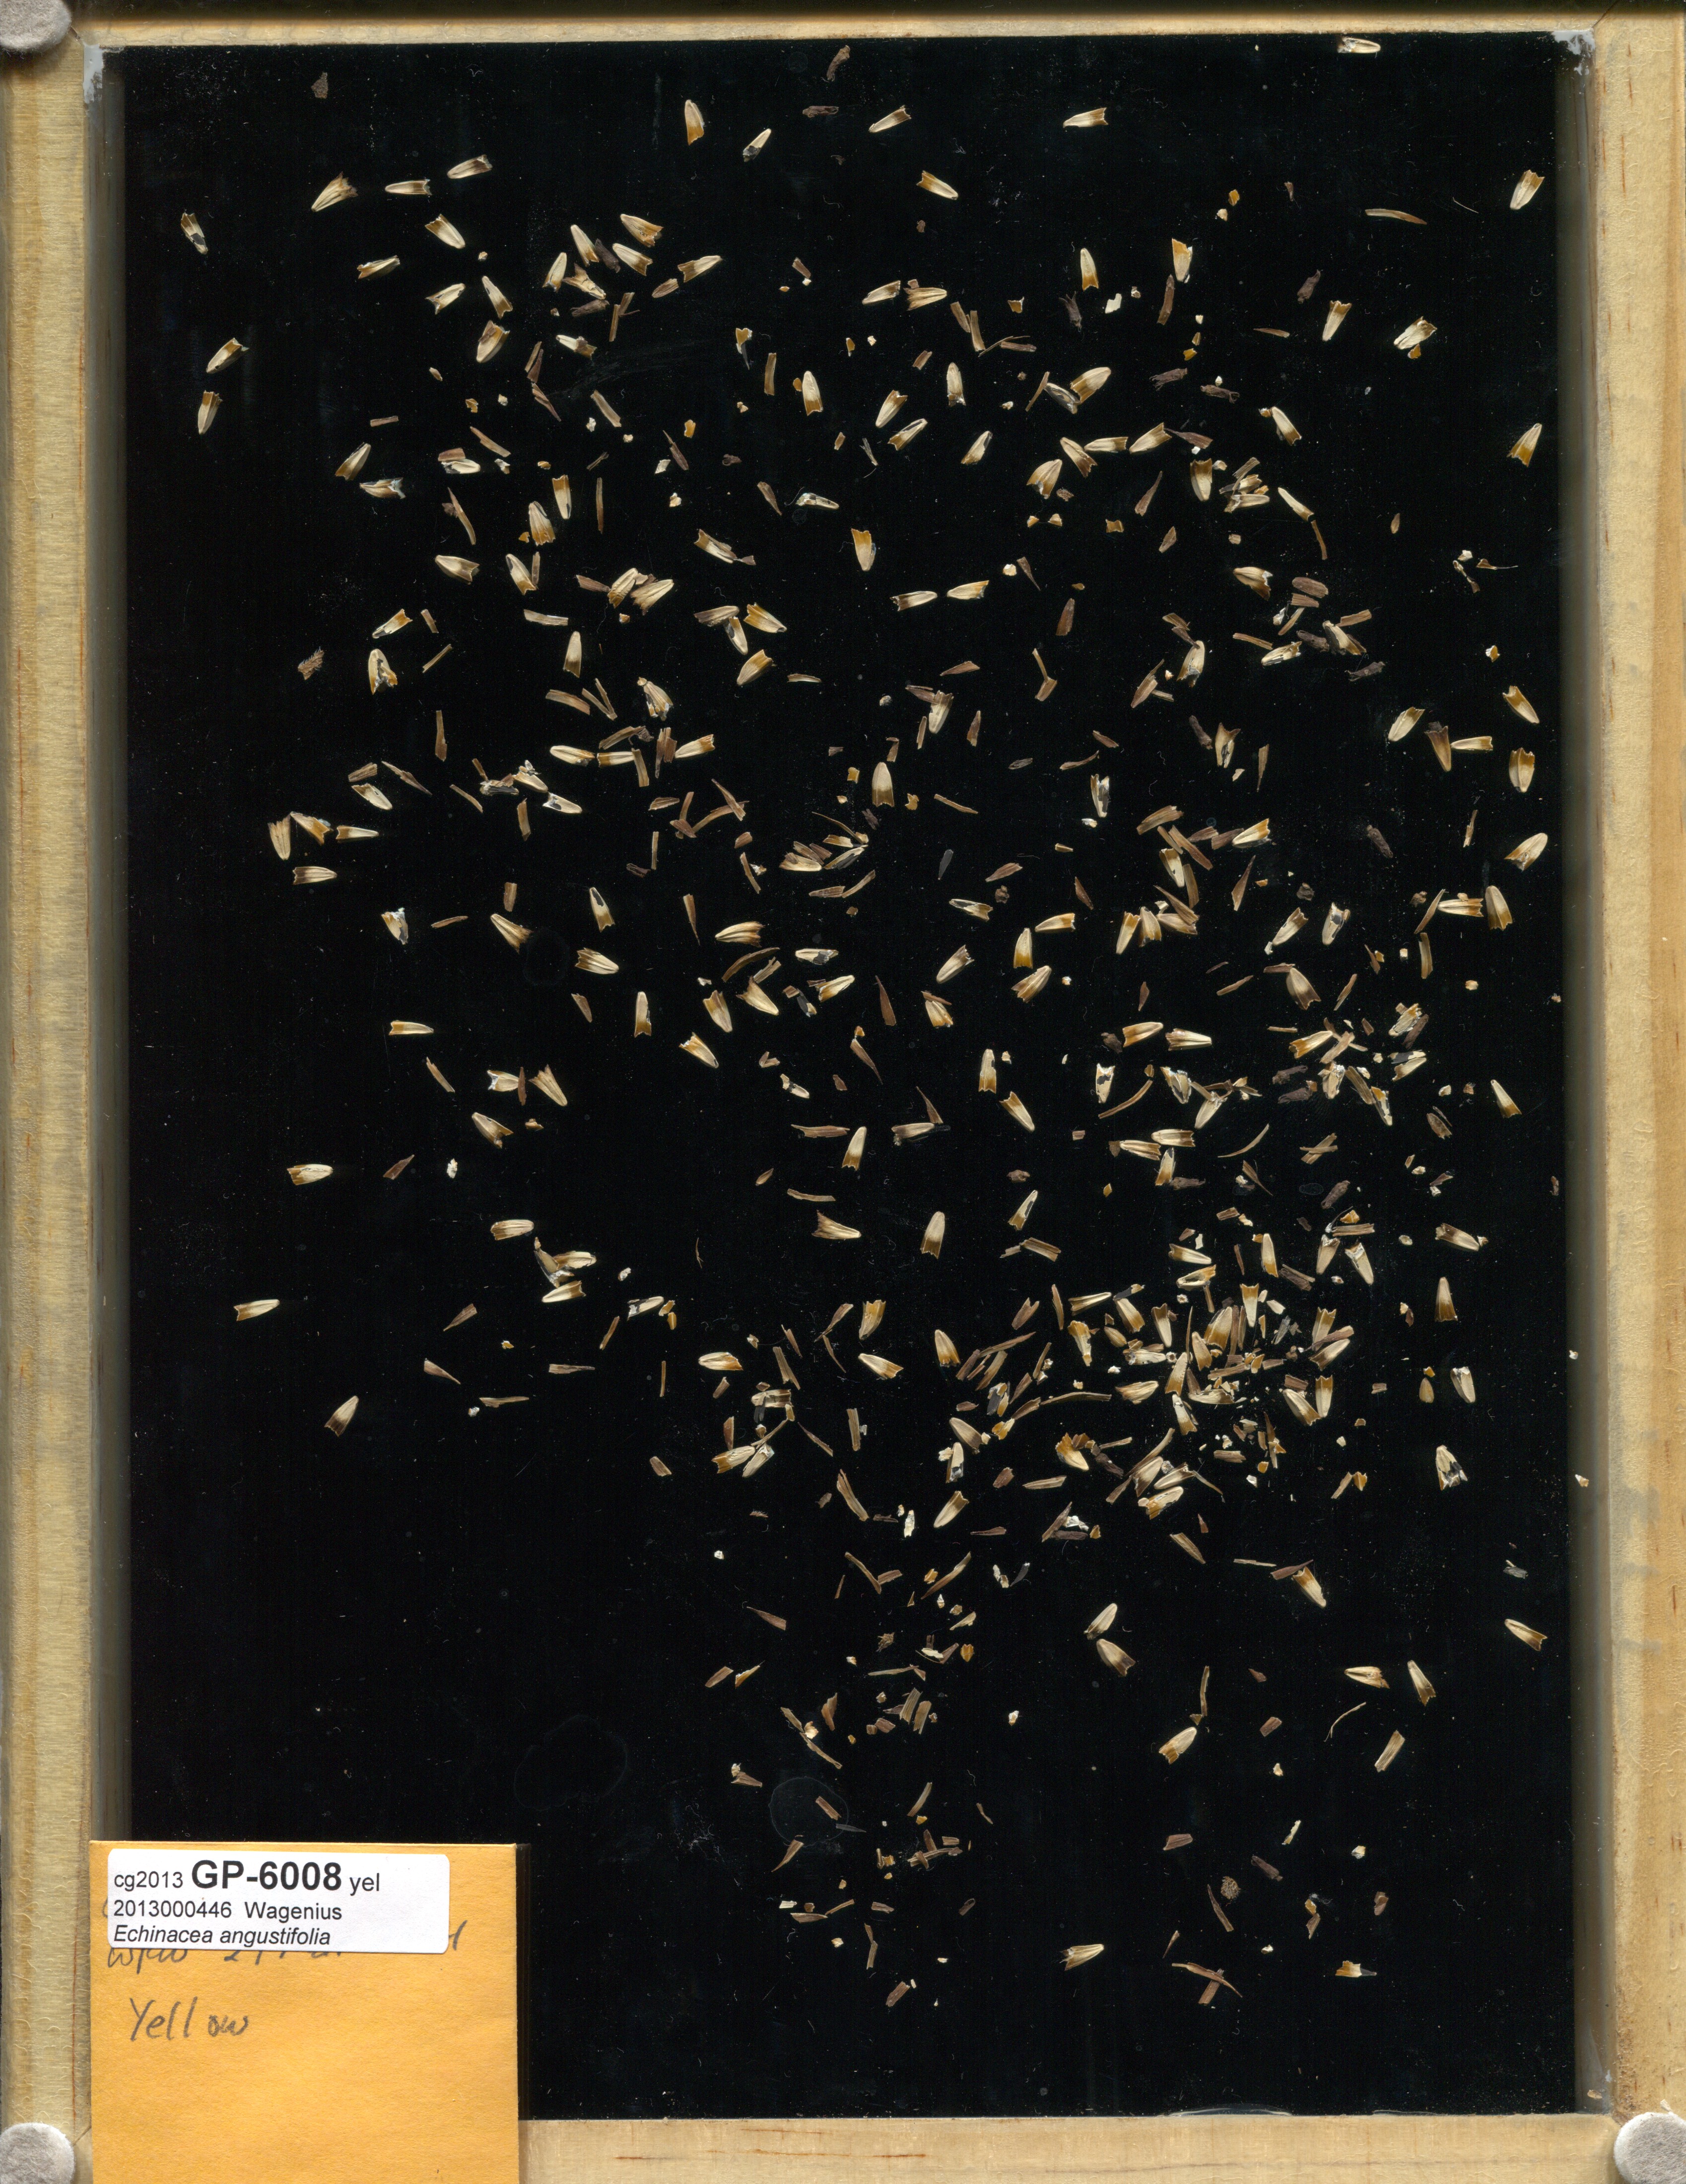
 Image of all achenes from Echinacea head GP-6008
How many achenes do you count?
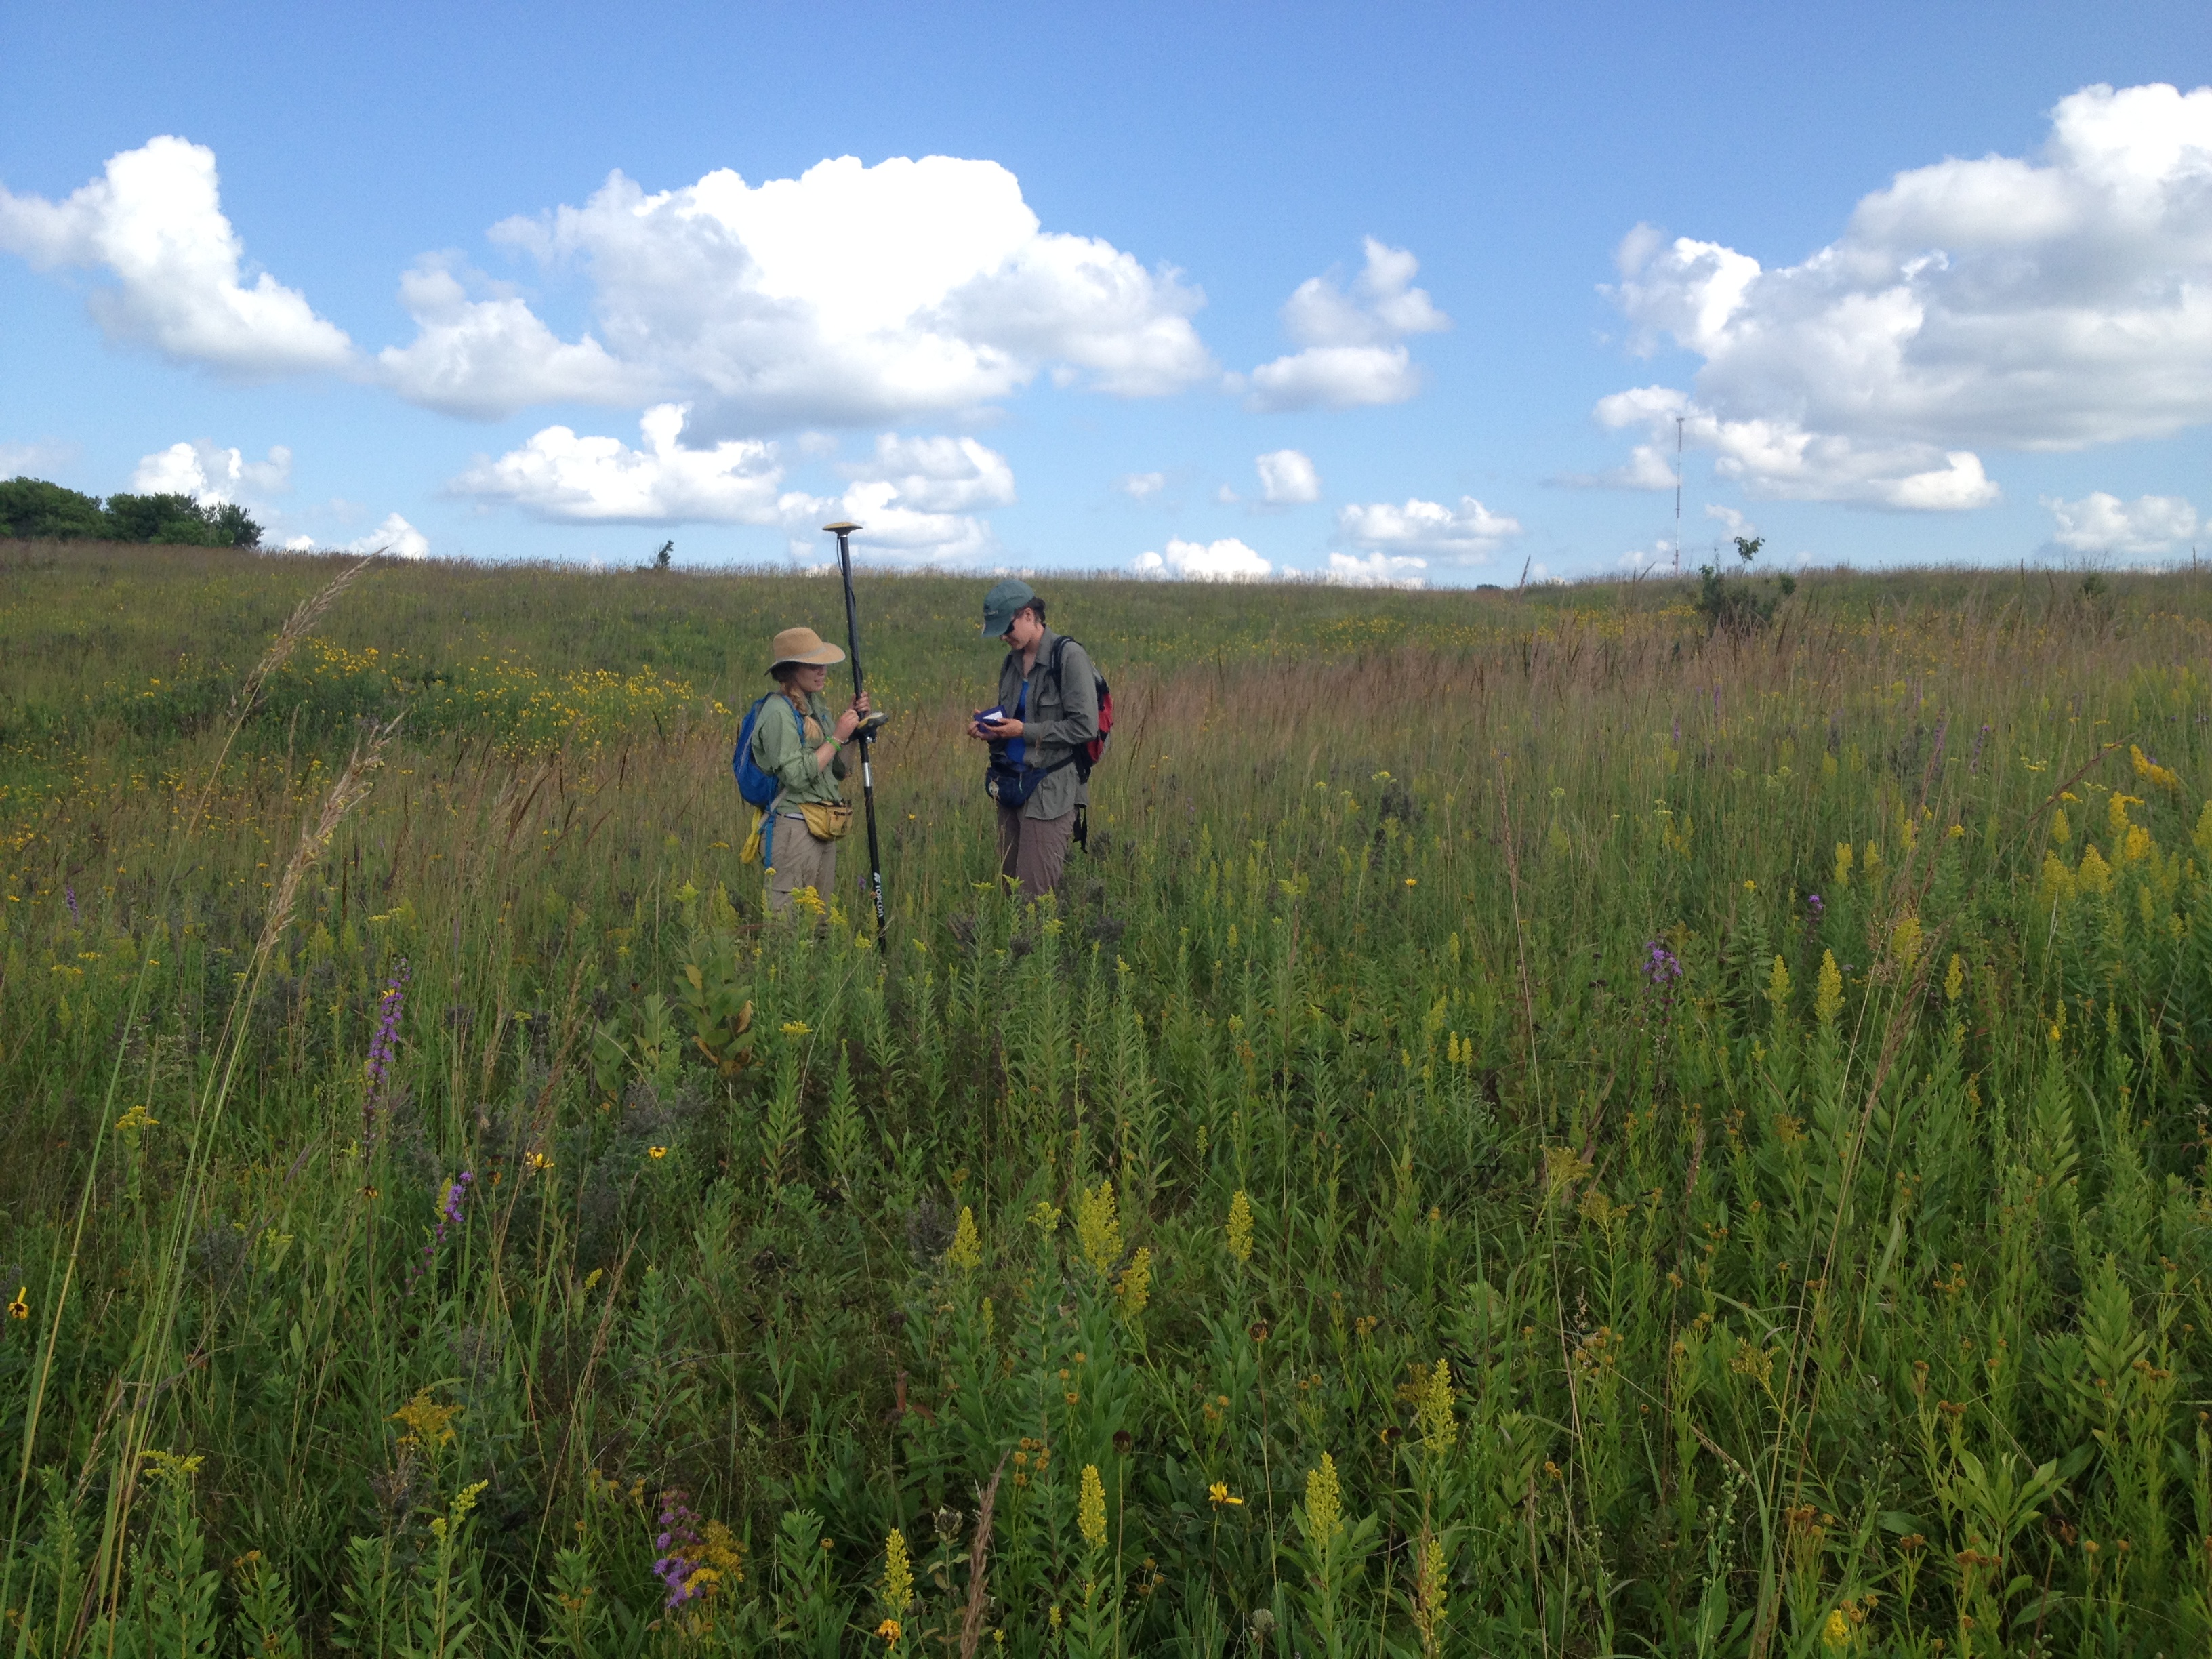
This project builds on the Echinacea Project’s longitudinal demographic dataset from remnant prairies to explore the role fire plays in the reproduction of Echinacea angustifolia. In 2014, Claire Ellwanger and Jared Beck monitored the daily phenology of 324 flowering heads belonging to 143 plants that flowered in 2014 and gathered demographic information on 523 individuals within burned and unburned portions of Staffanson Prairie Preserve. Additionally, we collected 84 flower heads to assess seed set in 2014. Using this data and the data collected in previous years, we will integrate spatial, phenological, and demographic information from individuals at Staffanson Prairie to build a longitudinal database and evaluate the effects of prescribed fire on Echinacea survival and reproduction.
Our methods for collecting demographic and phenological data were identical to the procedures used in the projects “EA demo”, “phen in six remnants,” and “phen for Aii” except that we mapped nearest flowering neighbors. We mapped out to the 7th nearest flowering neighbor for focal plants on the SPP transect. Jared wrote an R function (looky) to streamline searching for nearest neighbors in the field. This function specifies a search radius and creates a map of all mapped flowering plants for a given site within that search radius. In addition to using looky, we targeted our searches near the edges of Echinacea clusters and where there were known Echinacea plants near the transect to increase the efficiency of our searches.
Read previous posts about this experiment.
Start year: 2007
Location: Staffanson Prairie Preserve
Products: Survey, demography, phenology, and style persistence datasets need to be made readyR. The Echinacea heads collected in 2014 are being processed at the Chicago Botanic Garden.
Overlaps with: EA demo, phen in six remnants, and phen for Aii
Description: In 2014, Alli Grecco developed and implemented a project to characterize the composition and abundance of plants that flower in 5 remnant prairie Echinacea populations. During her community surveys, Grecco identified 32 co-flowering species. This dataset will be used to describe variation in flowering communities both between and within sites over time.
Start year: 2014
Location: SPP, NWLF, EELR, ALF, NNWLF
Products: Preliminary dataset is located in Alli Grecco’s Dropbox folder. Dataset needs to be made readyR.
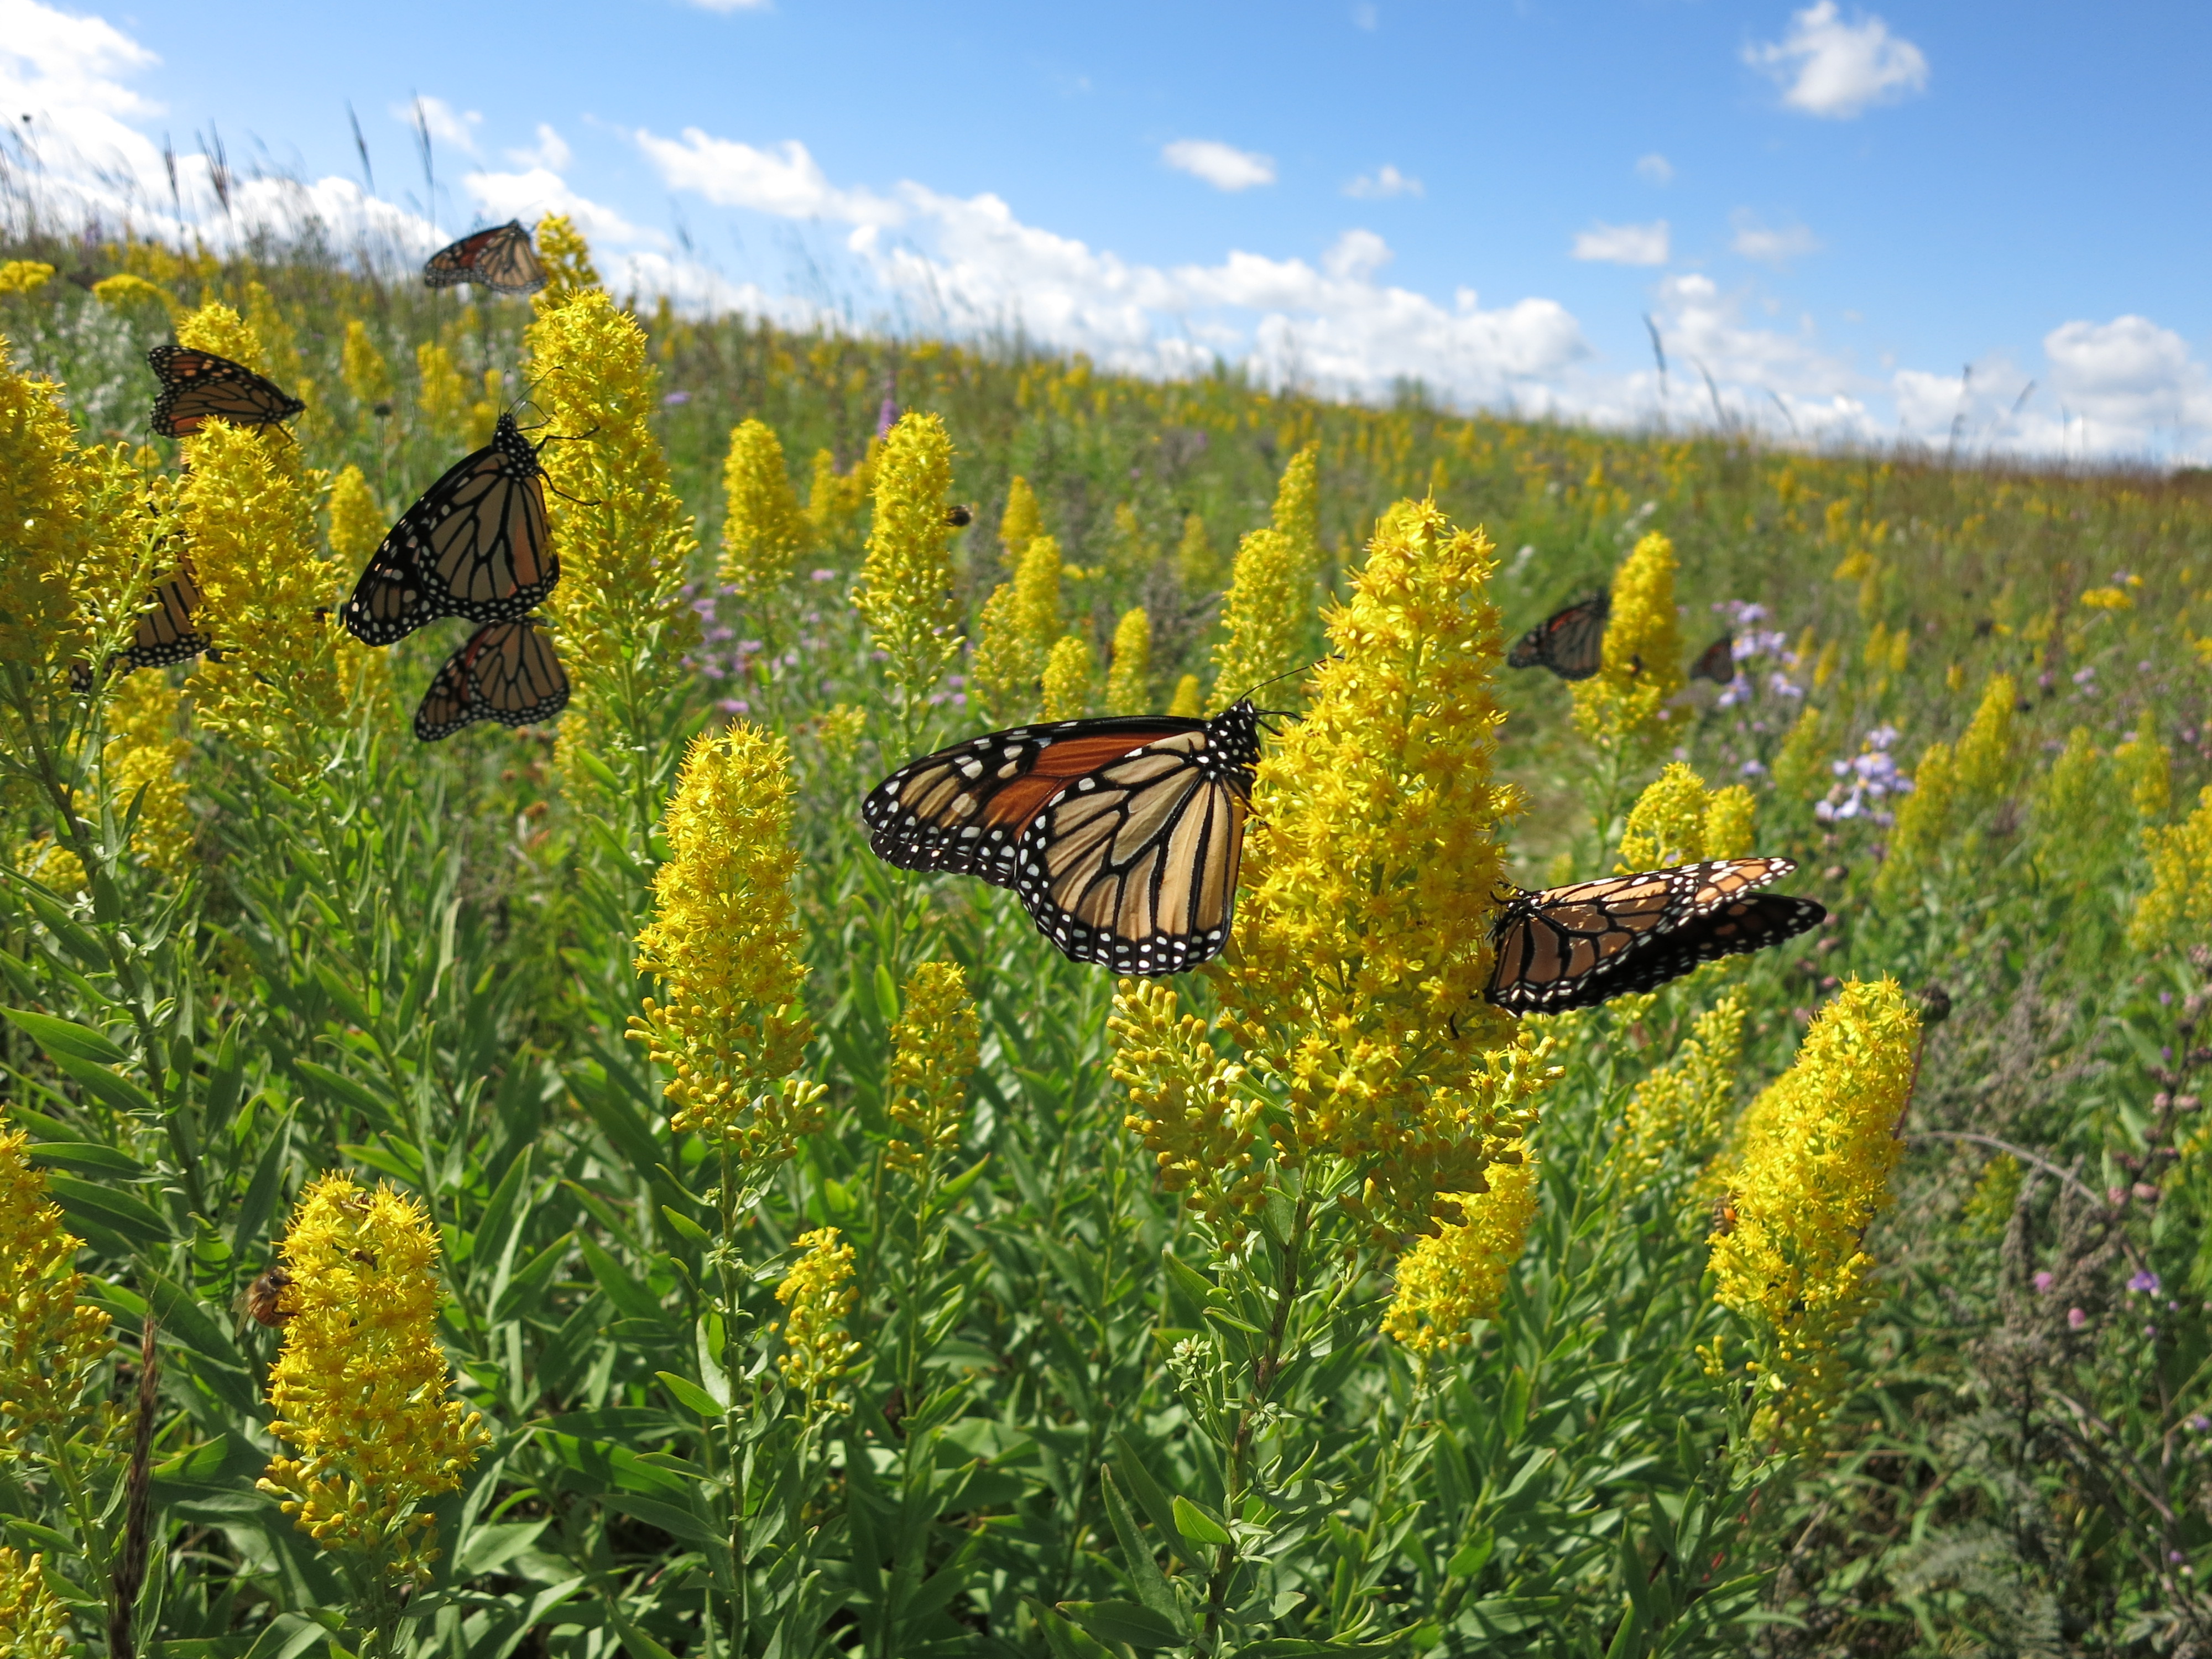
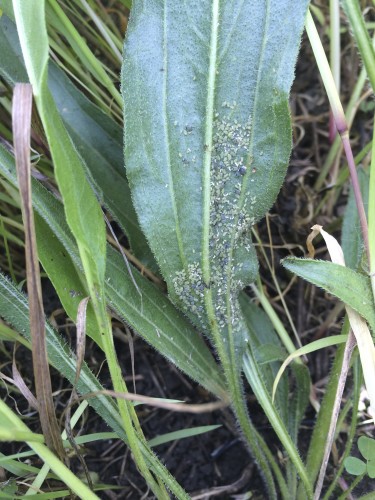
 This collection plant had some of the most aphids we’ve seen yet in one place!
Aphis echinaceae is a recently-discovered aphid species believed to specialize on Echinacea angustifolia. In 2014, Cam Shorb designed and implemented an experiment to test whether aphids could survive on the closely related Echinacea pallida or hybrids of the two Echinacea species. He added a total of 1600 aphids to 88 Echinacea plants at Hegg Lake WMA. Although the aphid survival rate was only 9 percent, Aphis echinaceae survived on all Echinacea variants suggesting the aphid may be more flexible than previously believed.
Start year: 2014
Location: Hegg Lake WMA
Products: A preliminary dataset is located in Cam Shorb’s Dropbox folder. This dataset needs to be made readyR.
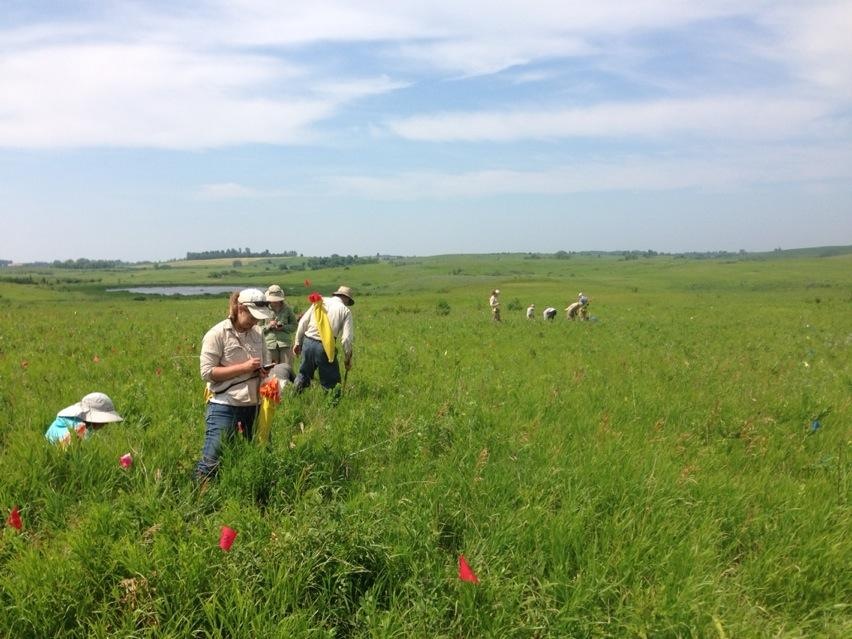
With over 15 years of data, the study of Echinacea demography is among the Echinacea Project’s longest running research projects. During demography, Team Echinacea maps and collects basic demographic information about plants within 30 prairie remnants. In 2014 we collected demographic information for over 500 individual plants including 179 flowering plants at our largest site, Staffanson Prairie Preserve, alone. Across the other 29 sites, we found 897 flowering plants and visited a total of 1226 plants. For each plant visited, we recorded whether the plant was alive, whether the plant was flowering, and how many flowering heads it produced. With this extensive dataset, we hope to explore inter-annual flowering patterns, assess longitudinal plant fitness, and monitor numerical population dynamics in remnant populations of Echinacea.
Read previous posts about this experiment.
Start year: 1995
Location: 30 remnants prairies
Products: Stuart, Jared, and Gretel are working to clean, organize, and integrate demography, survey, and phenology data (project “demap”). Also see the demography protocol.
Overlaps with: fire and flowering at SPP
To examine the role flowering phenology plays in the reproduction of Echinacea angustifolia, Jennifer Ison planted experimental plot 2 (P2) in 2006 with 3961 individuals selected for extreme (early or late) flowering phenology. In 2014, we measured traits for all 2123 living plants and monitored the daily phenology of 247 flowering heads. Echinacea flowering began on July 2 in P2 and continued through August 24. Using the phenological and trait data collected this summer, we will explore how flowering phenology influences reproductive fitness and estimate the heritability of flowering time in Echinacea angustifolia.
Read previous posts about this experiment.
Start year: 2006
Location: experimental plot 2 (Hegg Lake WMA)
Overlaps with: pollinator efficiency
|
|