|
|
Hello all! A lot has happened since my last post, so here is a brief update!
After returning to school with my phenology data and experimental seed heads in the fall of 2011, I began work on my senior thesis using that data as a foundation. In April of this year I defended my thesis, “Flowering Phenology and Seed Set in Fragmented Populations of the Prairie Plant Echinacea angustifolia” and was awarded Distinction by my committee! Stuart and I continued to work on my data after my defense and are planning to continue the project and potentially incorporate data from this summer in the hopes of publishing it! Here are some of the very interesting results that we’ve gotten so far:
> aggregate(ss ~ nndist + pdtime, data = mm, mean)
nndist pdtime ss
1 far early 0.1637403
2 near early 0.2690535
3 far late 0.2947009
4 near late 0.1802392
We found that there’s a relationship between seed set (ss), peak flowering date (pdtime), AND distance to the 6th nearest neighbor (nndist). Seed set was higher in plants that had a combination of close 6th nearest neighbor (near) and early peak flowering date or far 6th nearest neighbor (far) and late flowering date. Very interesting!
(table is categorical and matches glm model which looks at pd & nn6 as continuous)
If anyone has any questions, is interested in continuing this exciting project this summer, or would like a copy of my thesis, feel free to contact me! (Amber Zahler at ambermzahler@gmail.com)
If you are heading to ESA, visit Callin Switzer’s poster “Inspiring future ESA members in elementary or middle school, using place-based inquiry.”
It has been scheduled for:
Contributed Poster Session: Education: Pedagogy
Date: Tuesday, August 7, 2012
Time Slot: 4:30 PM – 6:30 PM
Location: Exhibit Hall DE at the 2012 ESA Annual Meeting, to be held in Portland, Oregon, August 5-10, 2012.
Visit his poster, #35507!
This is the poster I presented at the Midwest Ecology and Evolution Conference (MEEC) back in March. I analyzed the data Lee Rodman collected in her experiments last summer and added my own observations of Helianthus pauciflorus. Style Persistence appears to be a good measure of pollen limitation in species other than Echinacea. This field season, I will test Style Persistence as a measure of pollen limitation in Helianthus species.
Taira MEEC poster.pdf
Yesterday, the Mettler Toledo BALNT software was throwing up an error when it was started, preventing weighing.
Exact error message: BALNT.exe has generated errors and will be closed by Windows. You will need to restart the program. An error log is being created.
This seems to be an error with the config file in the C:Windows or C:WINNT directory. To fix this, take the zip file in I:DepartmentsResearchEchinaceaVolunteersBalancebalancebackup-good2012.zip and extract it to the C: drive. This should overwrite the Balance-May2012 directory on the C: drive. Take the BALNT.ini file from that directory and copy it to C:Windows or C:WINNT, whichever exists. You should be able to start the balance software and begin collecting points.
What’s this in plug 156? A young seedling with fused cotyledons and a true leaf just peeping up. in the nearby corner is a more typical seedling. Both plants come from florets of Echinacea angustifolia that were pollinated with pollen from Echinacea pallida.

Click image to embiggen!
In a paper just published in Restoration Ecology, Echinacea Project researchers report that establishing Echinacea angustifolia in existing prairie restorations and abandoned agricultural fields requires more than 20 seeds for each plant that germinates and survives to flowering. Plants start flowering about 10 years after sowing. Also, burning the prairie before broadcasting seeds helps emergence and survival.
Wagenius, S., A. B. Dykstra, C. E. Ridley, and R. G. Shaw. 2012. Seedling recruitment in the long-lived perennial, Echinacea angustifolia: a 10-year experiment. Restoration Ecology 20: 352-359. Available here: https://echinaceaproject.org/pub/wageniusEtAl2012.pdf

Click to embiggen the poster. This isn’t the full poster, but I’m not uploading a 30MB PDF. The videos can be read with a smartphone and a QR reader, or flip through my posts, as all the videos are on the flog somewhere.
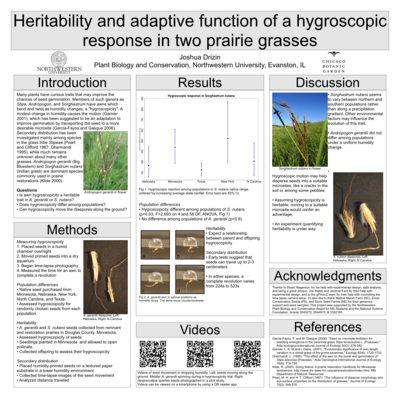
I couldn’t make the Midwest Ecology and Evolution Conference, but I made a poster. It describes preliminary results from an aphid addition/exclusion experiment I conducted in the summer of 2011. Specifically, it examines the question of whether aphid infestation influences the presence of leaf damage by other herbivores.
MEECPosterKMullerFinal.pdf
Hello everyone! This is Sebastian with another update on the x-ray machine. This post will discuss the various methods that can be used to determine the radiation dose of our x-ray machine. Below you will find my report on determining x-ray radiation doses.
Evaluating 3 methods for estimating radiation doses
23 March 2012
Sebastian Di Clemente
Introduction:
The population biology lab is trying to determine the dose of x-ray radiation that the x-ray tube emits per x-ray taken. Calculating the radiation dose is not an easy task because there is no straight forward way to do it. Each method used to determine the x-ray dose presents several differences in measure and calculation. Knowing the radiation dose of the x-rays can be used to determine what dose levels will hinder or harm a seed and what dose levels may even be beneficial to seeds; in short, knowing the radiation dose will allow researchers to quantify the point where seeds are affected by the radiation. With this experiment I will evaluate the sources that give the x-ray radiation dose and analyze the information given by each source.
Objectives:
1. To determine what method gives the most accurate information
2. To determine what method should be consulted to find the most appropriate radiation dose
Methods:
I gathered information based on web searches, contacting professionals, and contacting the x-ray machine manufacturer. I 1.) found a web page that calculates the x-ray radiation dose level and 2.) the manufacture provided the information that they have on dose levels that the Faxitron MX-20 machine produce at various settings. After receiving this information I test the web calculator by inputting the same settings that the manufacture provided and then compared the calculator reading to the value given by the manufacturer. I also further examined the information that the manufacturer provided and determined any differences in information or information format. The use of 3.) a dosimeter would give the most accurate measurement.
Results:
After comparing the web calculator result to the information given by the manufacturer using the same settings and criteria there is a significant difference in the dose level given. The web calculator had a dose level that was greater than the valued indicated by the manufacturer for lower level voltages (less than 20 kV), but the manufacturer indicated a greater dose level at anything above 20kV compared to the web calculator. The professionals offer the solution of a dosimeter. The comparison of the manufacturer data to the web calculator, and the three methods are provided in table below.
Comparison between manufacturer data and web calculator:
View image
The web calculator:
http://www.radprocalculator.com/XRay.aspx
The information given by the manufacturer is given in the following documents:
Dosage MX 20.pdf
mx-20 EXPOSURE DATA.pdf
MX-20 mR Ouput versus time.pdf
The professionals offer the solution of a dosimeter.
Conclusion:
Considering all of the information that I gathered I would trust the manufacture data over the web calculator data. The web calculator is good for fast calculations and changing between what units the dose level will be expressed in. Although, after testing the web calculator and see such a significant difference between it’s calculation and the manufacturer data, I feel that the manufacture would be more likely to have more accurate information.
Since the manufacture data is most reliable it is the clear choice to use. The manufacturer data covers more information, such as time, voltage, as well as unit conversions for other factors. Considering that more information is provided more variations to experiments can be made and the radiation does would still be available after simple unit conversions.
The other option presented by professionals would be to use a dosimeter to directly measure the radiation dose. This option would be the easiest way out of the three options, and would cater more to a researcher’s specific setting. If a dosimeter is available to use I would make this device my choice for determining radiation dose.
Hi everyone!
Maria here. Sorry that I have not posted since the end of summer, but please rest assured that I’ve not run away with my Dichanthelium seeds, but have been working on them for the past -what? 6 months? A long and intimate relationship indeed.
Brief summary of what has happened:
I did a pilot germination & growth study using bulk Dichanthelium seeds. The results of germination study is nicely summarized in this poster that I presented at Midwest Ecology and Evolution Conference (MEEC) in Cincinnati 2 weekends ago(?). MEEC was fun and presenting (yapping about) my poster was a lot less nerve-wracking than I had expected:
MWangMEEC2012poster_44_x_36.ppt
Thanks to everyone who helped me in my hectic rush to get the poster done X_X
The seedlings are currently growing in the growth chamber at CBG. (There’s pictures in the poster of seedlings in agar and in plug trays!)
I shall put up some more pictures sometime in the future.
There’s a series of pictures I want to put up showing seeds before and after x-ray and scarification – it’s pretty interesting.
I should also post the R script I used to analyze data and produce the graphs on the flog – unfortunately don’t have the file on this computer.
Right now I’m working on scarifying Dichanthelium seeds for my maternal lines growth and germination experiment (probably should explain in better detail later, likely in another poster).
Other good news you might find interesting:
Thanks to A LOT of help from Stuart and other advisers, I applied and got the Northwestern Academic Year Undergraduate Research Grant for my Dichanthelium project during the school year (maternal line germination/growth experiment), and also very recently, the Garden Club of America Clara Carter Higgins Summer Environmental Study Scholarship =)
If you have any questions about Dichanthelium or anything I talked about, you’re welcome to get in touch. My email is right under the entry title.
|
|