
This week I started investigating the Malo curves and visualizing the data. In March of 2014, Lou, one of the citizen scientists that volunteers in the Echinacea Lab, wrote a program to take the daily flowering data collected in 2005 and output the 5 parameters that are needed to draw the Malo curves for individual heads. While these parameters are needed to draw the exponential sine functions, they also act as direct proxies for different phenological features like the start date of flowering, the maximum number of flowers open on a single day and more. So, I have 347 Malo curves drawn for me and lots of data to utilize in my analysis.
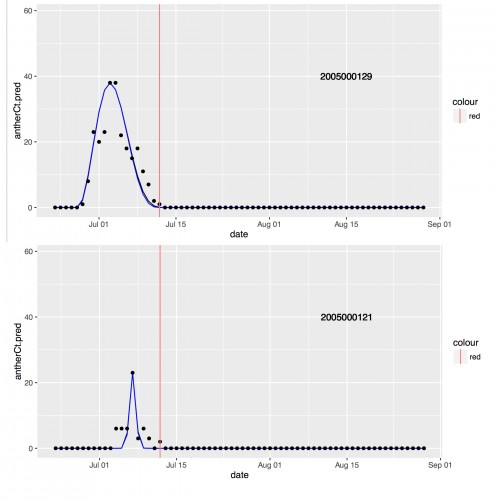
This photo shows 2 of the 347 curves that have been drawn. The black dots represent the actual number of flowers open on a given day, while the blue curve was drawn utilizing the parameter’s calculated by Lou’s program.
The main focus of my analysis will be investigating how these curves vary, if at all, based on whether or not the head came from an Echinacea plant with other heads or if it was the only head on that plant. So, my first step was to create histograms for each of the 5 variables.

This is the histogram for one of the parameters that represents the duration of flowering a single head experiences. The red line represents the mean flowering duration, while the blue line represents the median.
After my preliminary investigation, it looks like none of the parameters, and therefore the Malo curves, vary based on the number of heads on the original plant. My next step is to utilize statistical tests like Nonmetric Multi-Dimensional Scaling (NMDS) and MANOVA, to determine if and how these parameters are related to each other. Stay tuned!
Leave a Reply