
I successfully created a generalized linear model to describe reproductive success at Staffanson Prairie Preserve for the 2015 season. I started out with a model containing distance to the 3rd nearest neighbor, flowering start date, flowering duration, section of head from with the achene came, and all interactions between these main effects. In addition, I included both linear and quadratic terms for distance, start date, and duration. The purpose of including a quadratic term is to test for evidence of curvature in the relationship to seed set.
Through a process called backwards elimination, I removed all terms from the model that did not have a significant impact on reproductive success. The final model I came up with contained both linear and quadratic terms distance and start date, as well as the section of head. No interactions were found to be significant. In the plots below, the raw data are shown as points, and the predicted valued from the model are shown as curves. There are three plots of seed set as a function of distance, with the three plots representing low (10 days or fewer), mid (11-13 days), or high (14 days or more) flowering duration. The colors correspond to section of head, with red being top, blue is middle, and green is bottom.
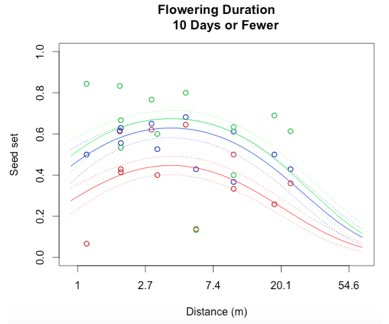
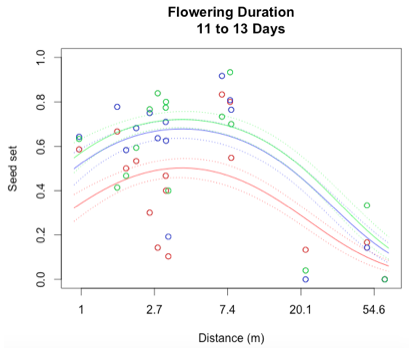
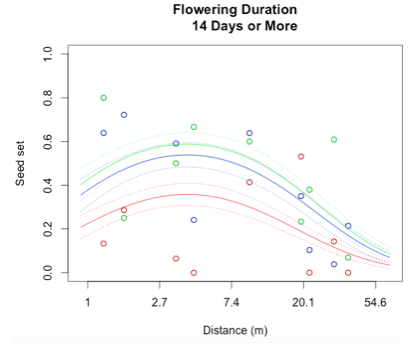
While this is an observational study, so attributing causation would be inappropriate, it is helpful to think about why these relationships may exist. The general trend with increasing distance and spatial isolation is that seed set and reproductive success decrease. This is probably because isolated plants have fewer available mates or may be visited by fewer pollinators. However, the relationship is curved and plants in very densely populated areas also have diminished seed set. This may be caused by overcrowding and competition between plants for pollinators in areas of high population density.
Seed set has a similar peak at mid-duration of flowering. One explanation for this phenomenon is that plants that flower for a very short period of time co-flower with fewer potential mates, so a longer flowering time would maximize the number of compatible mates flowering at the same time. However, it is also known that extended flowering can be a sign that the head has not been receiving sufficient pollen, explaining the negative relationship between duration and seed set seen at higher durations.
In the future, this model will be compared to similar models from previous years during which Staffanson underwent controlled burns. Any differences seen between the models may be indicative of how the mating scene changes during the year after a burn.
Leave a Reply