
So far this year, we have sadly not been able to have volunteers in the lab due to the continuing threat of COVID-19. However, over the last few months, we made quite a bit of progress on the remnant Echinacea harvests from 2020 and 2021. In the fall, we had help from volunteers, students from Lake Forest College, and externs from Carleton College. Thanks for your help! In January, Sophia finished cleaning the last head from 2021, which was an exciting accomplishment.
To track our progress in the lab, I created an R script to visualize the various steps of the ACE process for each batch of Echinacea. The figures for rem2020 and rem2021 are included here. Hopefully, this method will work for the cg harvests as well.
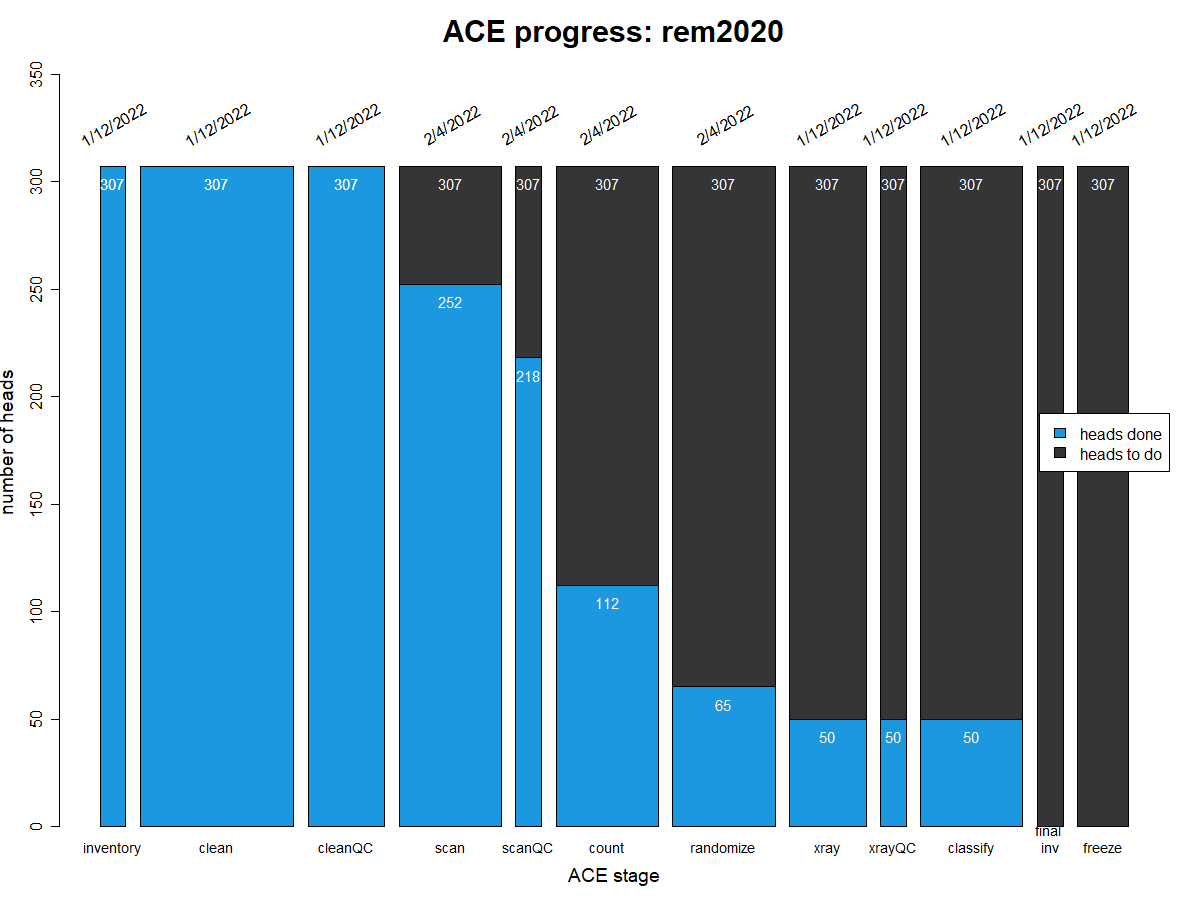
The ACE stages are listed along the x-axis, and the number of Echinacea heads are on the y-axis. The light blue shows how much we have completed, and the dark blue shows what remains to be done. The small numbers on each bar indicate the corresponding number of heads, and the width of the bars is roughly proportional to the amount of time each step takes. Along the top, the dates indicate the last day that the totals for each stage were updated.
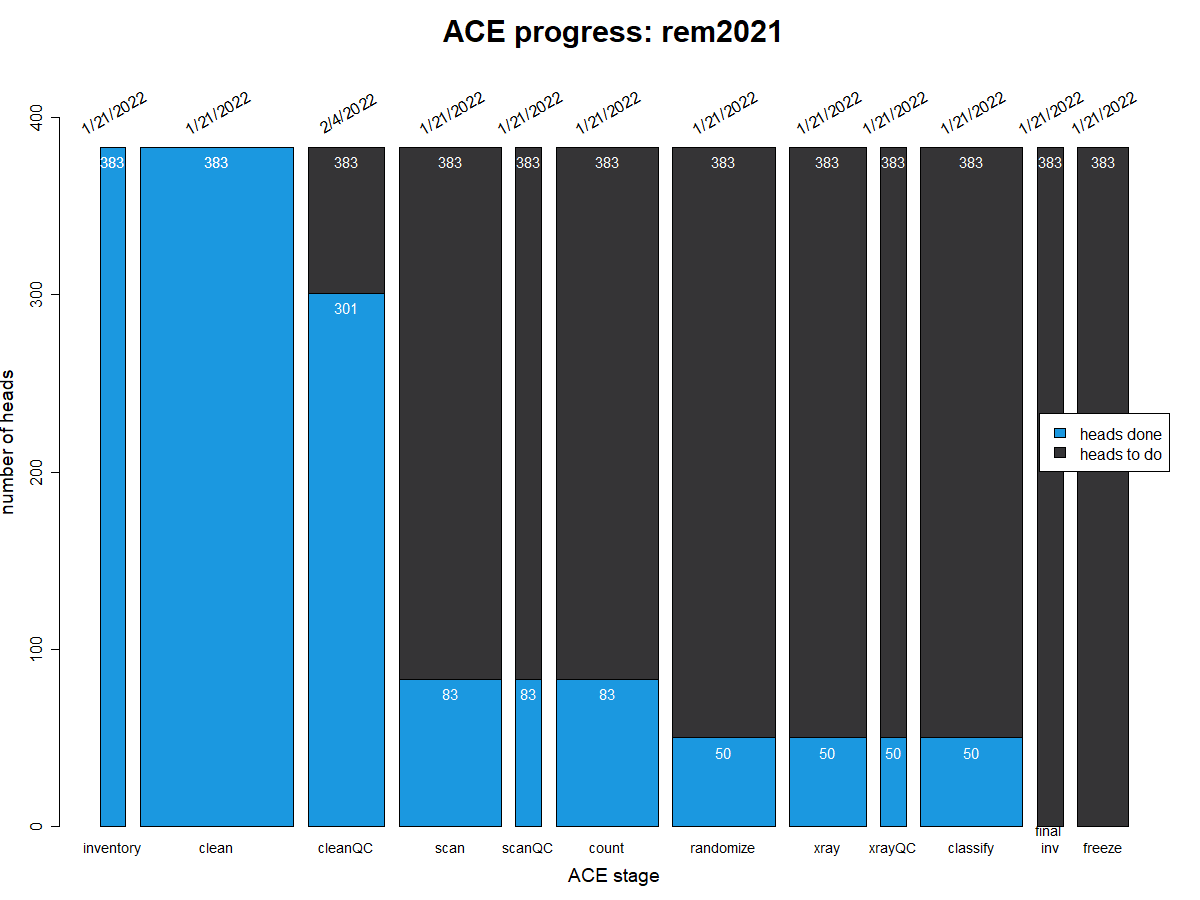
The script to create these graphs can be found here: echinaceasandbox/oop/trackAceProgressTest.R
Leave a Reply