

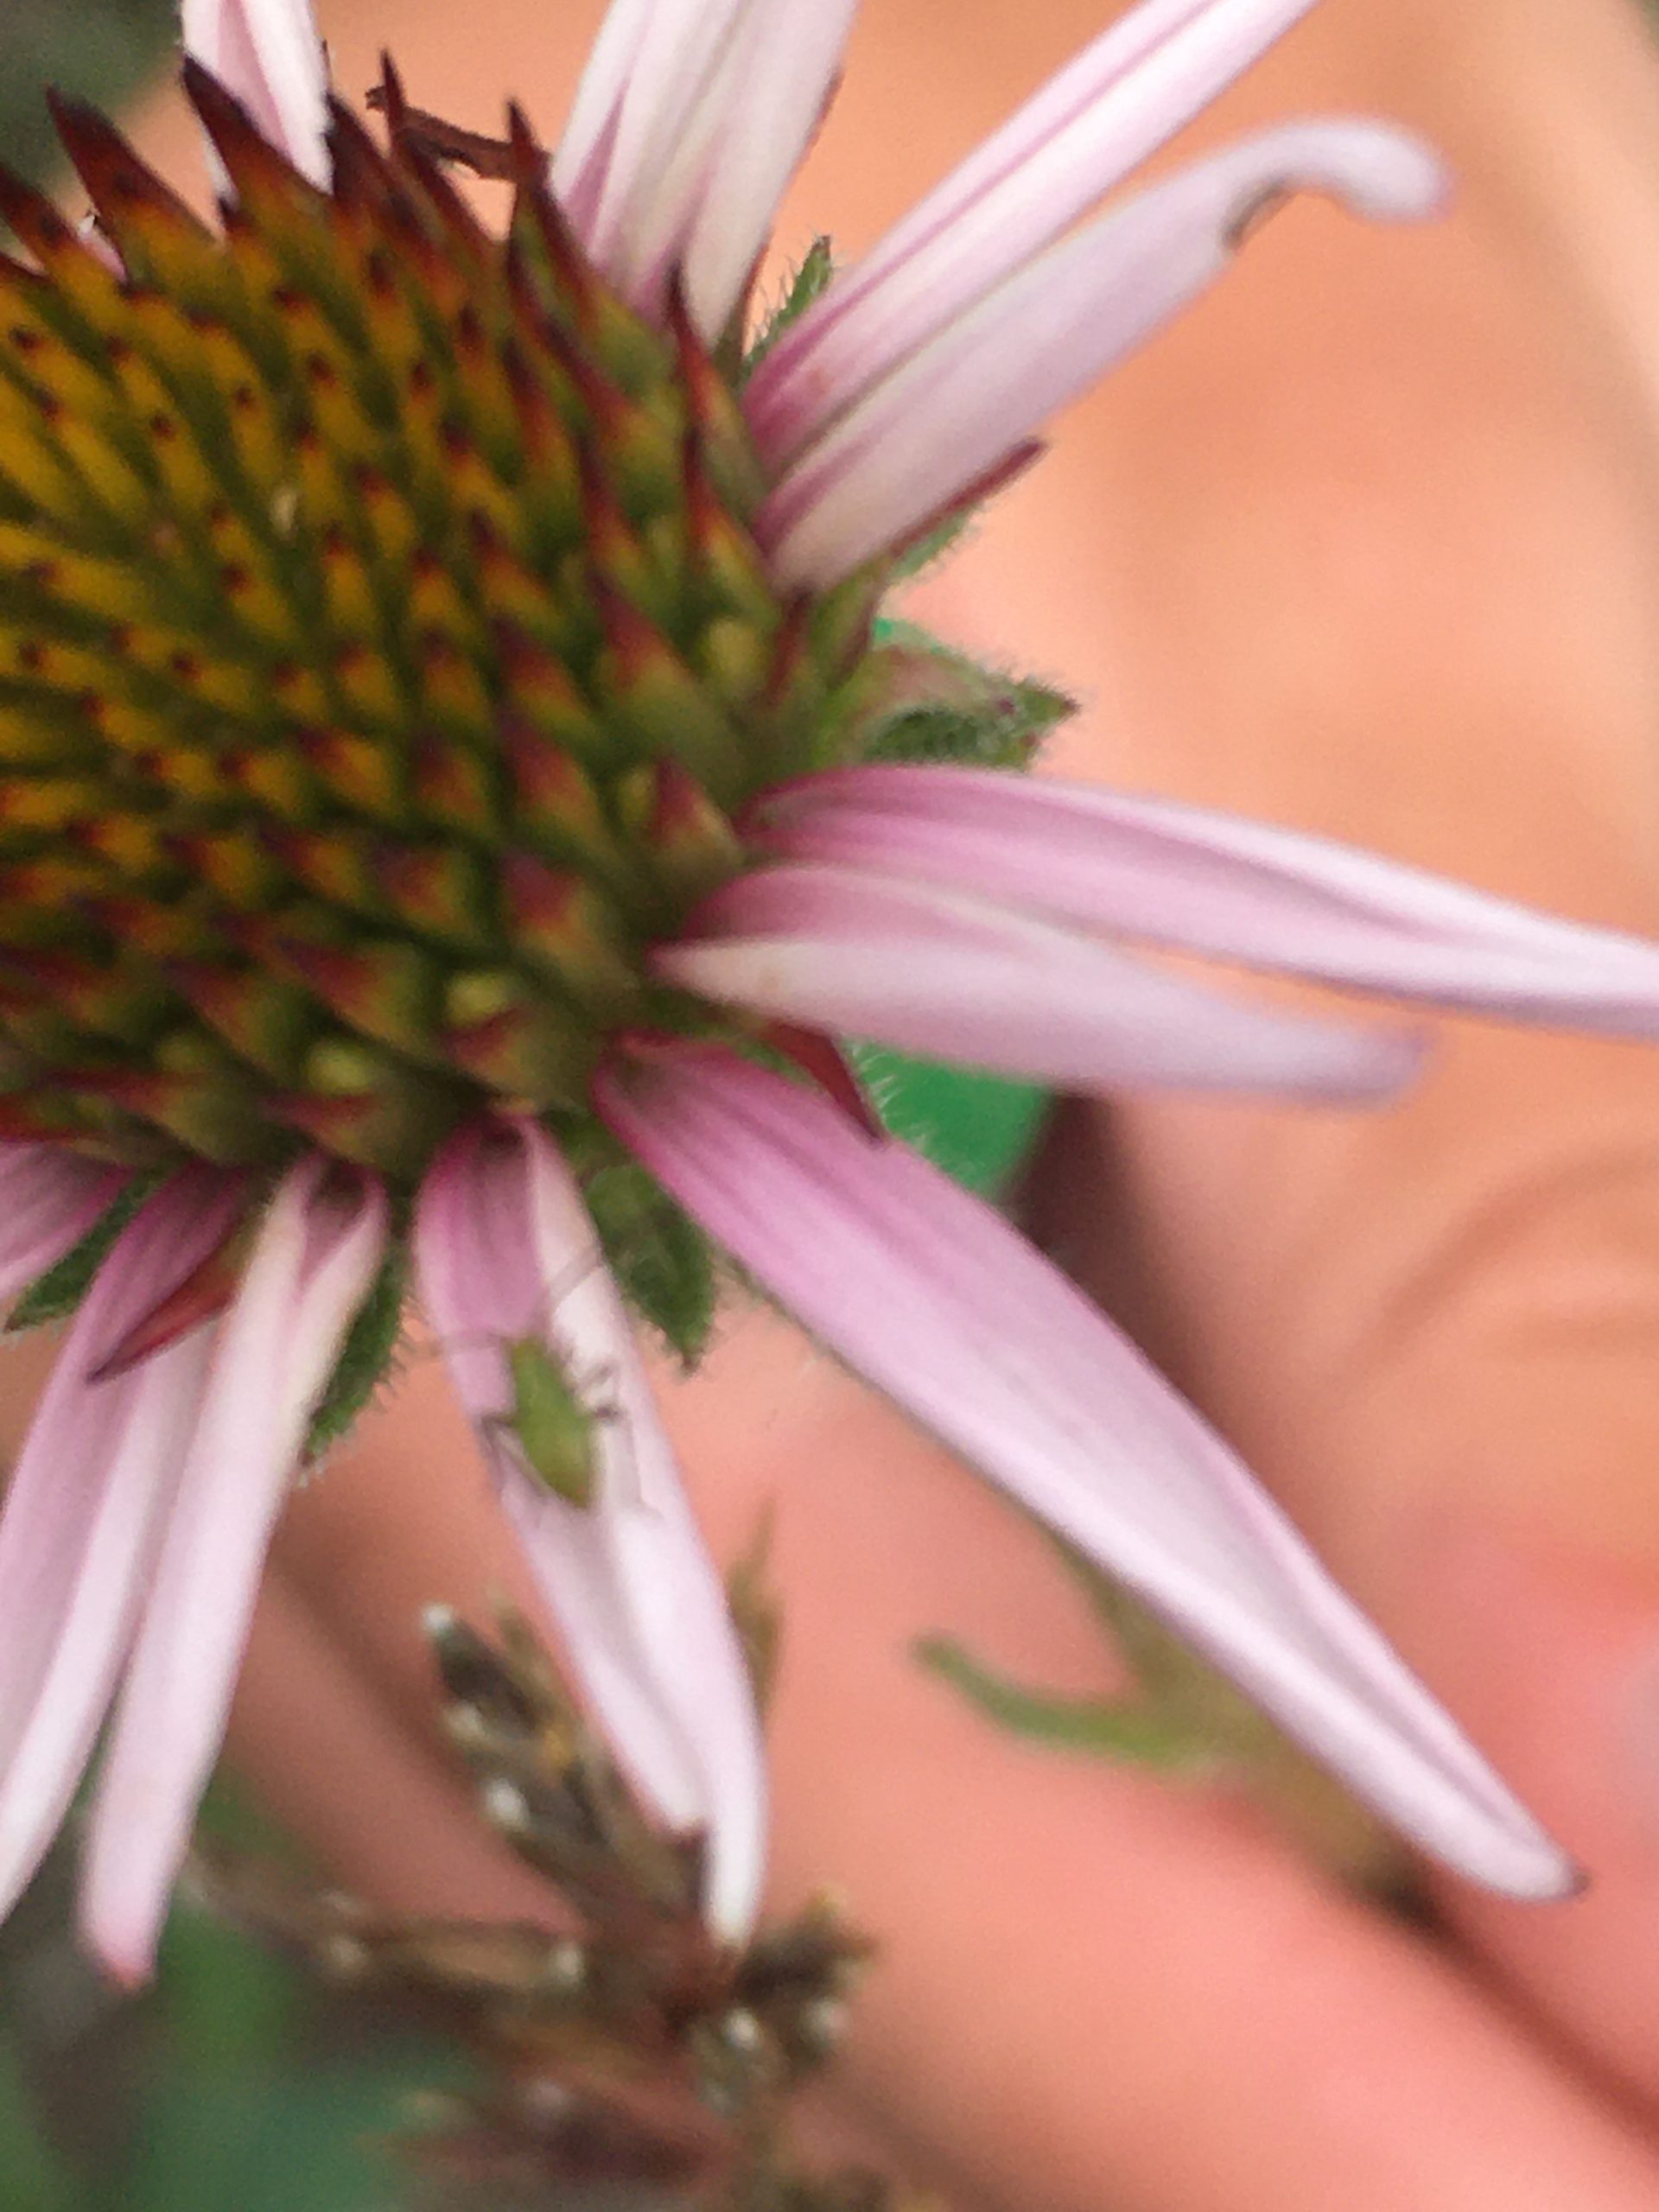
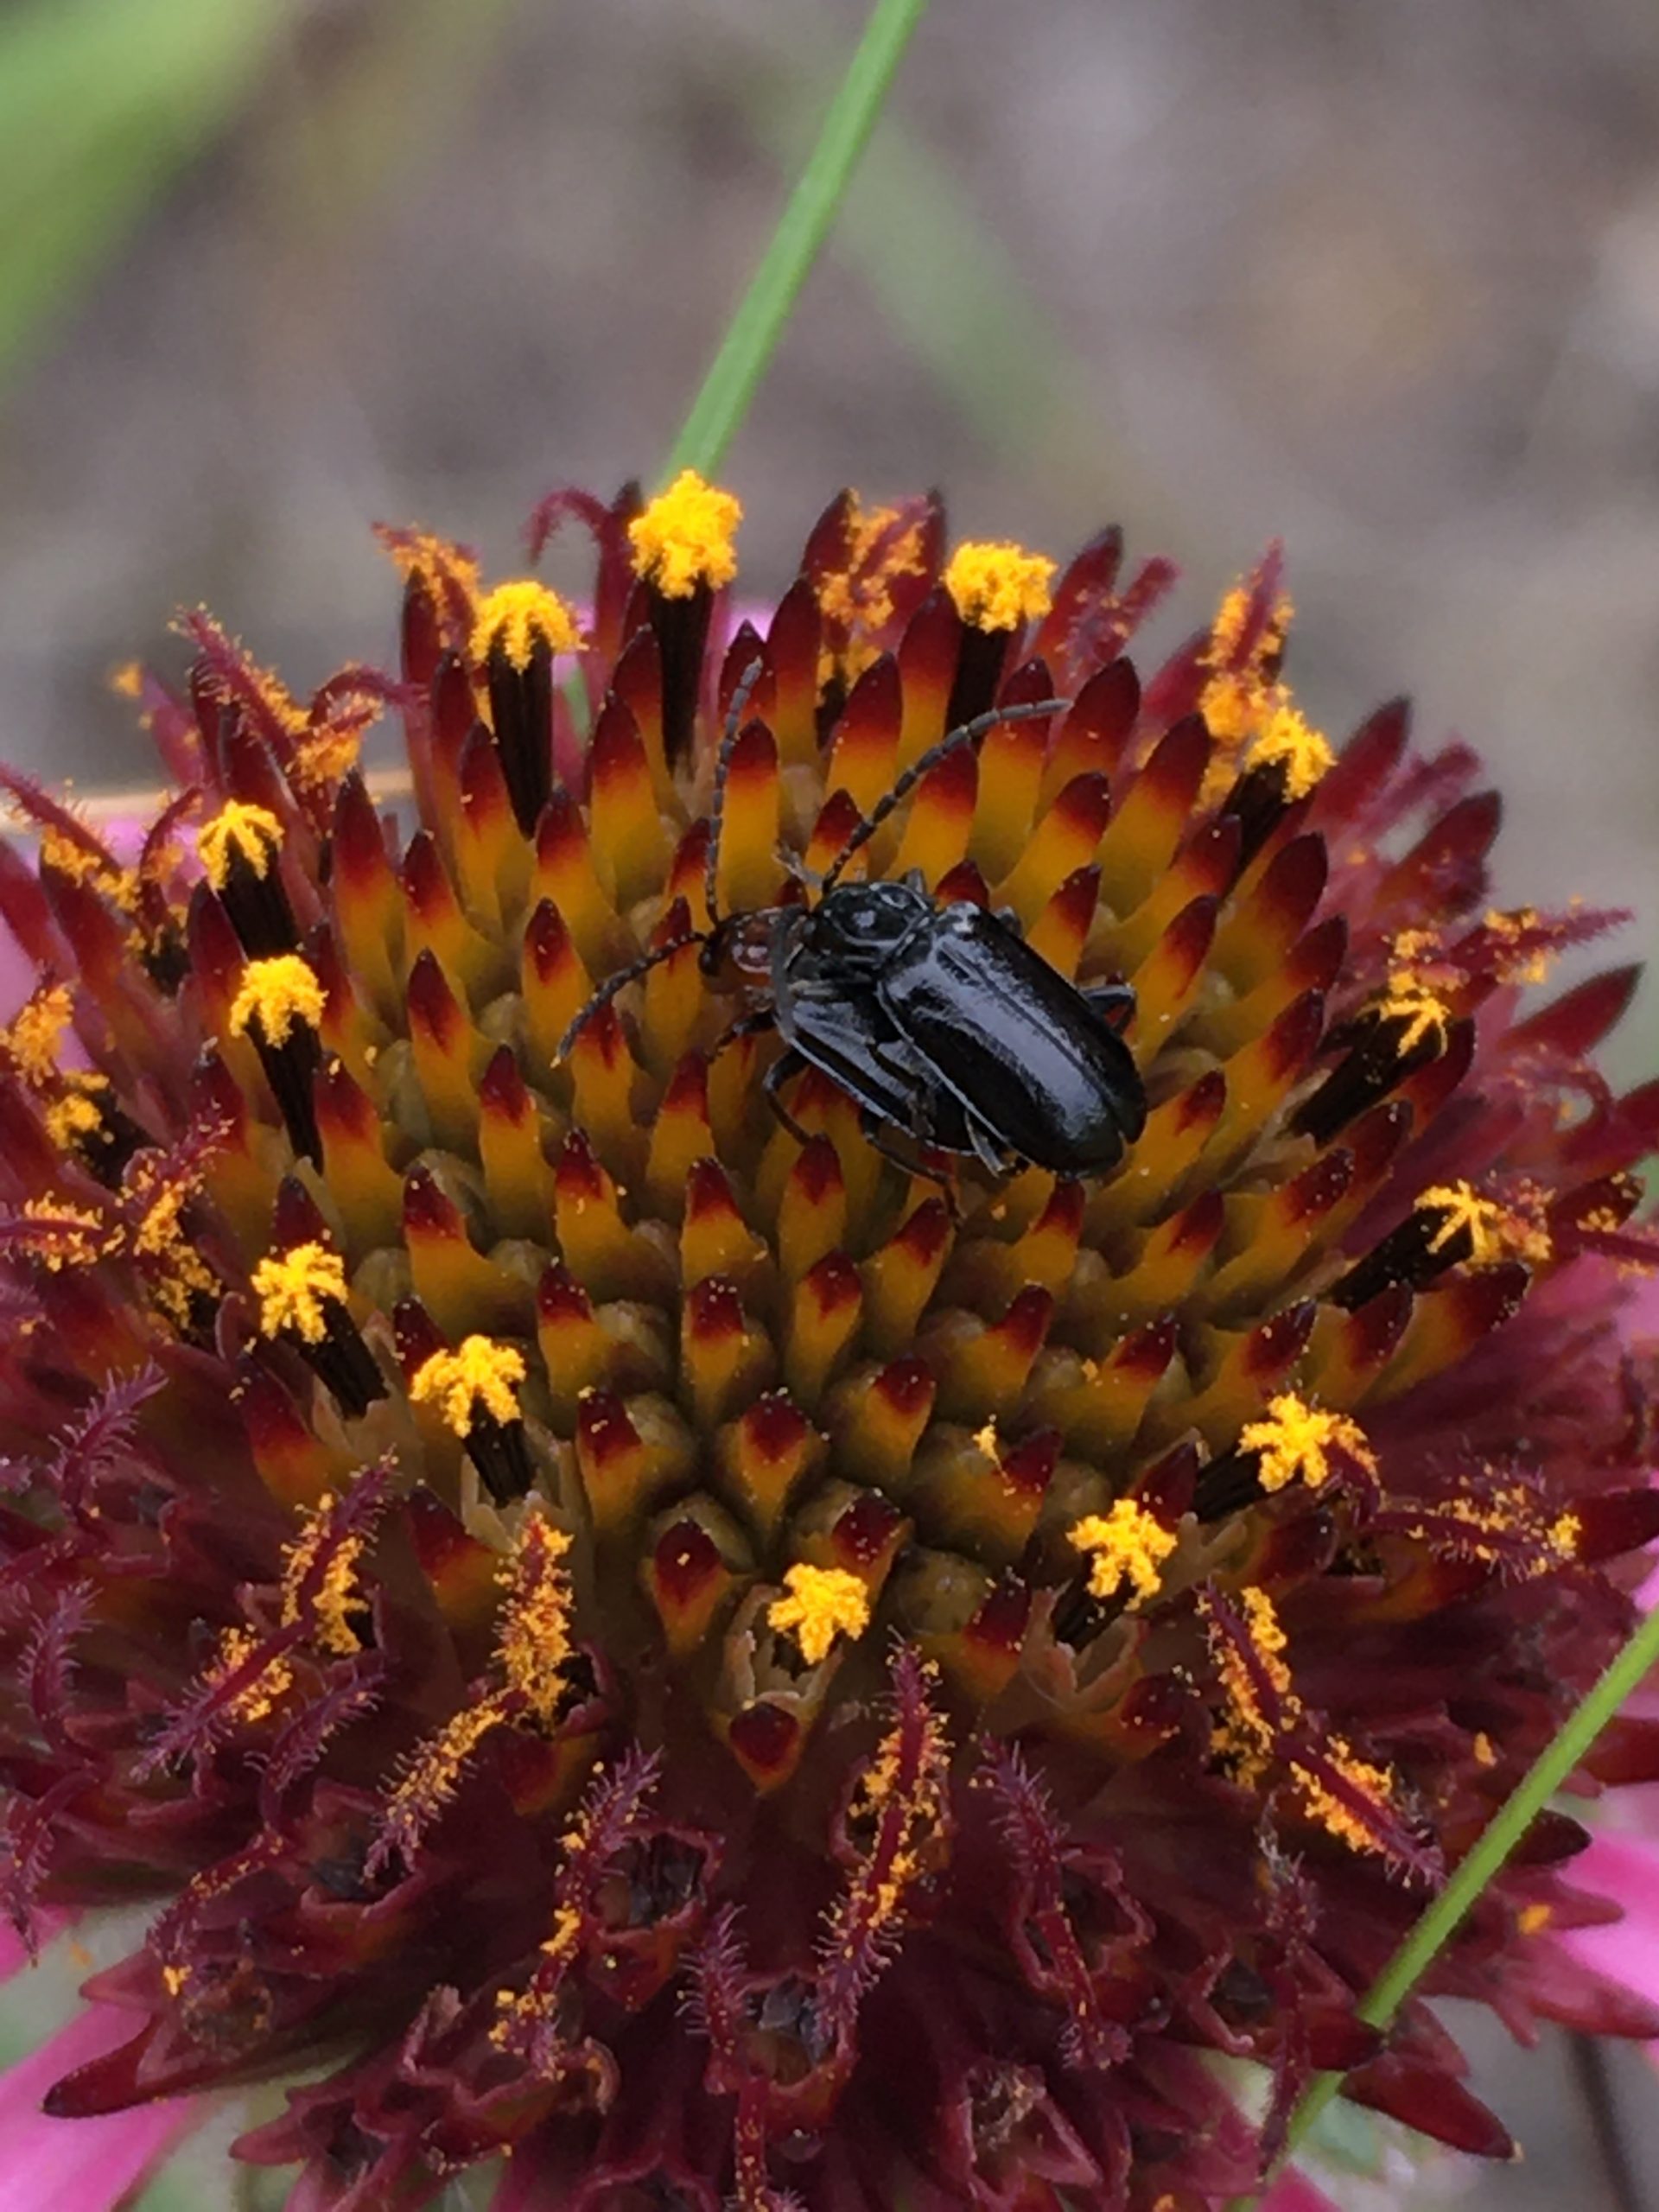
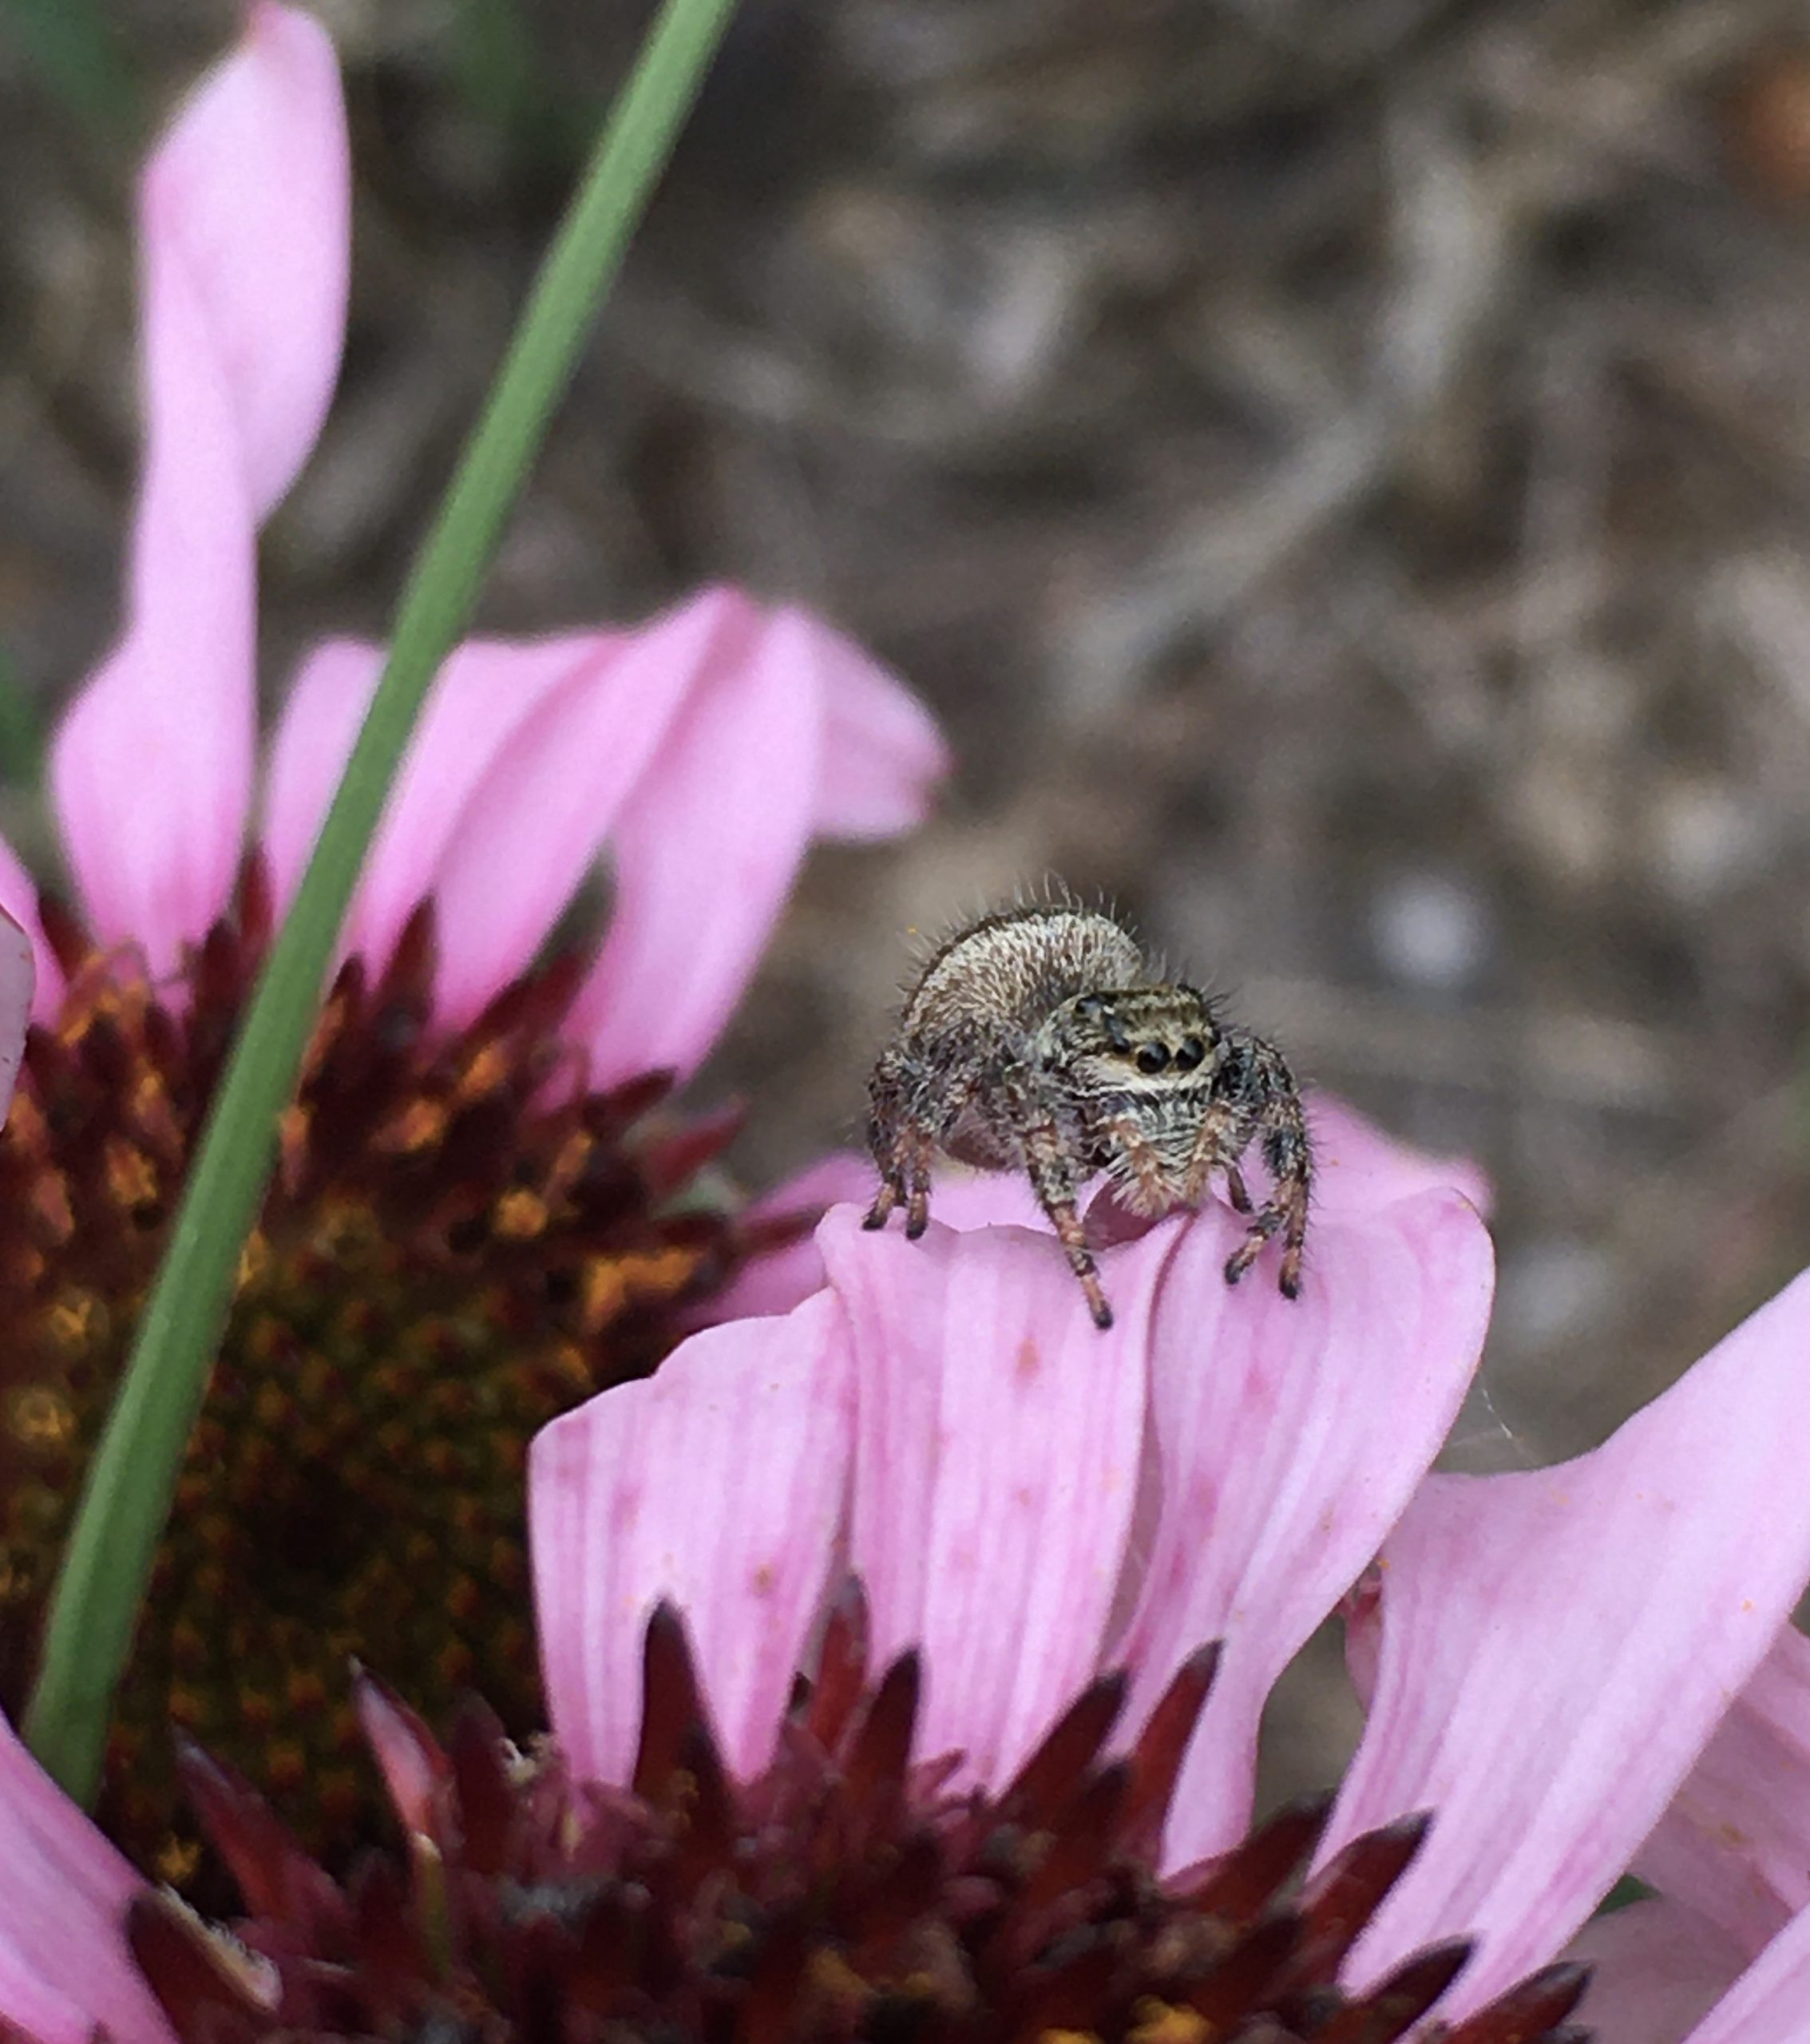
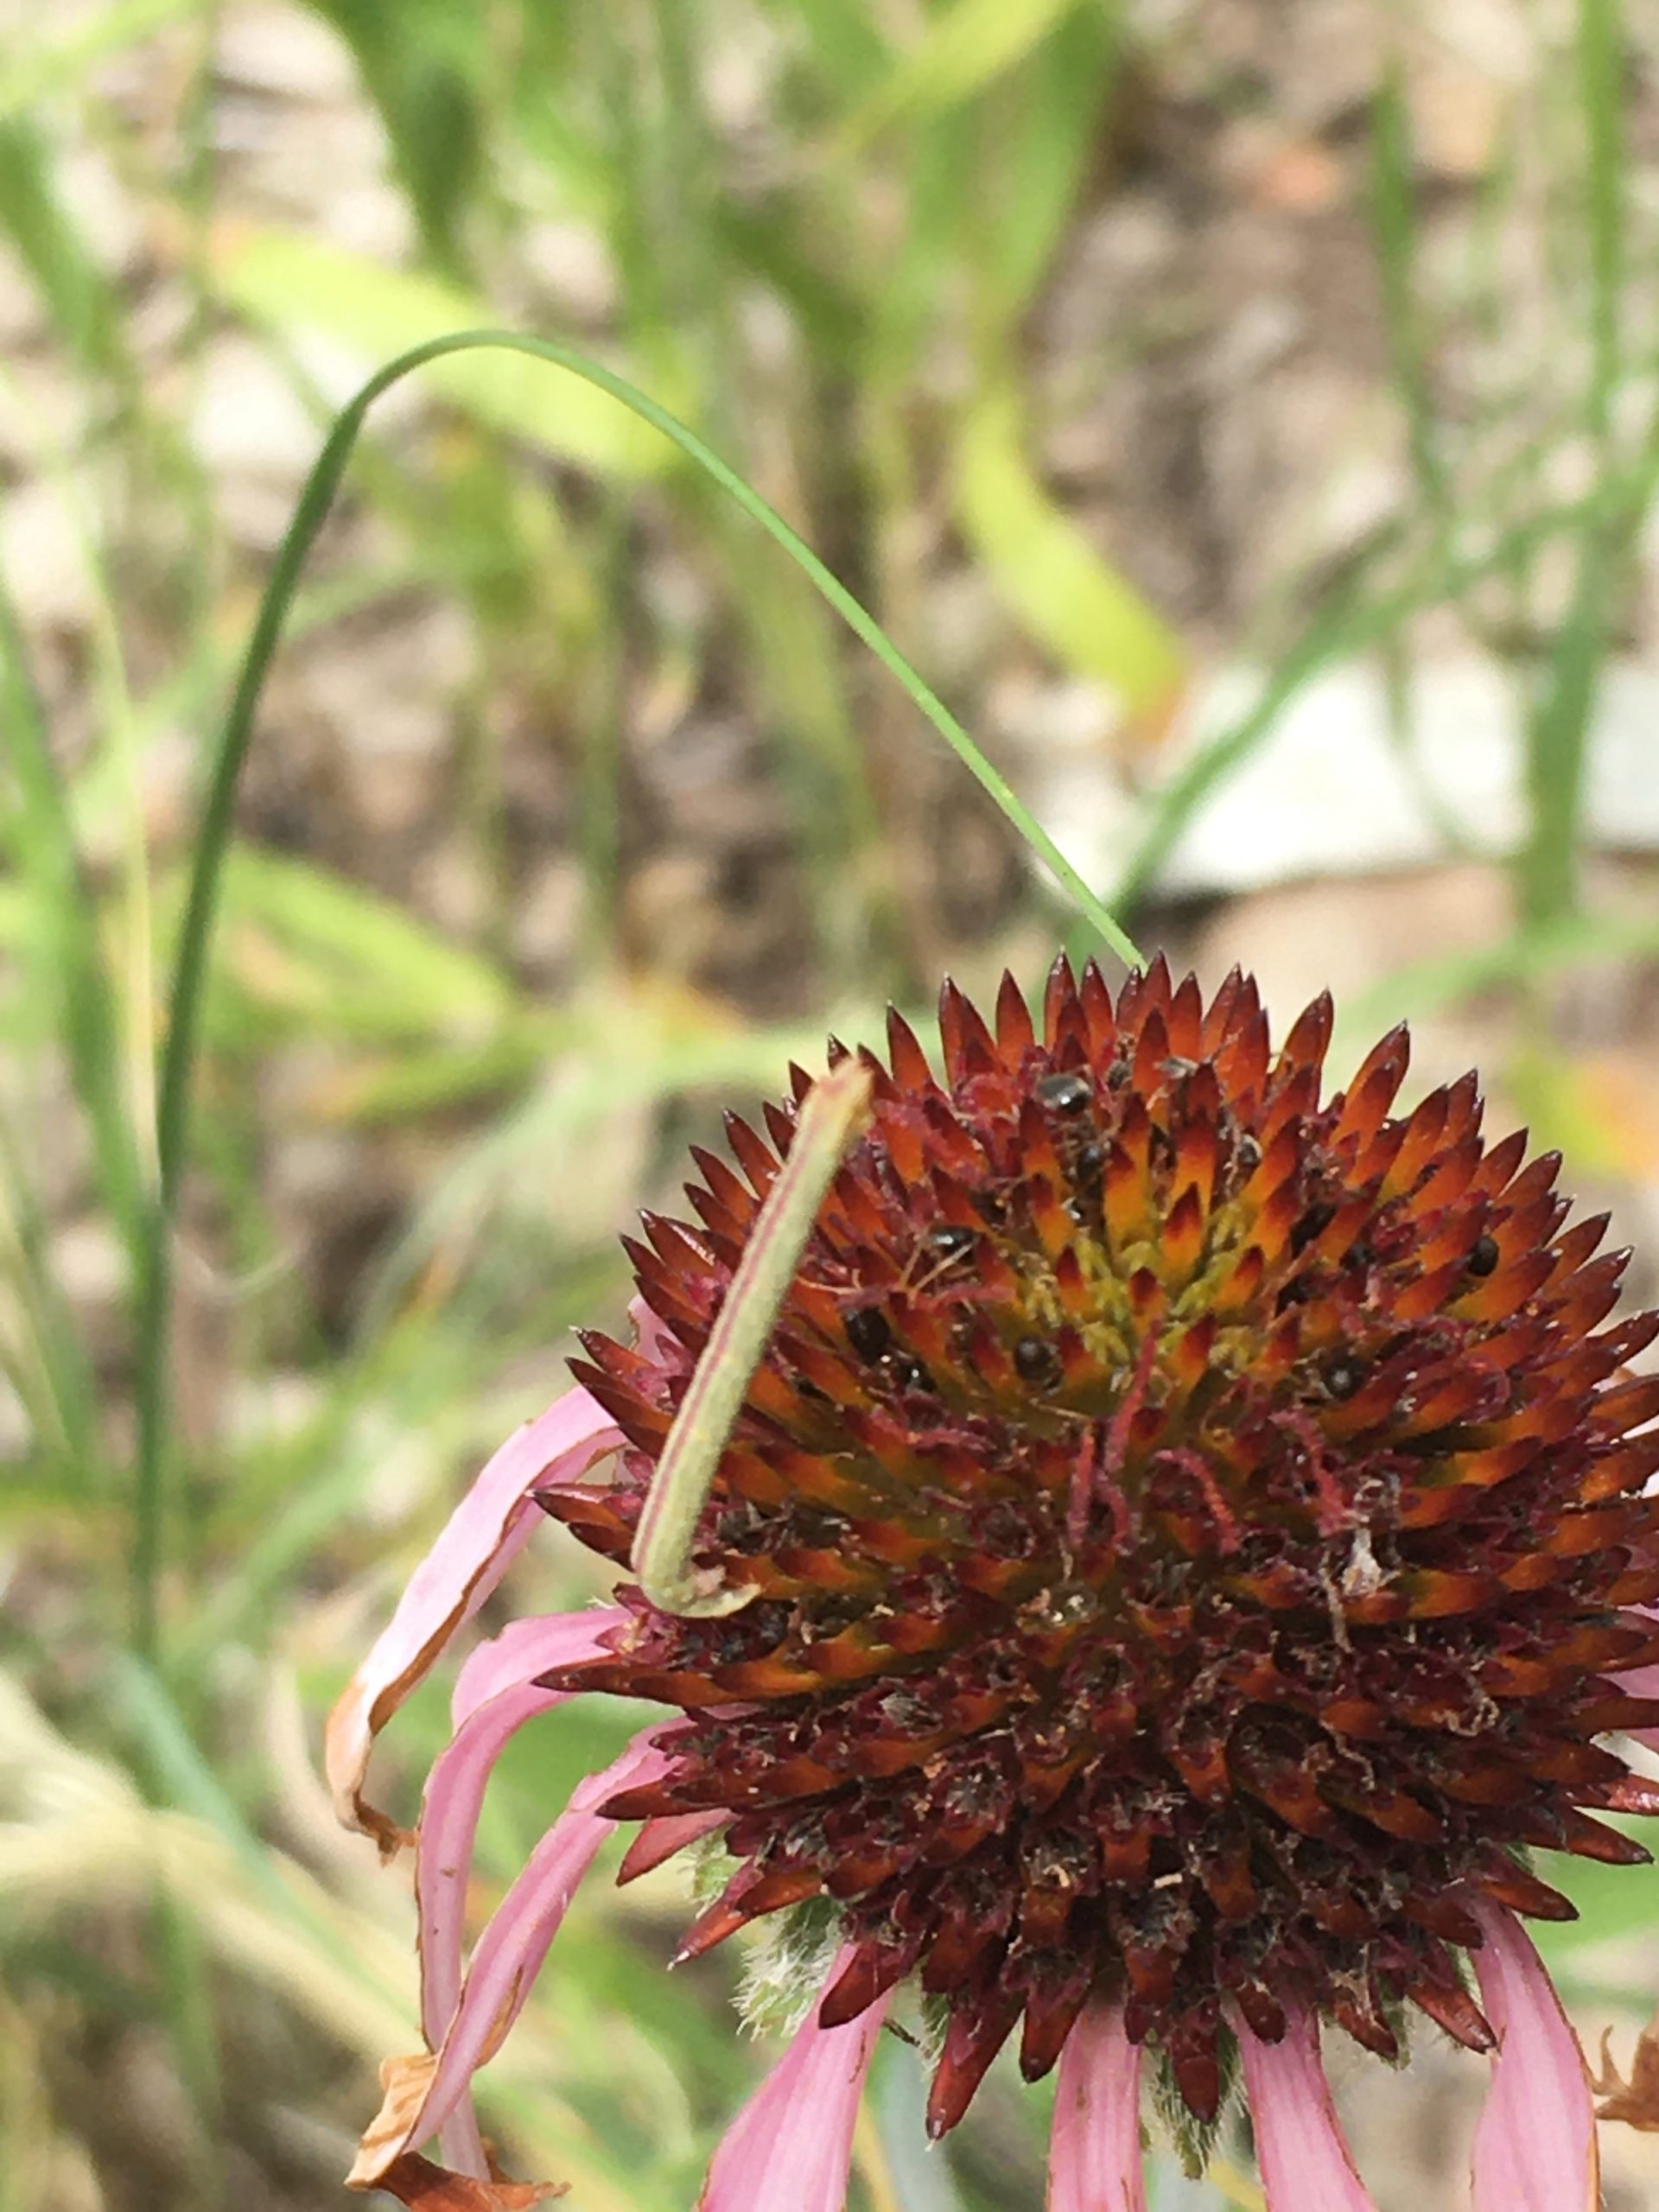
Scorpion Small green bug Style eating beetle (town hall beetles) 
Different Spider (Jumping) Inch worm
|
||||||||||||||||||||
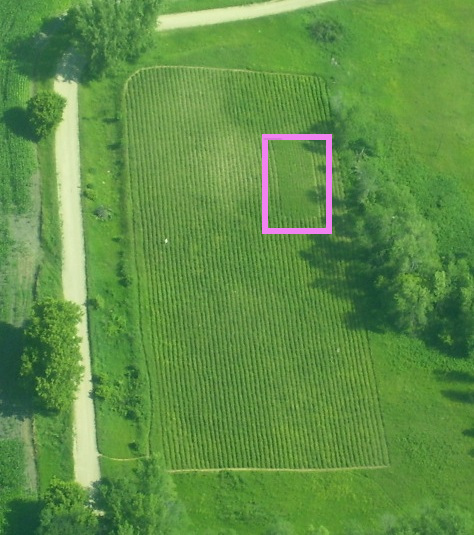 exPt 1 showing the main planting of the 1999 cohort outlined in purple In 2017 only 11 plants flowered of the surviving 750 plants in the 1999 cohort. That means that 57% of the original 1,303 plants are surviving and only 1.5% of the living individuals flowered! 2.4% of living individuals flowered in 2016. In contrast, 29% of living plants flowered in 2015. We are not sure why so few plants flowered this year. It’s possible that lack of fire in the plot influenced flowering rates. This plot was due for a prescribed burn in spring 2017, but weather and scheduling conflicts kept us from burning. Stuart described the provenance of the 1999 cohort, “The 99 cohort came from the seeds of plants that flowered in 1998 that we used to estimate seed set.” The cohort was divided into a planting in the main exPt1 and a planting in a plot south of there, near the farmhouse. These plants are part of a common garden experiment designed to study differences in fitness and life history characteristics among remnant populations. Every year, members of Team Echinacea assess survival and measure plant growth and fitness traits including plant status (i.e. if it is flowering or basal), plant height, leaf count, and number of flowering heads. We harvest all flowering heads in the fall, count all achenes, and estimate seed set for each head in the lab. Start year: 1999 Location: Experimental plot 1 Overlaps with: phenology in experimental plots, qGen3 Physical specimens:
Data collected:
Products:
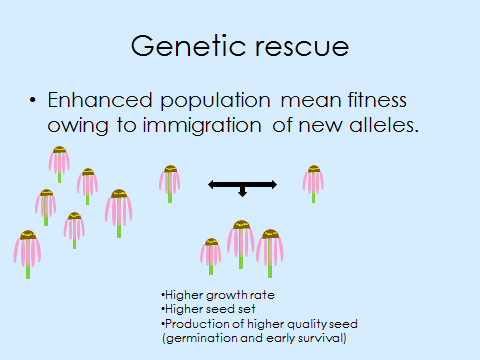
Caroline Ridley established this experiment to compare fitness (recruitment and survival) of seeds originating from individuals with parents from three different backgrounds: 1. both from a large remnant population, 2. both from a small remnant population (not rescued), and 3. one from a large population and one from a small population (genetically rescued). Caroline sowed achenes in an experimental plot at Hegg Lake WMA and marked seedlings with colored toothpicks in May 2009. Start year: 2008 Site: exPt 4 at Hegg Lake WMA Overlaps with: crossing experiments qGen1, qGen2, qGen3 & recruitment experiment; INB1 You can find more information about Ridley’s next generation rescue and links to previous flog posts regarding this experiment at the background page for this experiment. 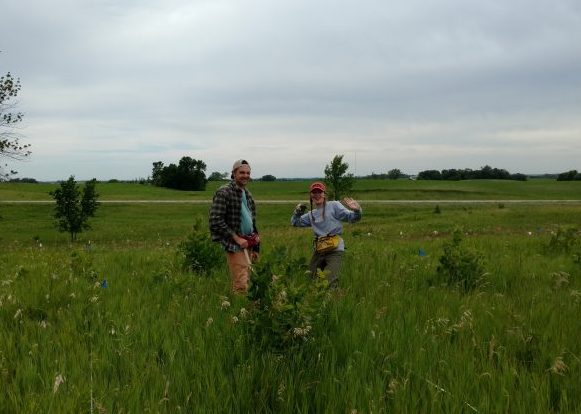 Alex and Tracie search for juvenile Echinacea plants in experiments qGen2 & qGen3. In 2017, we found 1006 three-year-old plants out of the 2526 original seedlings found in 2014 (we found 1724 plants in 2016) in the qGen2 cohort. In the qGen3 cohort we found 248 of the 644 seedlings. The main goal of the qGen2 and qGen3 experiments is to quantify the evolutionary potential of two remnant prairie populations of Echinacea angustifolia by estimating the additive genetic variance of fitness. We make estimates for two mating scenarios. The first scenario is an experimental crossing design with all matings among plants from two “core” sites: SPP and LF (core x core). The second design uses sires (pollen donors) from the core and dams from sites peripheral to the core. The crosses performed (core x core, core x periphery) in this experiment will quantify additive genetic variance for fitness in each site and each experimental group. Additionally, we will test for differentiation among families; do progeny from sires differ after accounting for maternal (dam) effects? Comparing germination and first year survival between the qGen2 & qGen3 cohorts:
Start year qGen2: 2013 Location: The sires (pollen donors) are in the remnants Landfill and Staffanson. The dams (seed plants) are in exPt 1 and they originate from remnants. Specifically, the grand-dams (seed plants of dams) are from remnants Landfill (core) & around Landfill (peripheral) and remnants Staffanson (core) & railroad crossing sites (peripheral). All progeny are in exPt 8. Overlaps with: Heritability of fitness–qGen1 Data collected: We used handheld computers to collect data on juvenile plants. You can find more information about Heritability of fitness–qGen2 & qGen3 and links to previous flog posts regarding this experiment at the background page for the experiment. 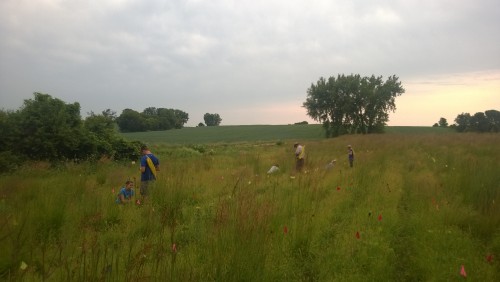 Team Echinacea measuring plants in big batch In 2017 we assessed survival and fitness measures of the qGen1 plants. 1,991 plants in qGen1 were alive in 2017. Of those, 3% flowered in 2017 and 46% have yet to flower ever. All were planted in 2003. The qGen1 (quantitative genetics) experiment is designed to quantify the heritability of traits in Echinacea angustifolia. We are especially interested in Darwinian fitness. Could fitness be heritable? During the summer of 2002 we crossed plants from the 1996 & 1997 cohorts of exPt1. We harvested heads, dissected achenes, and germinated seeds over the winter. In the Spring of 2003 we planted the resulting 4468 seedlings (this great number gave rise to this experiment’s nickname “big batch”). Start year: 2003 Location: Experimental plot 1 Overlaps with: qGen2 & qGen3 Physical specimens: We harvested 46 heads from qGen1 in 2017. These heads will be processed in the lab to determine achene counts and seed set. Data collected: We collected fitness measures using handheld computers. Products: We have an awesome dataset that we will share once the paper is published. Ruth Shaw is working on an analysis of the qGen1 dataset. You can find more information about Heritability of fitness–qGen1 and links to previous flog posts regarding this experiment at the background page for the experiment. 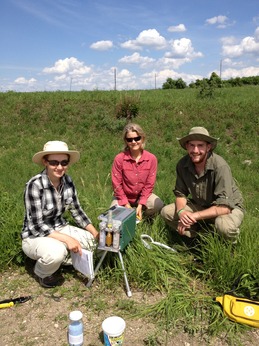 Reina, Pamela, and Mike with the photosynthesis machine used in Kittelson et al. (2015) In 2017, of the original 1,470 plants in INB2, 473 were still alive. Of the plants that were alive this year, only 4 were flowering (0.8%) and 71% have never flowered. Interestingly, there are differences in survival for each cross level. 31% of the most inbred plants were living in 2017, compared to 39% of the plants in the between-remnant cross level. All individuals were planted in 2006. The INB2 experiment investigates the relationship between inbreeding level and fitness in Echinacea angustifolia. Each plant in experiment INB2 originates from one of three cross types, depending on the relatedness of the parents: between maternal half siblings; between plants from the same remnant, but not sharing a maternal or paternal parent; and between individuals from different remnants. We continued to measure fitness and flowering phenology in these plants. Read previous posts about this experiment. Start year: 2006 Location: Experimental plot 1 Overlaps with: Phenology and fitness in P1, Inbreeding experiment–INB1 Physical specimens: We harvested 2 heads from INB2 that will be processed in the lab with other heads harvested from P1. Data collected: We used handheld computers to collect fitness data on all plants in INB2. Products: The below papers were published in summer 2015: Kittelson, P., S. Wagenius, R. Nielsen, S. Qazi, M. Howe, G. Kiefer, and R. G. Shaw. 2015. Leaf functional traits, herbivory, and genetic diversity in Echinacea: Implications for fragmented populations. Ecology 96:1877–1886. PDF Shaw, R. G., S. Wagenius and C. J. Geyer. 2015. The susceptibility of Echinacea angustifolia to a specialist aphid: eco-evolutionary perspective on genotypic variation and demographic consequences. Journal of Ecology 103:809-818. PDF You can find more information about the Inbreeding experiment–INB2 and links to previous flog posts regarding this experiment at the background page for the experiment. 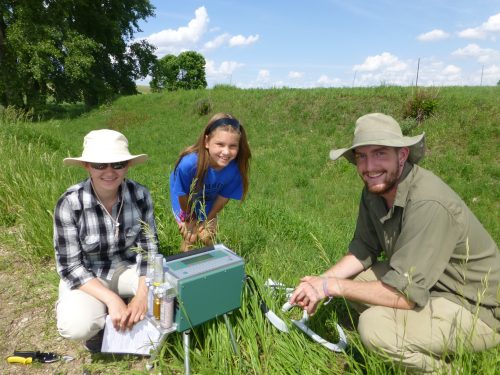 Reina, Hattie, and Mike with the instrument used to measure photosynthesis in 2013. In 2017, of the original 557 plants in INB1, 180 were still alive. Of the plants that were alive this year, 7 (4%) were flowering and 23% have never flowered. Interestingly, there are differences in survival for each cross level. 21% of the most inbred plants were living in 2017, compared to 39% of the plants in the between remnant cross level. All individuals were planted in 2001. The INB1 experiment investigates the relationship between inbreeding level and fitness in Echinacea angustifolia. Each plant in experiment INB1 originates from one of three cross types, depending on the relatedness of the parents: between maternal half siblings; between plants from the same remnant, but not sharing a maternal or paternal parent; and between individuals from different remnants. We continued to measure fitness and flowering phenology in these plants. Read previous posts about this experiment.
Start year: 2001 Location: Experimental plot 1 Overlaps with: Phenology and fitness in P1 Physical specimens: We harvested 6 heads from INB1 that will be processed in the lab with other heads harvested from P1. Data collected: We used handheld computers to collect fitness data on all plants in INB1. Products: The below papers were published in summer 2015: Kittelson, P., S. Wagenius, R. Nielsen, S. Qazi, M. Howe, G. Kiefer, and R. G. Shaw. 2015. Leaf functional traits, herbivory, and genetic diversity in Echinacea: Implications for fragmented populations. Ecology 96:1877–1886. PDF Shaw, R. G., S. Wagenius and C. J. Geyer. 2015. The susceptibility of Echinacea angustifolia to a specialist aphid: eco-evolutionary perspective on genotypic variation and demographic consequences. Journal of Ecology 103:809-818. PDF You can find more information about the Inbreeding experiment–INB1 and links to previous flog posts regarding this experiment at the background page for the experiment. 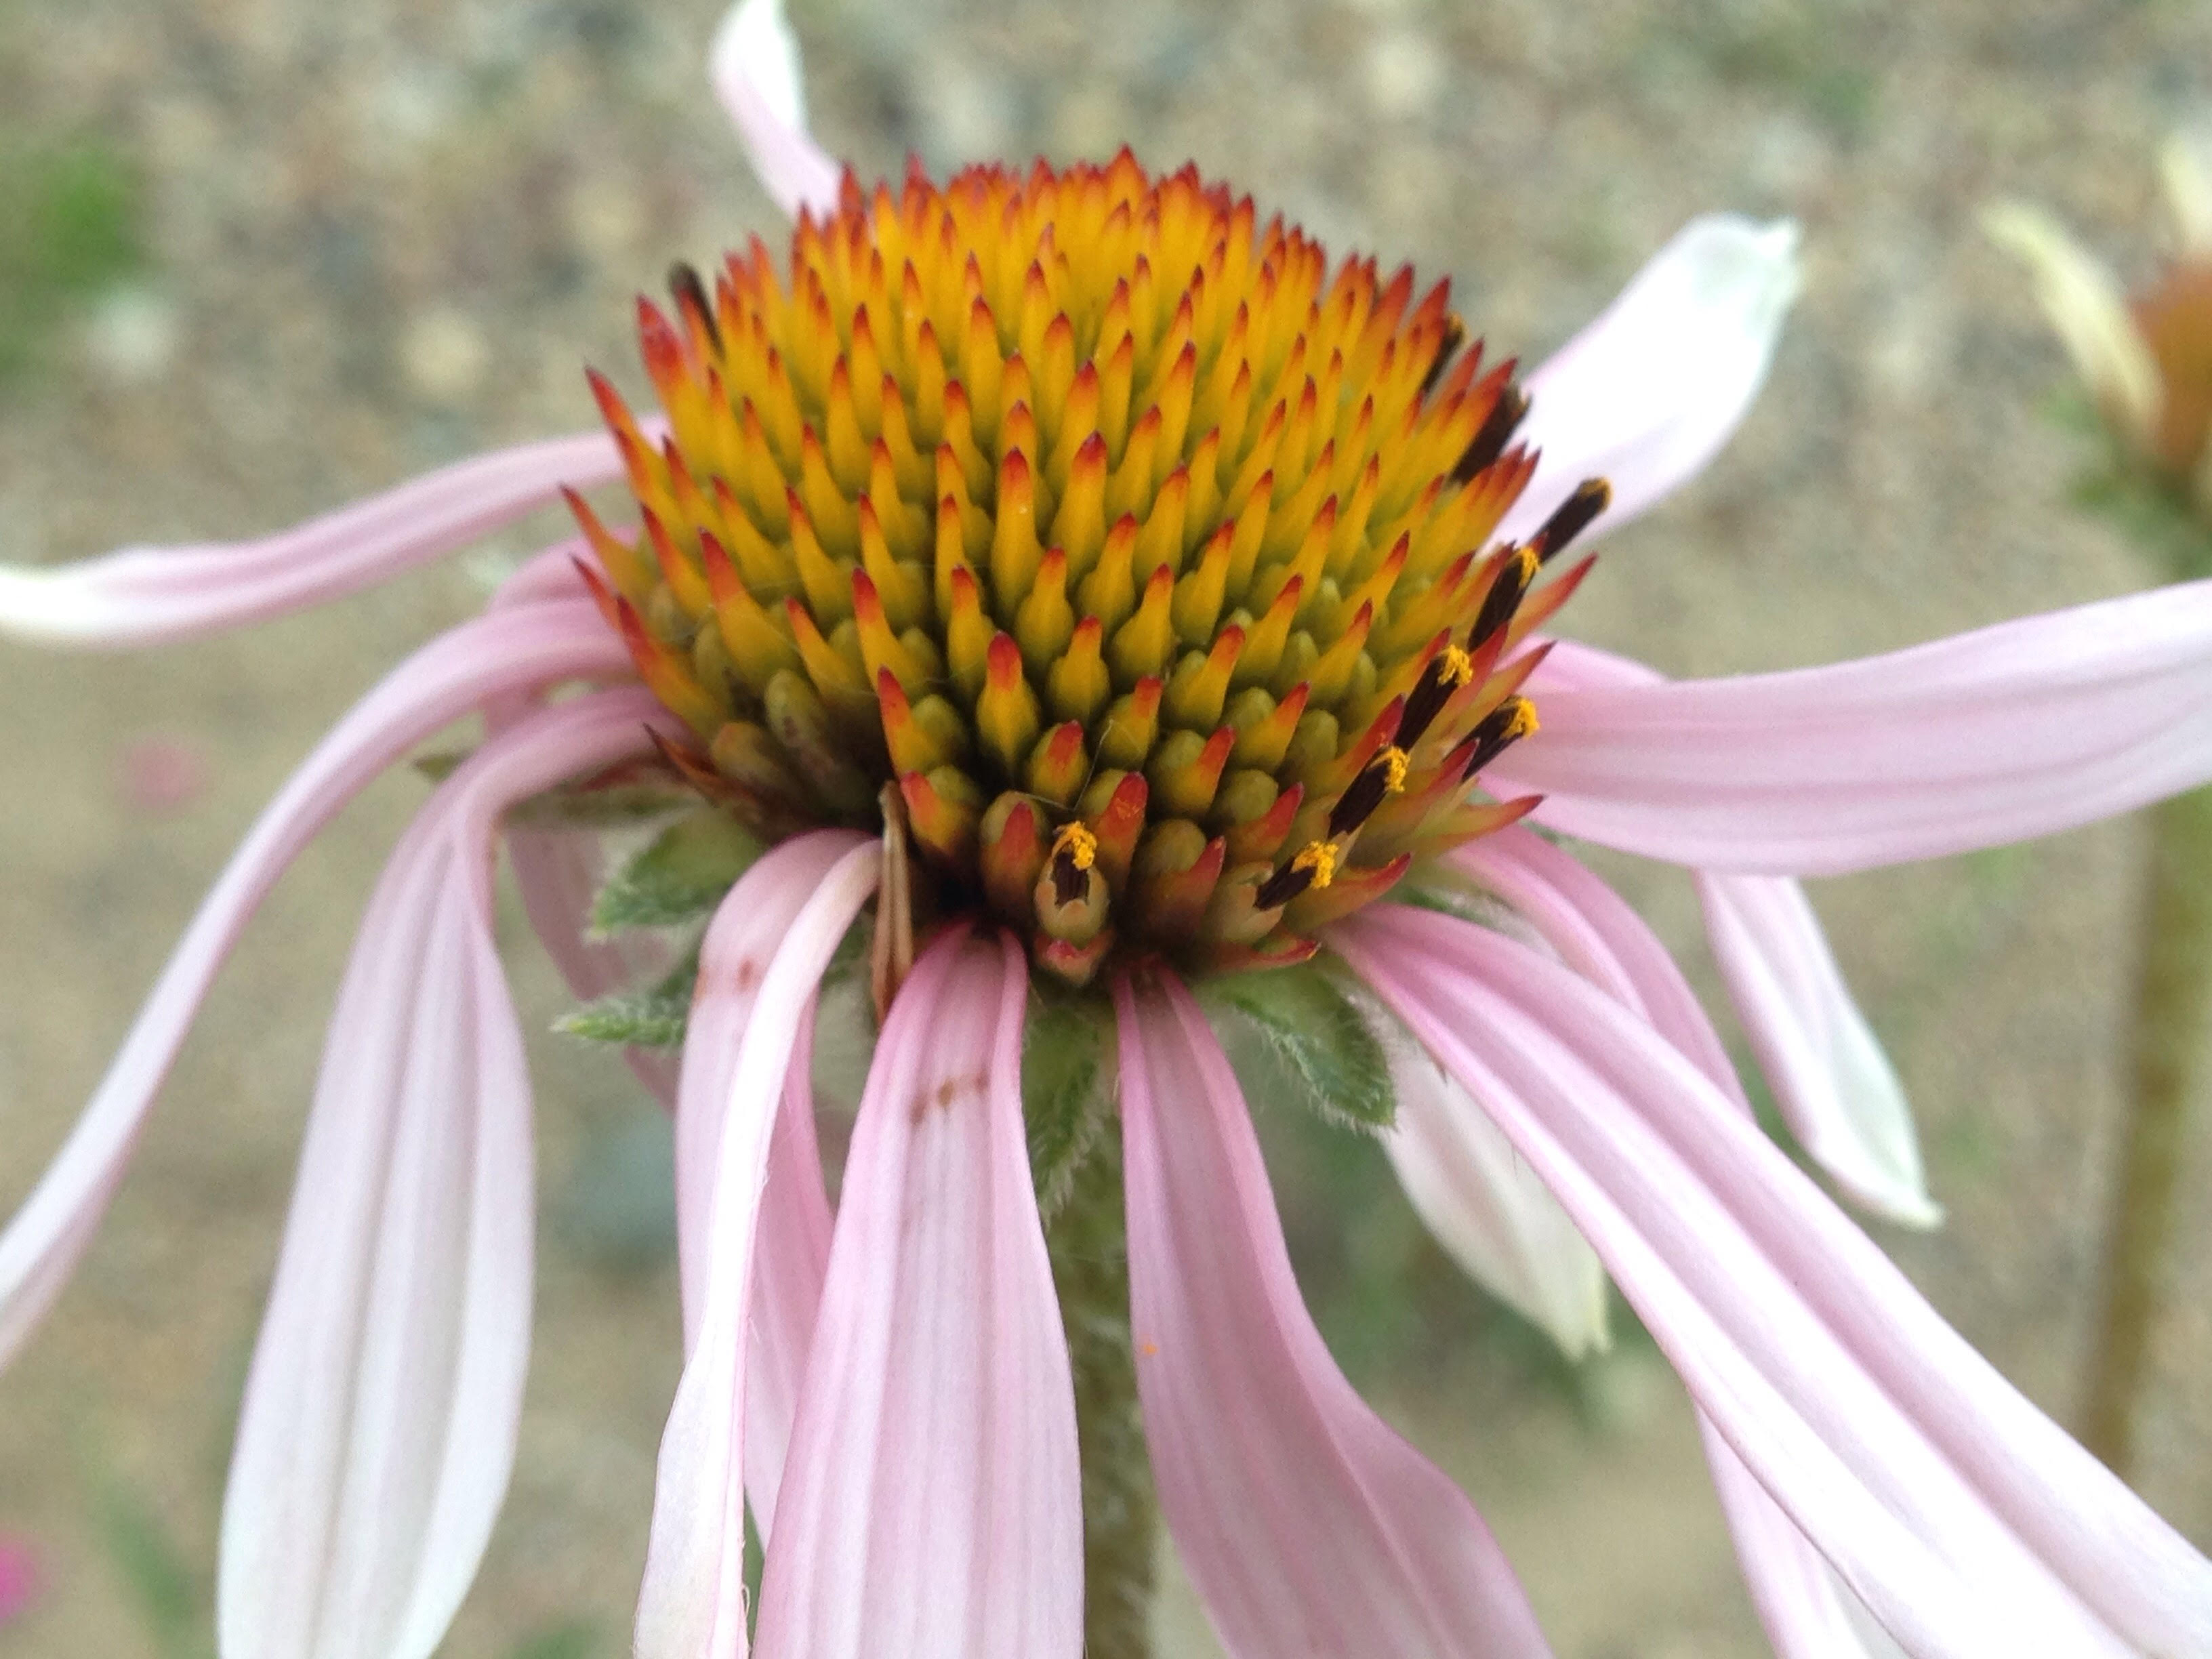 In 2017 only 2% of the surviving members of the 1996 cohort flowered! In 2017 only 7 plants flowered of the surviving 284 plants in the 1996 cohort. That means that 44% of the original plants are surviving and only 2% of the living individuals flowered! Five percent of living individuals flowered in 2016. In contrast, 45% of living plants flowered in 2015, followed by 37%, 34%, and 40% from 2014 back to 2012. We found that of the original 646 individuals, 284 were alive in 2017, only 7 fewer than last year. We are not sure why so few plants flowered this year. It’s possible that lack of fire in the plot influenced flowering rates. This plot was due for a prescribed burn in spring 2017, but weather and scheduling conflicts kept us from burning. The 1996 cohort has the oldest Echinacea plants in experimental plot 1; they are 21 years old. They are part of a common garden experiment designed to study differences in fitness and life history characteristics among remnant populations. Every year, members of Team Echinacea assess survival and measure plant growth and fitness traits including plant status (i.e. if it is flowering or basal), plant height, leaf count, and number of flowering heads. We harvest all flowering heads in the fall, count all achenes, and estimate seed set for each head in the lab. Start year: 1996 Location: Experimental plot 1 Overlaps with: phenology in experimental plots, qGen3, pollen addition/exclusion Physical specimens:
Data collected:
Products:
You can find more information about the 1996 cohort and links to previous flog posts regarding this experiment at the background page for the experiment. In 2017, we checked 119 focal plants at 12 remnants for nearby seedlings found in previous years. We found 123 out of the original 955 seedlings (25 fewer than the 148 found last fall). Although challenging to obtain, information about the early stages of E. angustifolia in remnants is valuable.  Generations of Echinacea: A fallen head dropped achenes that have germinated. How many seedlings do you see? These data tell us how many years it takes plants to flower (a LONG time!) and the mortality rate for seedlings in remnants. Between the summers of 2007 and 2013, team Echinacea observed the recruitment of Echinacea angustifolia seedlings around focal plants at 13 different prairie remnants. The locations of these seedlings were mapped relative to each focal plant and the seedlings (now former seedlings) are revisited each year. For each of these former seedlings, we make a record each year updating its status (e.g., basal, not found), rosette count, and leaf lengths. We also try to update the maps, which are kept on paper and passed down through the years. Year started: 2007 Location: East Elk Lake Road, East Riley, East of Town Hall, KJ’s, Loeffler’s Corner, Landfill, Nessman, Riley, Steven’s Approach, South of Golf Course remnants and Staffanson Prairie Preserve. Overlaps with: Demographic census in remnants Data collected:
Products: Amy Dykstra used seedling survival data from 2010 and 2011 to model population growth rates as a part of her dissertation. You can read more about the seedling establishment experiment and links to previous flog entries about the experiment on the background page for this experiment.
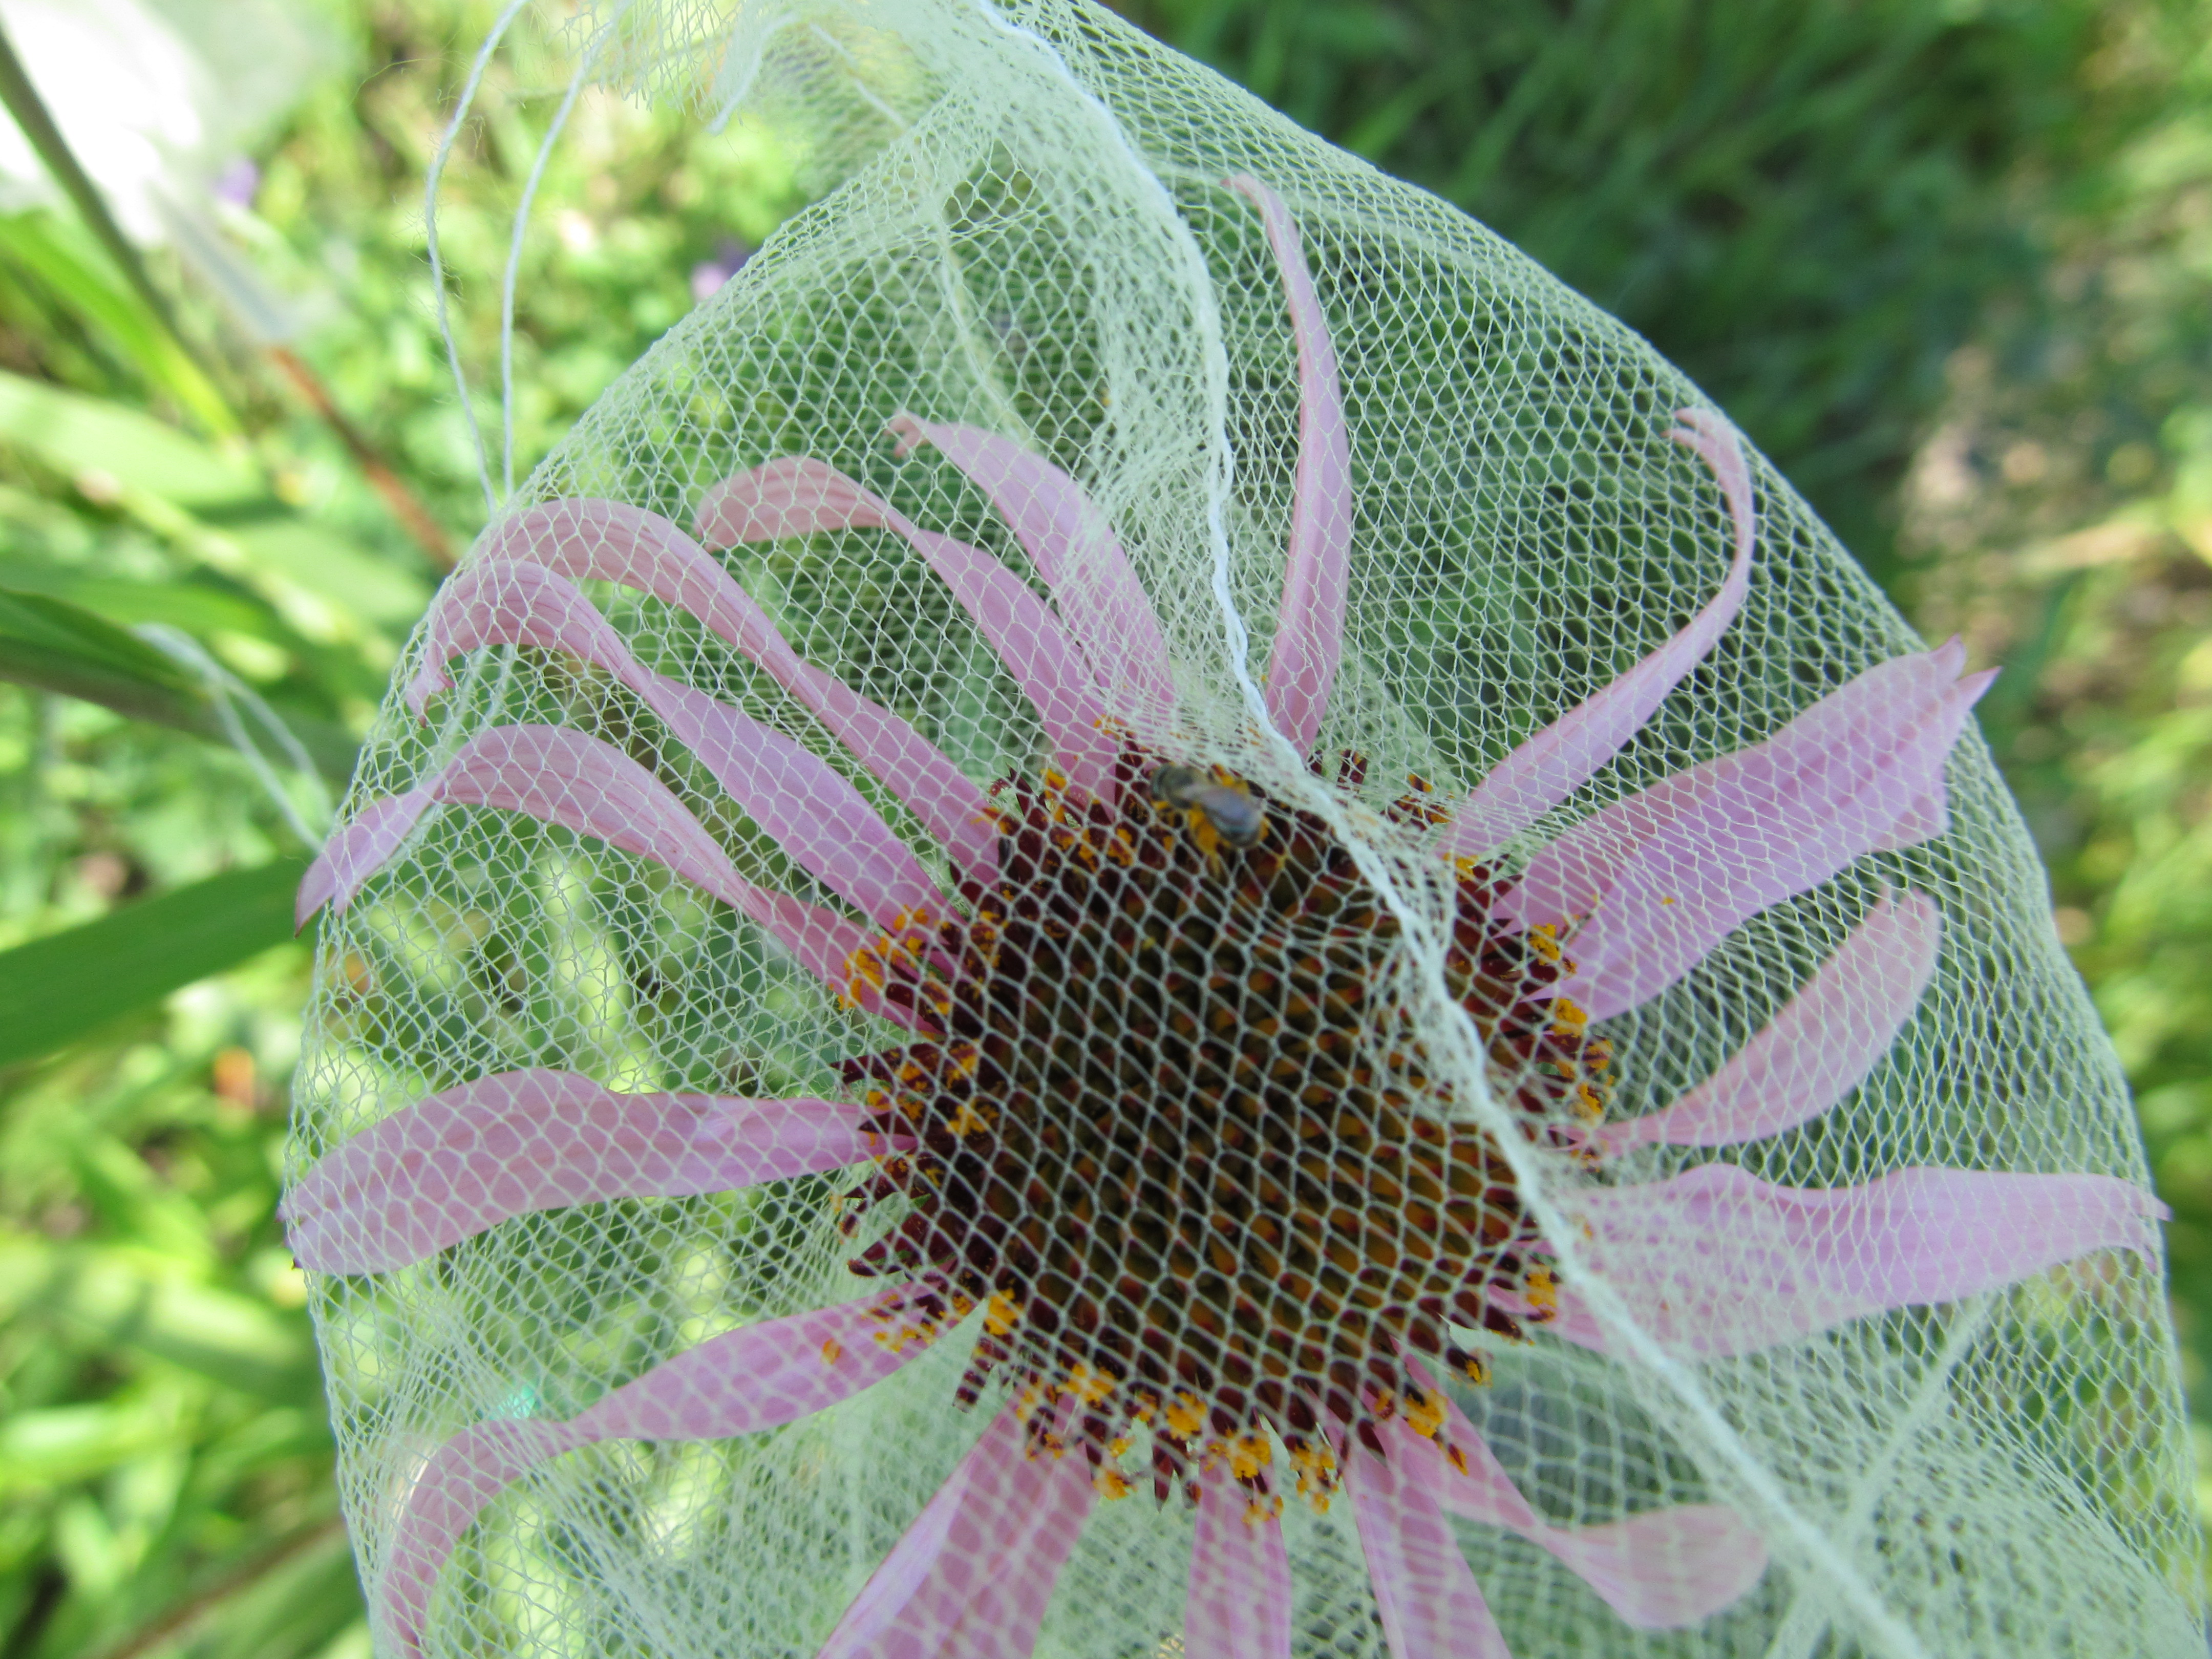 Echinacea head with pollinator exclusion bag. Does receiving the maximum amount of pollination vs. no pollen at all affect a plant’s longevity or likelihood of flowering in subsequent years? We are trying to find out in this long-term experiment, but flowering rates have been so low in the past few years we are not learning much. This summer, only three plants flowered of the 27 plants remaining in the pollen addition and exclusion experiment. We continued experimental treatments on these flowering plants and recorded fitness characteristics of all plants in the experiment. Of the original 38 plants in this experiment, 13 of the exclusion plants and 14 of the pollen addition plants are still alive. In this experiment we assess the long-term effects of pollen addition and exclusion on plant fitness. In 2012 and 2013 we identified flowering E. angustifolia plants in experimental plot 1 and randomly assigned one of two treatments to each: pollen addition or pollen exclusion. When plants flower in subsequent years they receive the same treatment they were originally assigned. Because flowering rates have been so low in 2016 & 2017, differences in flowering due to treatment are not detectable. Start year: 2012 Location: Experimental plot 1 Physical specimens: We harvested three flowering heads from this experiment that will be processed with the rest of the experimental plot 1 heads to determine achene count and proportion of full achenes. Data collected: We recorded data electronically as part of the overall assessment of plant fitness in experimental plot 1. We recorded dates of bagging heads and pollen addition on paper datasheets. You can find more information about the pollen addition and exclusion experiment and links to previous flog posts regarding this experiment at the background page for the experiment. |
|
|||||||||||||||||||
|
© 2025 The Echinacea Project - All Rights Reserved - Log in Powered by WordPress & Atahualpa |
||||||||||||||||||||
 In 2017 Stuart and Lea relocated and measured 19 individuals of the 381 seedlings originally found. These plants had 1-4 leaves; the longest leaf was 32 cm. It should be interesting to see which individuals are hanging on!