|
|
Today was the first day of the field season. We met at the Hjelm house at 8:30 but quickly left for a tour of the largest prairie remnant that we will be working in, Staffanson Prairie Preserve. We got a lesson in the history of the landscape from Stuart. We learned about geologic features in western Minnesota that were formed by glaciers almost 10,000 years ago! We also learned about the role European settlement had on the size and composition of prairie communities. We had a good look at many of the earliest plants to flower at Staffanson. We also got to see how big of a difference a burn makes in the prairie since the west unit was burned this spring. As we were leaving Staffanson it began to rain and we had to cut our tour of the remnant prairies in Solemn Township short.
After lunch Stuart gave a talk about some of the work that has been done on the project since it started. He talked about the Echinacea angustifolia mating scene and how the different dimensions of reproduction affect plant fitness. Distance, timing and compatibility can all play a role in the reproductive success of Echinacea! Jennifer also gave a talk on her work with pollinators and Echinacea, we learned about how varying taxa of pollinator affects the quality and quantity of pollen that a plant will receive. Her talk gave us a lot of good information to build a foundation for the work that will be done this summer with pollinators!
We called it a day a little early because of the rainy weather and so we could do some reading and think about what we want our independent projects to be for the summer. Tomorrow looks like it will be a little bit nicer or at least it won’t rain so hopefully we will be able to visit a few remnants and get started measuring seedlings that are apart of the Q3 experiment!
 A dragonfly I spotted at Staffanson trying to warm up early in the morning, hopefully it didn’t get too beaten up by the rain! Stuart is giving his talk about the 3 dimensions of the Echinacea mating scene!
Echinacea Project 2016
Hi everyone! My name is Rachel Rausch, and I’m so excited to be a part of Team Echinacea this summer. I graduated from Morris Area High School a few weeks ago, and will be attending the University of Minnesota Twin Cities this fall, studying Psychology.
Research Interests
Because UMN is a research institution, I’m looking forward to getting research experience this summer. This will be my first hands on experience with conservation biology and I’m excited to learn about the research process.
Statement
I’m from Morris, MN which is about 30 miles from Kensington. I In my free time, I love to read, rollerblade, and enjoy Minnesota’s 10,000 lakes. I love learning new things, and in my 18 years on earth have attempted to knit, play piano, weld, unicycle, and make an ice sculpture.
My name is Chris Woolridge and I’m very excited to begin as a Seasonal Researcher with the Echinacea Project this summer! I’ll be helping Danny and the citizen scientists in the lab while the rest of the team is in Minnesota conducting field work. I’m currently a graduate student in the Plant Biology and Conservation Program at the Chicago Botanic Garden and Northwestern University. My research is focused on better informing seed sourcing for restorations. Some researchers and managers have proposed sourcing seed from more southern latitudes to foster populations that are pre-adapted to climate change. In order to test this strategy’s feasibility, I’m conducting a common garden experiment in Grayslake, IL, investigating relative fitness of plants sourced across a latitudinal gradient in five savanna/prairie species used in restorations. With that being said, I’m very interested in the questions the Echinacea Project is asking and I’m thrilled to be joining the team!

Synchrony between plants is important as higher synchrony with other plants leads to more potential pollen sources and a greater likelihood of a seed being pollinated and becoming viable. At this point, synchrony is measured by counting the number of nearby flowering echinacea plants, but my malo curve data allows us to measure synchrony using the number of florets open on a given day for the entire population and comparing it to the number of florets for a given plant. As shown by the graph below, measuring synchrony by counting the number of flowering plants can overestimate synchrony later in the season when flowering plants have less open florets. Time to explore these graphs for different populations and look at the potential impacts.

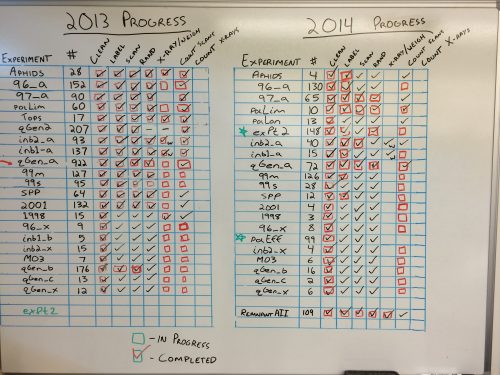
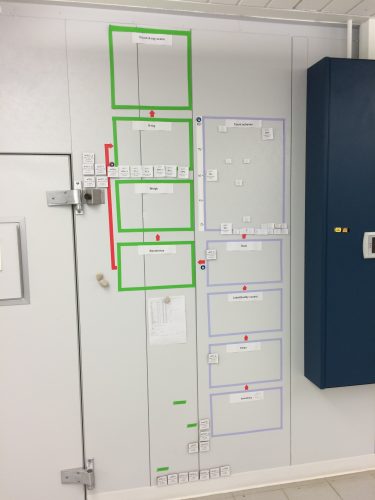
Though Stuart, Gretel, and Amy will be headed to Minnesota for the summer, our wonderful team of volunteers will still be here in Illinois working hard. We’ve used a couple systems to measure progress in the past few years but we’re going to make a simplified version for the summer before completely redoing our lab workflow visualization. We wanted to give our progress boards a proper send off before replacing them with a simpler summer-oriented progress board. More details to come!
The progress board before being erased.  The progress wall before tape removal
After working on my analysis for a few days I have realized that whether or not the head is unique to an Echinacea plant does not affect the malo curve for the individual head, or in real world terms, it doesn’t affect the flowering schedule of the head. This conclusion brought up two more questions.
The first question I have is what, if anything, explains the variations in the malo curve for the head if its uniqueness to the plant doesn’t. To try to answer this question I will be investigating is including the population of origin for the plant and the year it was planted in the investigation. I hope that this information will shed some light on the variations in the malo curves.
The second questions I have is how do multiple heads on an Echinacea plant interact to form the malo curve of the plant as a whole. The first thing I did was graph all the heads on a common plant on the same graph, which produced a lot of variation.
 Two heads with no overlap.  Two heads with almost complete overlap.  A plant with 6 heads! Now that I’ve visualized the differences in the data, I’m excited by all the variation that I see. My next step is to produce malo curves for the plants as a whole and start an analysis. With two viable paths of investigation, I’m expecting a lot of work in the next few days.
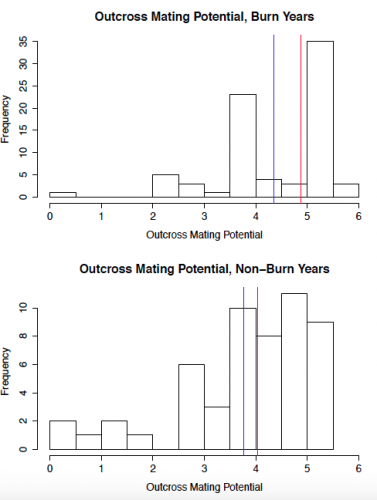
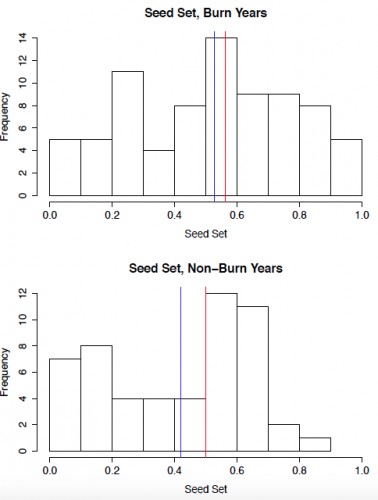
For the past several weeks, I have been busily going through tons of data from previous years in an effort to isolate only the data I need for my project. As a reminder, I’m looking at how prairie fire changes the mating scene and mate availability for Echinacea. I am using data from 1996, 1998, 2007, 2009, 2012, 2014, and 2015. With the exception of 2015 when no burn occurred, part of Staffanson Prairie Preserve underwent a controlled burn during each of these years.
From a file containing all seed set data for all plants that the Echinacea Project has ever collected, I extracted data for plants that flowered in both 2015 and at least one of the previous burn years. I ended up with 26 plants that met this description, and I will compare reproductive success of each of these plants on an individual basis in burn years compared to non-burn years.
To start out, I created some histograms of the data to get a quick insight into patterns that might be present. In order to roughly quantify the quality of the mating scene for a given plant, I calculated outcross mating potential (OMP), which takes into account the distances to the 6 nearest flowering neighbors. A higher value indicates a greater density of available mates. The second set of histograms shows seed set, with a higher number indicating greater reproductive success. While I will need to conduct statistical analyses to get a better understanding of what these data mean, initial impressions indicate that both the mating scene and reproductive success may be better in burn years.
 
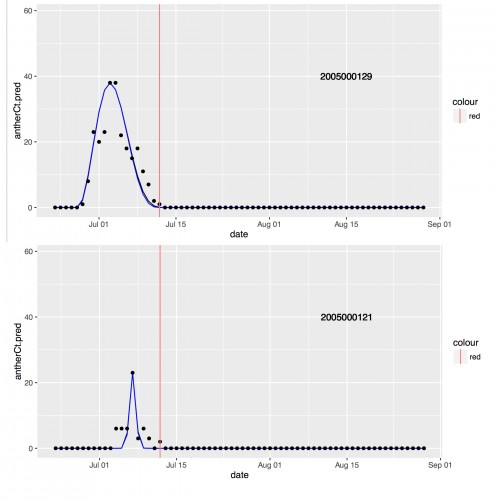
This week I started investigating the Malo curves and visualizing the data. In March of 2014, Lou, one of the citizen scientists that volunteers in the Echinacea Lab, wrote a program to take the daily flowering data collected in 2005 and output the 5 parameters that are needed to draw the Malo curves for individual heads. While these parameters are needed to draw the exponential sine functions, they also act as direct proxies for different phenological features like the start date of flowering, the maximum number of flowers open on a single day and more. So, I have 347 Malo curves drawn for me and lots of data to utilize in my analysis.
This photo shows 2 of the 347 curves that have been drawn. The black dots represent the actual number of flowers open on a given day, while the blue curve was drawn utilizing the parameter’s calculated by Lou’s program. The main focus of my analysis will be investigating how these curves vary, if at all, based on whether or not the head came from an Echinacea plant with other heads or if it was the only head on that plant. So, my first step was to create histograms for each of the 5 variables.
 This is the histogram for one of the parameters that represents the duration of flowering a single head experiences. The red line represents the mean flowering duration, while the blue line represents the median. After my preliminary investigation, it looks like none of the parameters, and therefore the Malo curves, vary based on the number of heads on the original plant. My next step is to utilize statistical tests like Nonmetric Multi-Dimensional Scaling (NMDS) and MANOVA, to determine if and how these parameters are related to each other. Stay tuned!
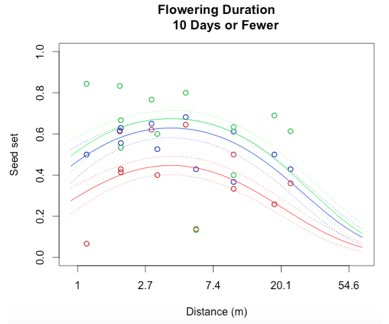
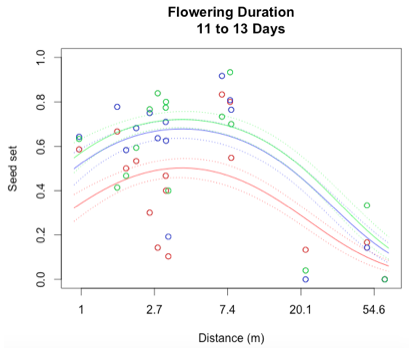
I successfully created a generalized linear model to describe reproductive success at Staffanson Prairie Preserve for the 2015 season. I started out with a model containing distance to the 3rd nearest neighbor, flowering start date, flowering duration, section of head from with the achene came, and all interactions between these main effects. In addition, I included both linear and quadratic terms for distance, start date, and duration. The purpose of including a quadratic term is to test for evidence of curvature in the relationship to seed set.
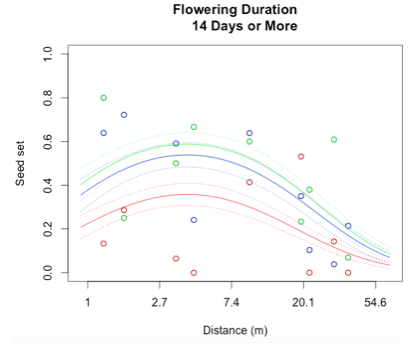
Through a process called backwards elimination, I removed all terms from the model that did not have a significant impact on reproductive success. The final model I came up with contained both linear and quadratic terms distance and start date, as well as the section of head. No interactions were found to be significant. In the plots below, the raw data are shown as points, and the predicted valued from the model are shown as curves. There are three plots of seed set as a function of distance, with the three plots representing low (10 days or fewer), mid (11-13 days), or high (14 days or more) flowering duration. The colors correspond to section of head, with red being top, blue is middle, and green is bottom.
  
While this is an observational study, so attributing causation would be inappropriate, it is helpful to think about why these relationships may exist. The general trend with increasing distance and spatial isolation is that seed set and reproductive success decrease. This is probably because isolated plants have fewer available mates or may be visited by fewer pollinators. However, the relationship is curved and plants in very densely populated areas also have diminished seed set. This may be caused by overcrowding and competition between plants for pollinators in areas of high population density.
Seed set has a similar peak at mid-duration of flowering. One explanation for this phenomenon is that plants that flower for a very short period of time co-flower with fewer potential mates, so a longer flowering time would maximize the number of compatible mates flowering at the same time. However, it is also known that extended flowering can be a sign that the head has not been receiving sufficient pollen, explaining the negative relationship between duration and seed set seen at higher durations.
In the future, this model will be compared to similar models from previous years during which Staffanson underwent controlled burns. Any differences seen between the models may be indicative of how the mating scene changes during the year after a burn.
My name is Rachael Sarette and I am a Junior at Northwestern University studying Mathematics and Environmental Science. I’m originally from Minnesota, so it is exciting to be in the lab hanging out with so many fellow Minnesotans. I’ll be at the lab all day on Tuesdays and Thursdays as part of Chicago Field Studies, which consists of an internship and a class on the Environment, Science, and Sustainability.
This is me standing by my computer, where most of my work will be occurring. While I have some field experience collecting data for other experiments, this is my first experience working in a lab and analyzing data for my own research project. This quarter I will be using Echinacea data from 2005 and analyzing them with “Malo” curves, which are sine functions that model the number of flowers open on a single head at a given time. The basis of this analysis is this paper written by J.E. Malo: http://onlinelibrary.wiley.com/doi/10.1046/j.1365-2435.2002.00629.x/abstract
I’m excited to see where this data and this quarter will take me. Stay tuned for more updates.
|
|