|
||||
|
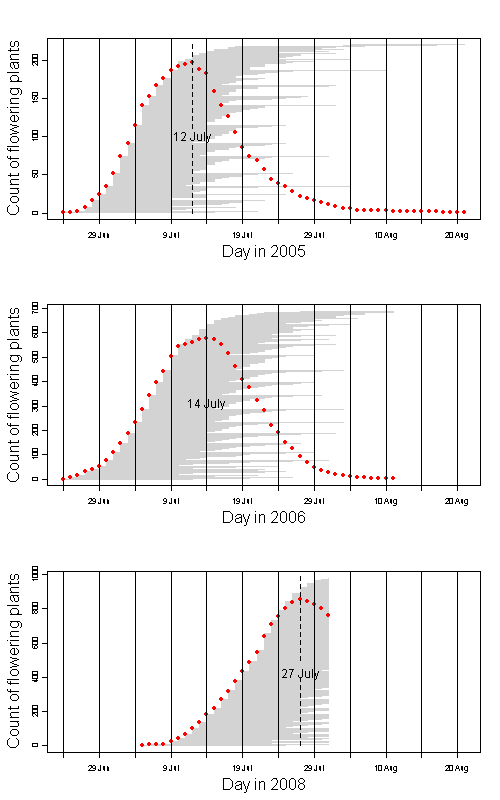
Echinacea angustifolia is flowering late this year. Peak flowering this year was 27 July. Peak was 12 July and 14 July in 2005 and 2006 respectively. Here’s a rough graph that shows flowering phenology in these years. Red dots are the count of fl plants on each day. Horizontal gray lines indicate days that each plant shed pollen.
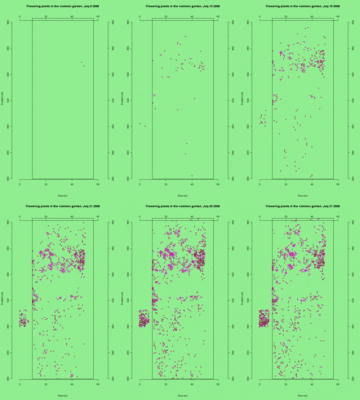
See the updated animation of flowering in the common garden experimental plot. This animated GIF file is a map of all plants that flowered in the CG on each day from July 5 to July 30th. Each dot represents a plants that’s flowering on the day (see upper right corner).
As of 25 July 2008: 1422 of 1850 heads have started to flower in the common garden. 171 heads are done flowering. 194 of 1033 plants have not started to flower. Here is a graph showing the number of heads that started to flower on each day. Here are some clarifications about how mfl and immfl should be filled in for heads in and past the flowering stage. Selecting status “Flowering” means that the last day of flowering is certainly 4 days away or longer. If the last day of flowering is 3 or fewer days away, then select “End of flowering.” Status Flowering It is not necessary to fill in mfl, ffl, or immfl. (mfl and Immfl are presumed to be well over 11). End of flowering Fill in mfl and immfl! (Both may 11.) Last day of flowering Fill in mfl and immfl! (immfl should be zero.) Done flowering Fill in mfl and immfl! (mfl & immfl should be zero.) Note 1: When the action is xxxx, then fill in a status (usually: flowering, end of flowering or done). Note 2: When status is “Flowering,” “End of flowering,” “Last day of flowering”, or “Done flowering” then don’t fill in ffl! We had a slow start to the flowering of Echinacea in the common garden for the 2008 season. Being one who gets excited about the abundance of Echinacea heads, I’m pleased to post the numbers of plants and flowering heads so far. The total number of plants flowering in the common garden as of 17 July 2008 (which is sure to increase as we find more hiding in the tall brome or decrease as they are grazed by deer): The total number of flowering heads identified as of 17 July 2008 (many still just buds): As of 17 July 2008: Here is a graph showing the number of heads that started to flower on each day. Hi all, We have just finished measuring and rechecking Hegg and I have final survival and growth info for this year. Unfortunately the last winter was really rough on my poor little plants and death was much higher than I would have liked. This also meant measuring and rechecking Hegg took a long time this year. Next year I must come up with a better method for measuring and rechecking. My current plan is to buy 50 meter tapes and measure along the 50 meter tape…I think this will dramatically reduce the time. Below is info for the last three years of survival and growth data. The first number the the year, then the average number of leaves, then the average height of tallest leaf (cm) and finally percent survival (cumulative). As you can see my plants barely grew (and that is only the ones that survived) and the average number of leaves actually went down. More disappointing is the survival which took at hit with the really long cold winter. That is it for Hegg this year…glad it is done…hopefully next year, with a site burn, my plants will grow more and death won’t be as bad. This animated GIF file is a map of all plants that flowered in the CG on each day from July 5 to July 15th. Each dot represents a plants that’s flowering on the day (see upper right corner).
Here’s a practice time lapse series for plant (28, 943) from July 2nd-6th. I’ll be photographing 16 plants every morning or until people get tired of driving me around to the garden. I didn’t hit the ‘thumbnail’ option when I uploaded this, so if you want to see it in its full glory, right-click and go to “view image”.  Even though I’ve marked the position and height of the tripod with flags, it looks like it’s difficult to get the same photo every time. The changing background, I suspect, is a result of the head growing upwards a bit, causing me to change the camera angle. This shouldn’t be as much of an issue in the pictures taken from above. Bonus! We are very interesting in observing (and participating in) the Echinacea mating season this summer. We are still waiting for the action to begin. Here is a map of the flowering plants in the main garden. Each dot represents a plant with 1 or more buds (immature capitula). The short purple bar indicates a plant with one bud, a long bar indicates two, and n short bars indicates n buds. In the main garden we found 869 plants with at least one bud and a total of 1572 buds. The most buds on a plant is 11. This is a modified “sunflower plot” that was generated with R.
We are waiting for the action to begin. At this time last year, like most years, Echinacea flowering was in full swing. We are prepared for the flowering to begin. We flagged all positions evenly divisible by 5. We mowed paths between rows so we can avoid stepping on plants. We have flagged every flowering plant. Note: don’t buy fluorescent colored pin flags. The flags tend to detach from the more frequently than non-fluorescent colors. What’s up, Forestry Suppliers? We weeded thistles and sweet clover, trapped gophers, found plants with Aster yellows, and are waiting for the action to begin. This flog entry from last year proved valuable. I just looked it up and followed the common garden maintenance protocol. |
||||
|
© 2024 The Echinacea Project - All Rights Reserved - Log in Powered by WordPress & Atahualpa |
||||


