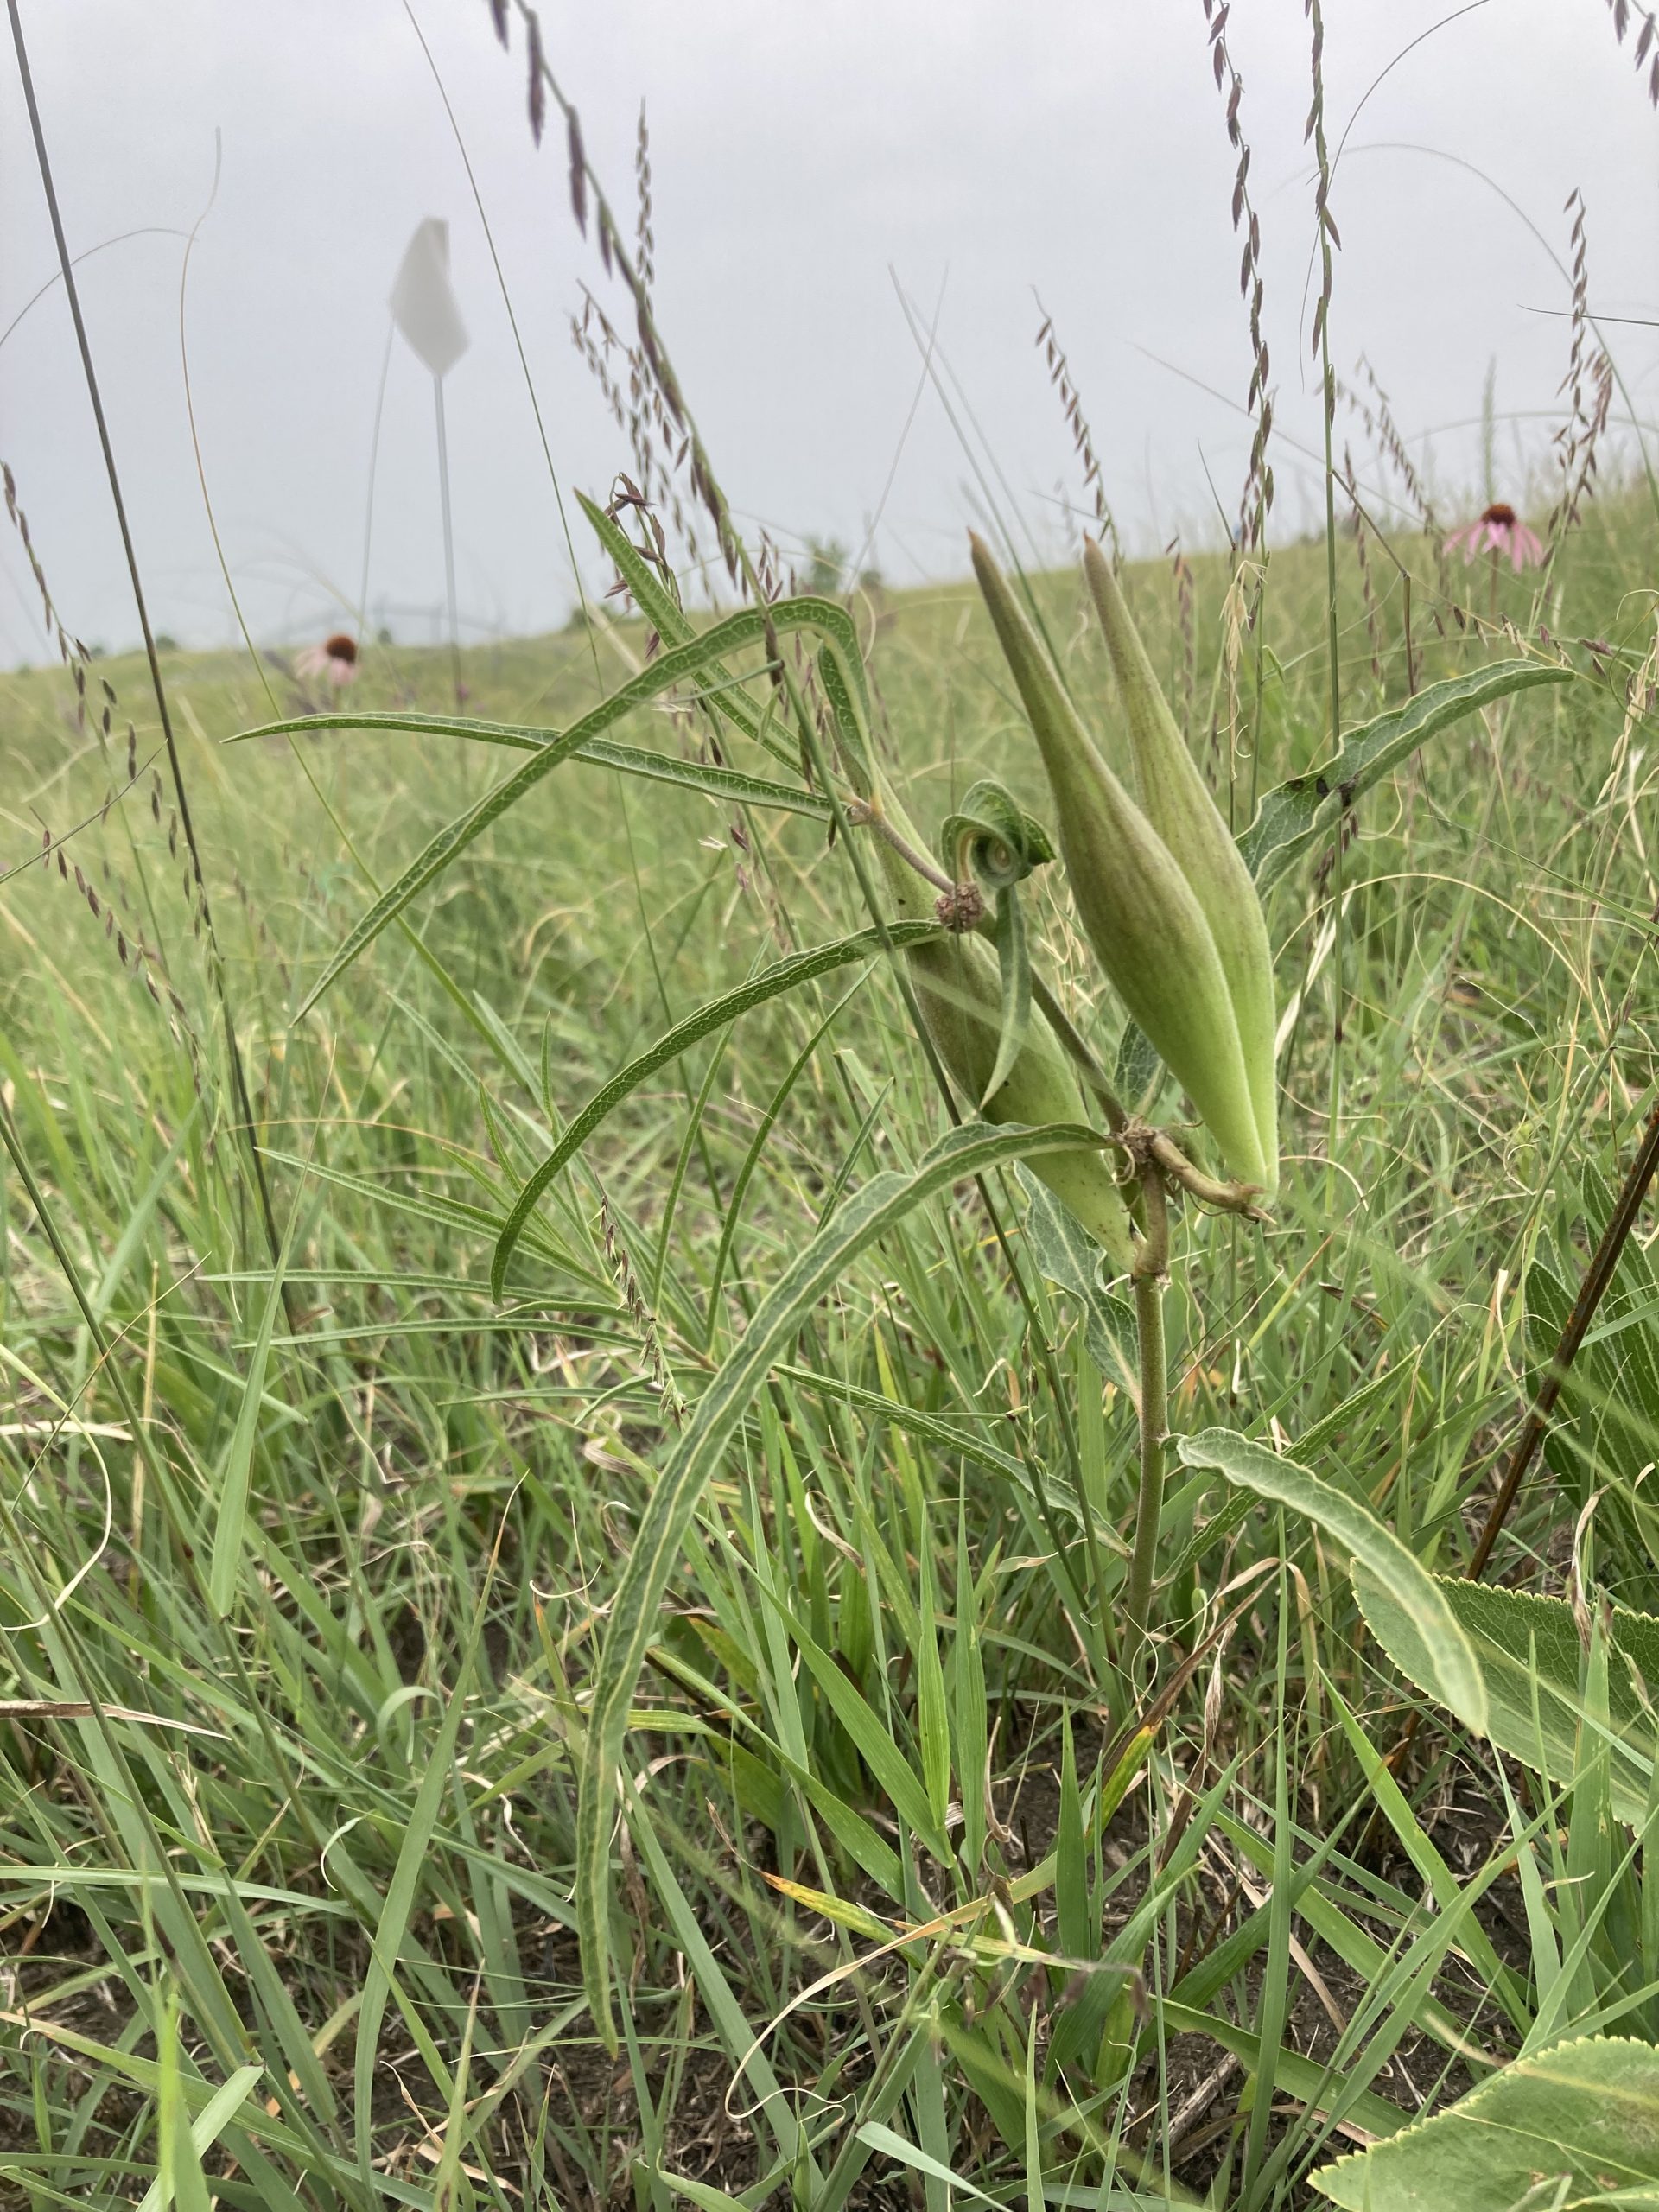
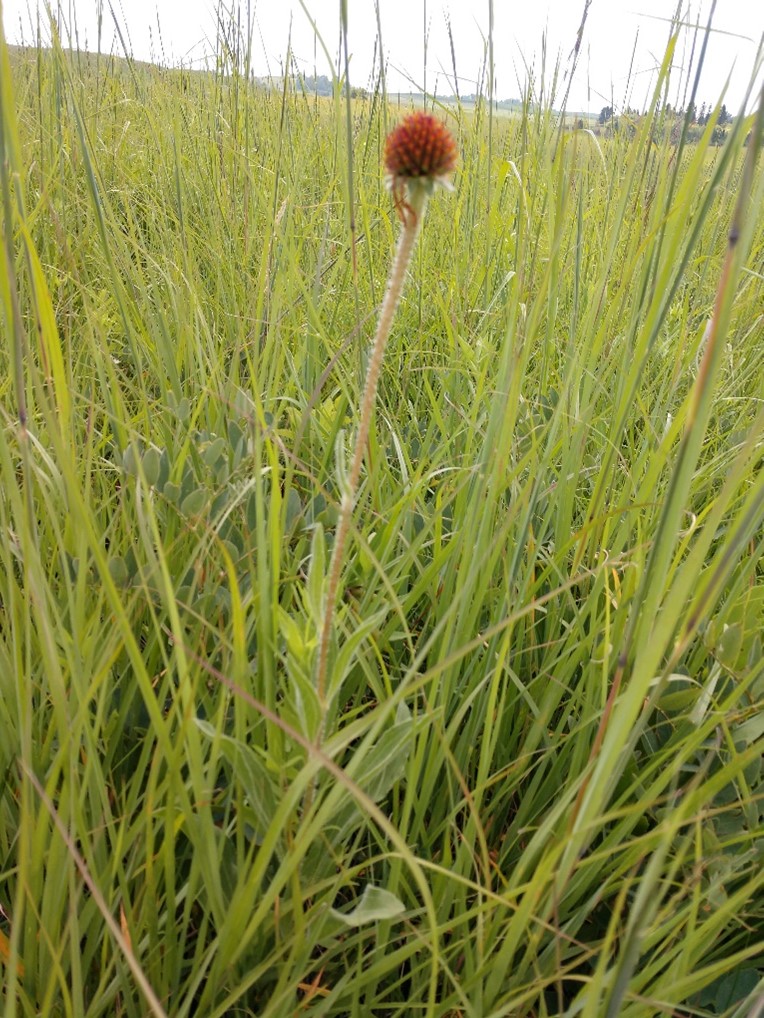
This summer we harvested seed pods from 25 Green Milkweed (Asclepias viridiflora) plants in the study area. Green Milkweed is uncommon and seems to be declining in our study area. This species prefers similar habitat to Echinacea. Plants tend to be sporadically distributed across dry prairies on steep hillsides, sandy soils, and well-drained gravelly areas. Our experience has been that flowering plants often fail to produce seed. We rarely find more than a handful of plants that produce pods in a given year.
Flowering Green Milkweed with bumblebee visitor at Staffanson.
Green Milkweed with three pods at Landfill East.
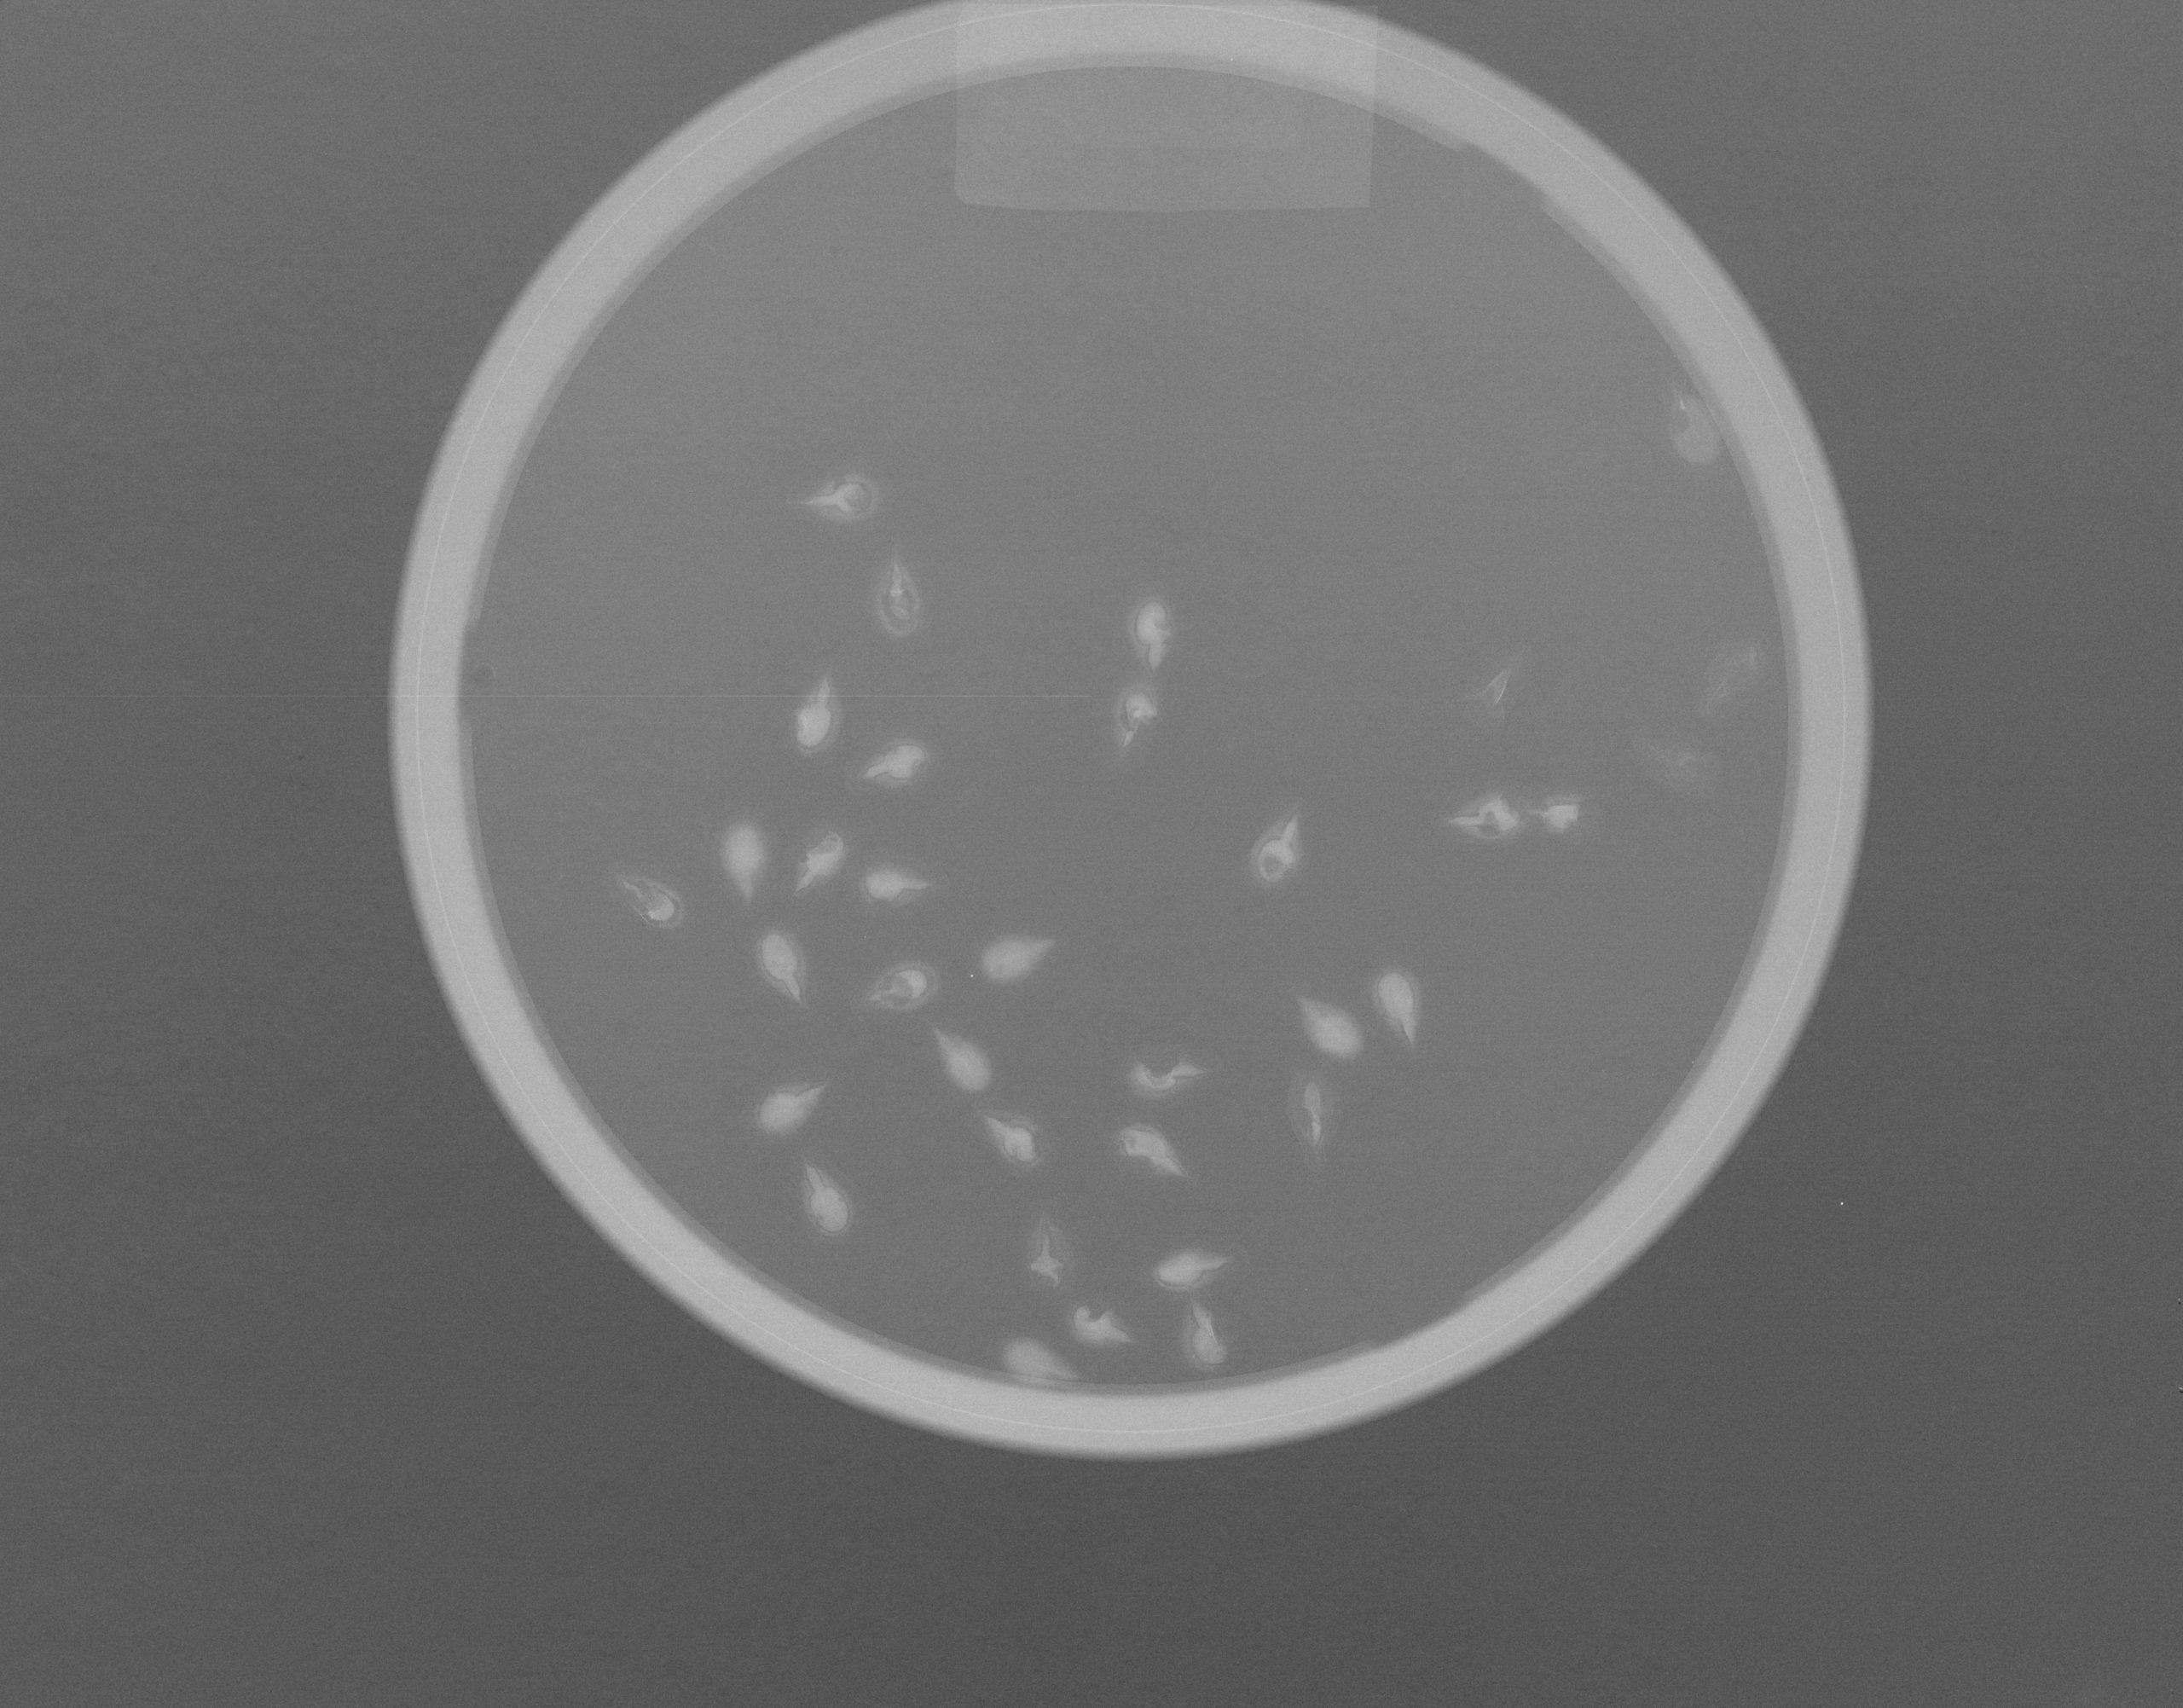
After harvesting and drying seeds, Jared cleaned seed by removing their fluffy coma. Jared then counted all the seeds and randomly selected a minimum of 30 seeds for x-raying. X-rays revealed variation. Some ovules lacked an embryo , others had whole, intact embryos. Many ovlues fell somewhere in between. They contained embryos that were undersized, shriveled, or fragmented. There was no external evidence of seed predation. The proportion of full ovules ranged from 0 to 100 percent. We are not sure whether “partials” reflect resource limitation and seed abortion, a form of late-acting self-incompatibility, or something else entirely. We are doing some research to help us interpret the biology underlying these patterns.
X-ray image of Green Milkweed seeds. Note the variation in embryo size, shape, and integrity in the x-ray image.
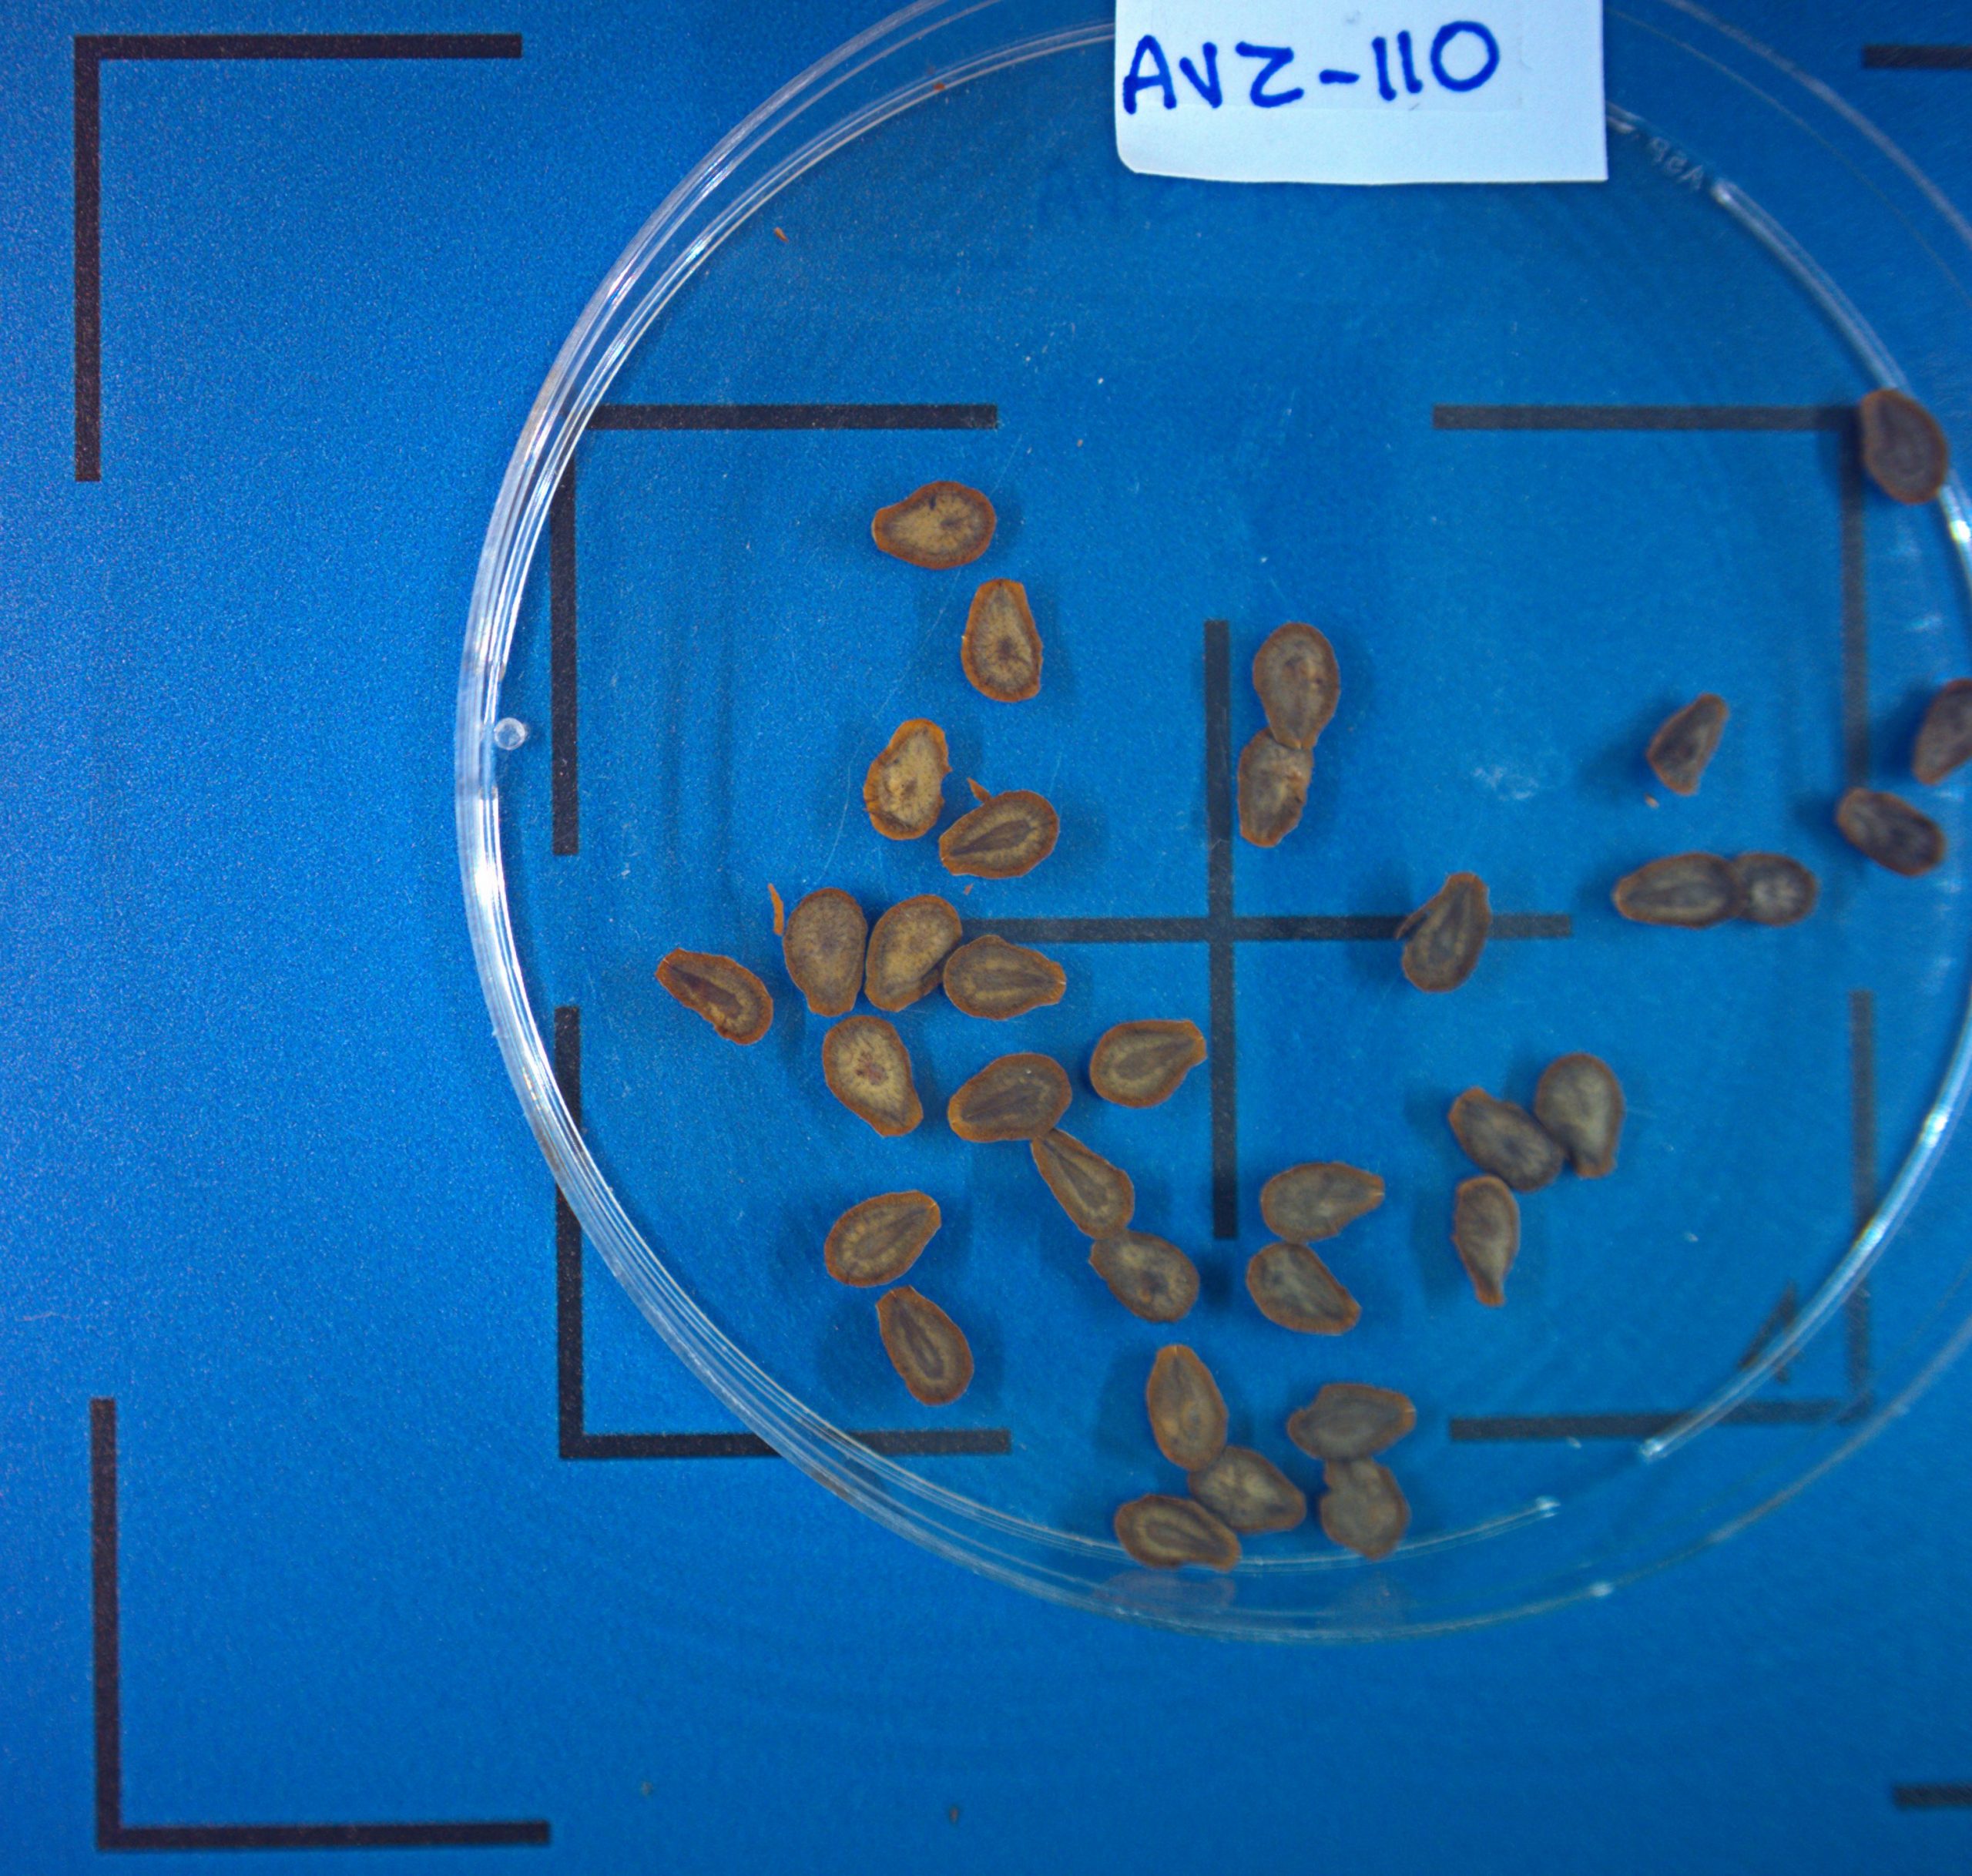
Scanned image of the same Green Milkweed seeds.
After cleaning, counting, and classifying, Jared prepared a subset of Green Milkweed seed for germination. CBG’s production greenhouse will germinate and grow 392 milkweed seedlings representing 15 maternal lines. We will plant these seedlings in an area south of P8. Although these plants grow slowly, our hope is that they will be an excellent resource for investigating milkweed pollination in a couple years. We also hope to harvest seed from these plants and include Green Milkweed in our seed mixes for restoration!
Team Echinacea continued the aphid addition and exclusion experiment started in 2011 by Katherine Muller. The original experiment included 100 plants selected from exPt01 which were each assigned to have aphids either added or excluded through multiple years. The intention is to assess the impact of the specialist herbivore Aphis echinaceae on Echinacea fitness.
In 2021, the aphid addition and exclusion project was conducted by Allie Radin with occasional help from other field crew members (often Emma Reineke). They located 26 living exclusion plants and 17 living addition plants. The experiment was conducted from July 9th to July 23rd, with the final visit consisting only of searching for aphids. No aphids were seen or moved in exPt01 this year.
Once again, there were very few aphids (actually, none) in exPt01. This is the second year in a row of missing aphids, raising other questions about where the aphids have gone, let alone their impact on the Echinacea plants. Allie and the team searched the experimental plot thoroughly to make sure no potential aphid hiding spot was left unturned. This included large plants from this year and last year, this year’s flowering plants, and plants which had aphids in previous years. Despite low aphid numbers, other insects such as beetles and thrips were present in the plot.
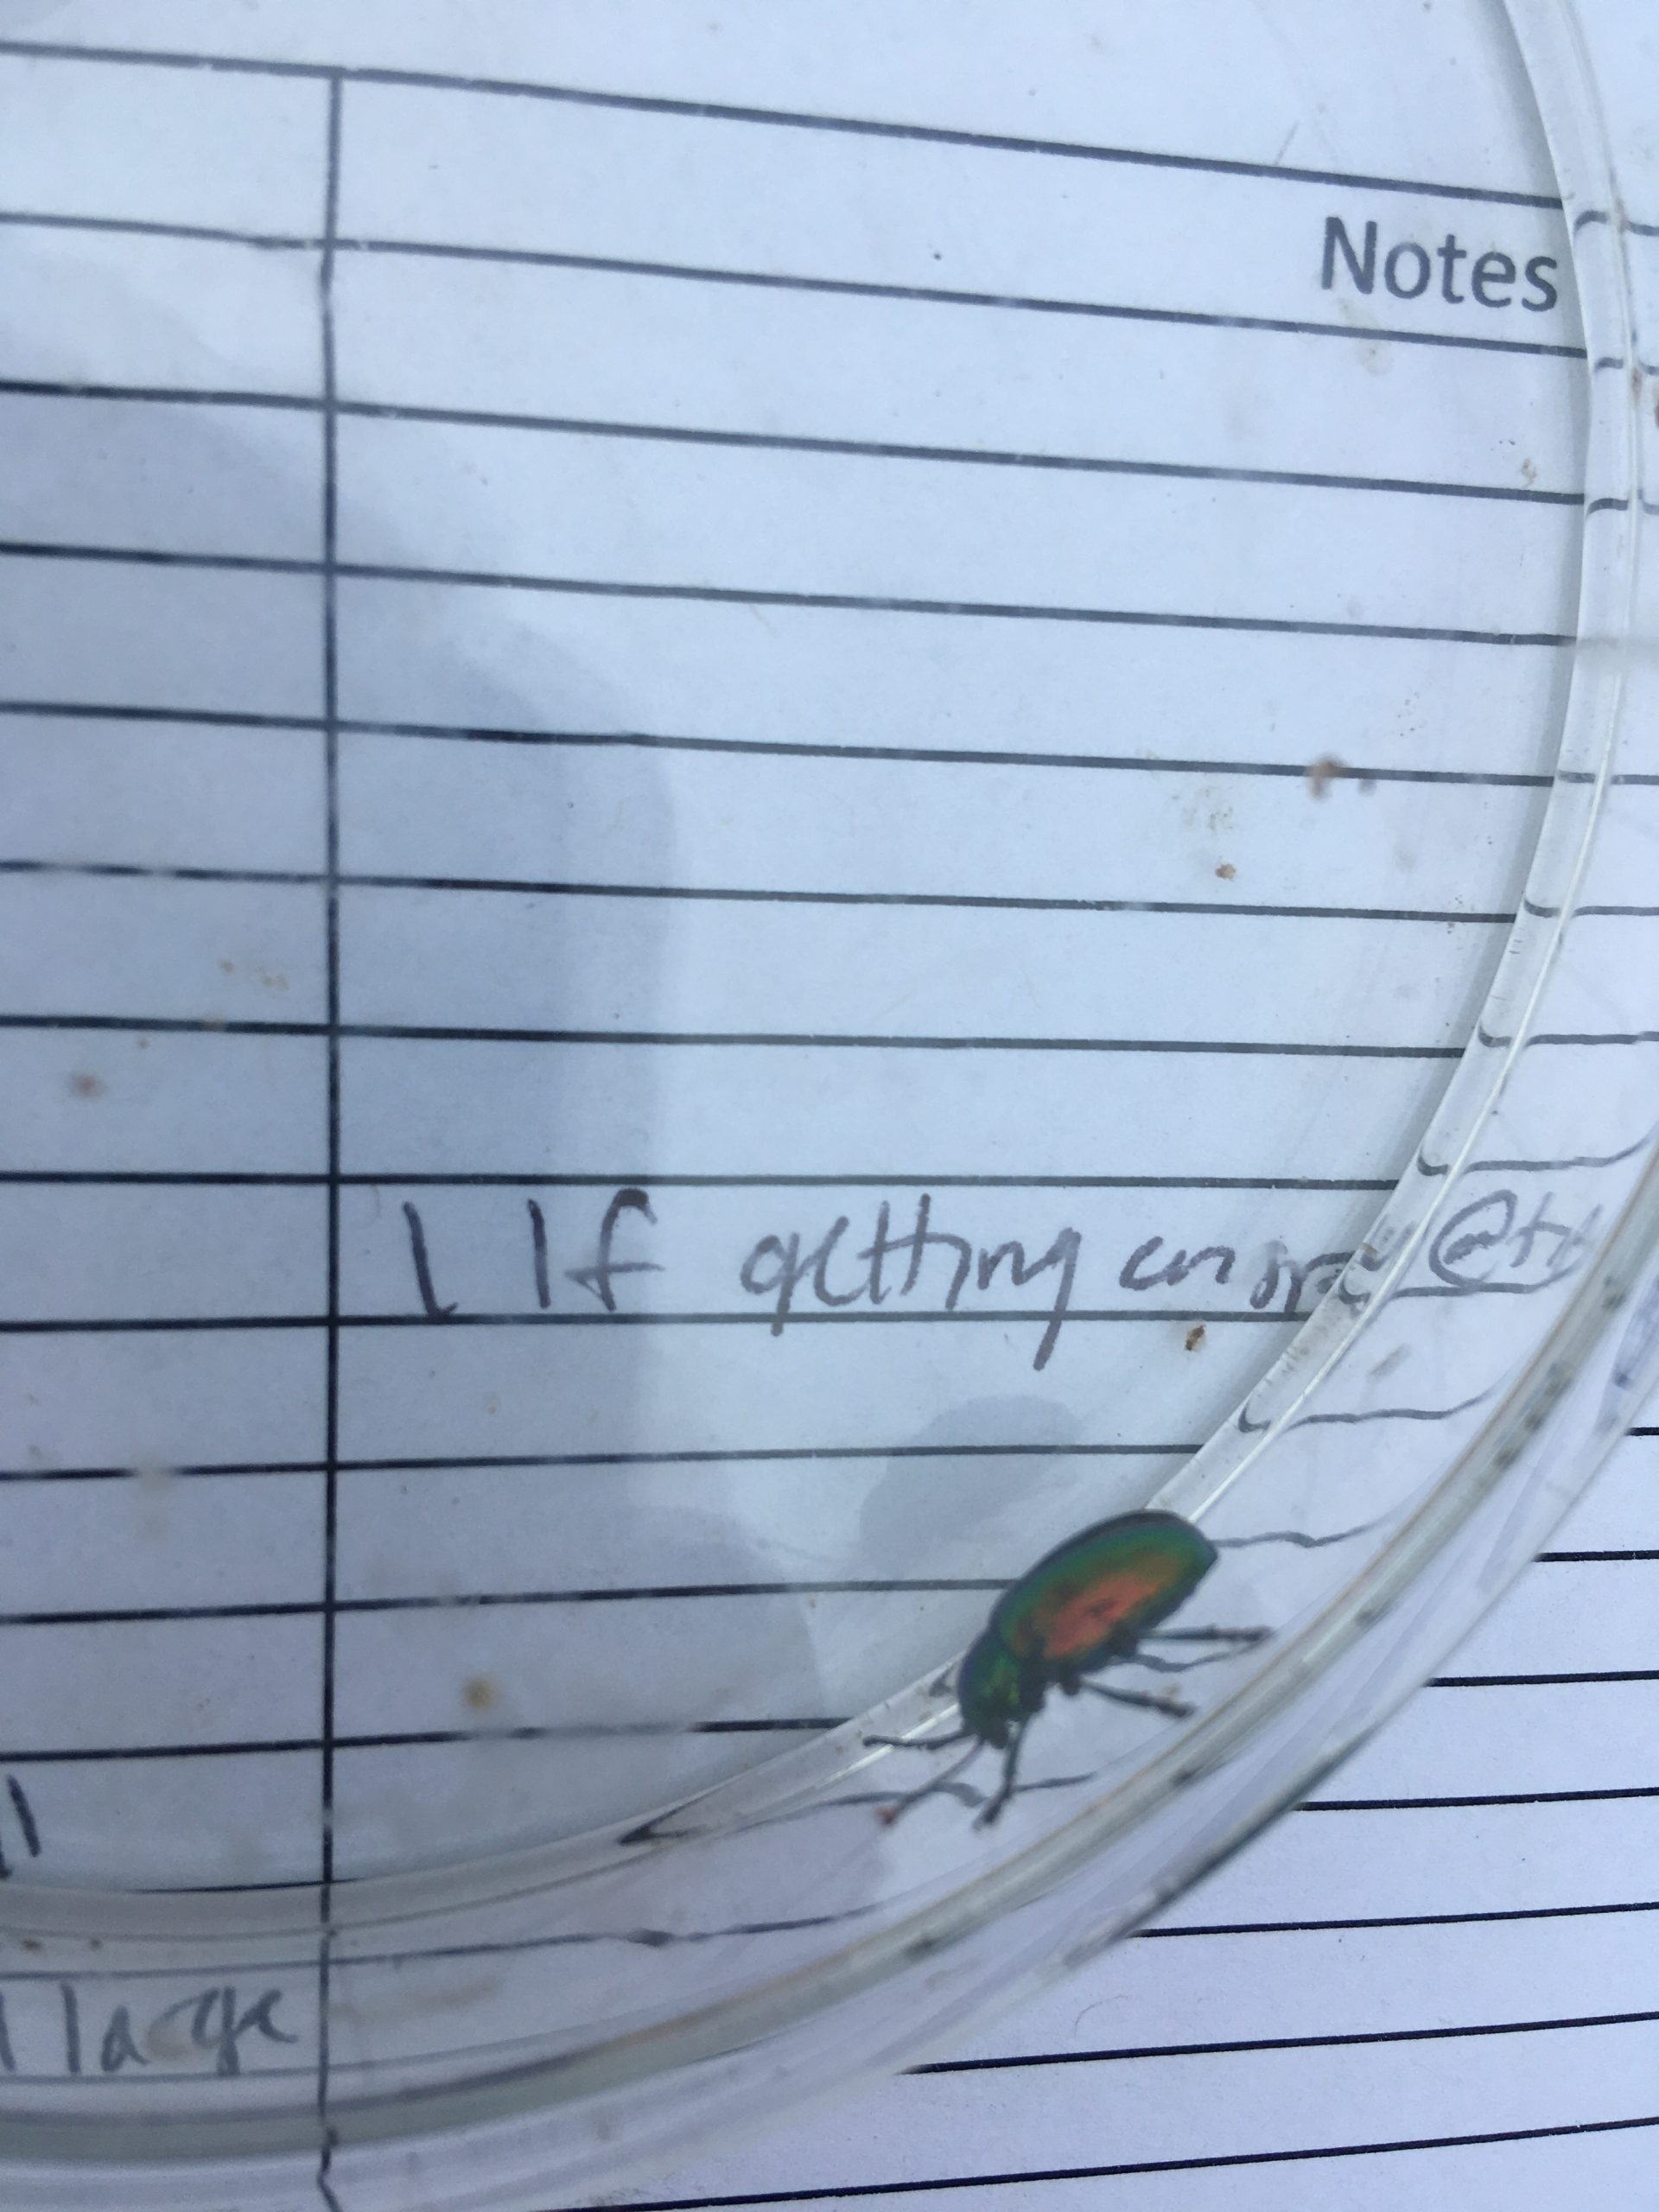
A cool-looking beetle found while conducting the aphid addition and exclusion experiment – not an aphid, but it is a green insect!
Data collected: Scanned datasheets are located at ~Dropbox\aphidAddEx\aphids2021
Samples collected: NA
Products:
Andy Hoyt’s poster presented at the Fall 2018 Research Symposium at Carleton College
2016 paper by Katherine Muller and Stuart on aphids and foliar herbivory damage on Echinacea
2015 paper by Ruth Shaw and Stuart on fitness and demographic consequences of aphid loads
You can read more about the aphid addition and exclusion experiment, as well as links to prior flog entries mentioning the experiment, on the background page for this experiment.
In 2019, Team Echinacea transplanted over 1400 Echinacea angustifolia plants from three local prairies to 12 plots at the West Central Area (WCA) High School, also known as exPt10. Since then, the West Central Area High School instructors and students have collaborated with members of Team Echinacea to gather data and plan the treatments of the plots, anything from burning to assessing plant fitness. In the fall, WCA students do an individual investigation using the Echinacea plots and then create a poster showing the process and conclusion of their investigation.
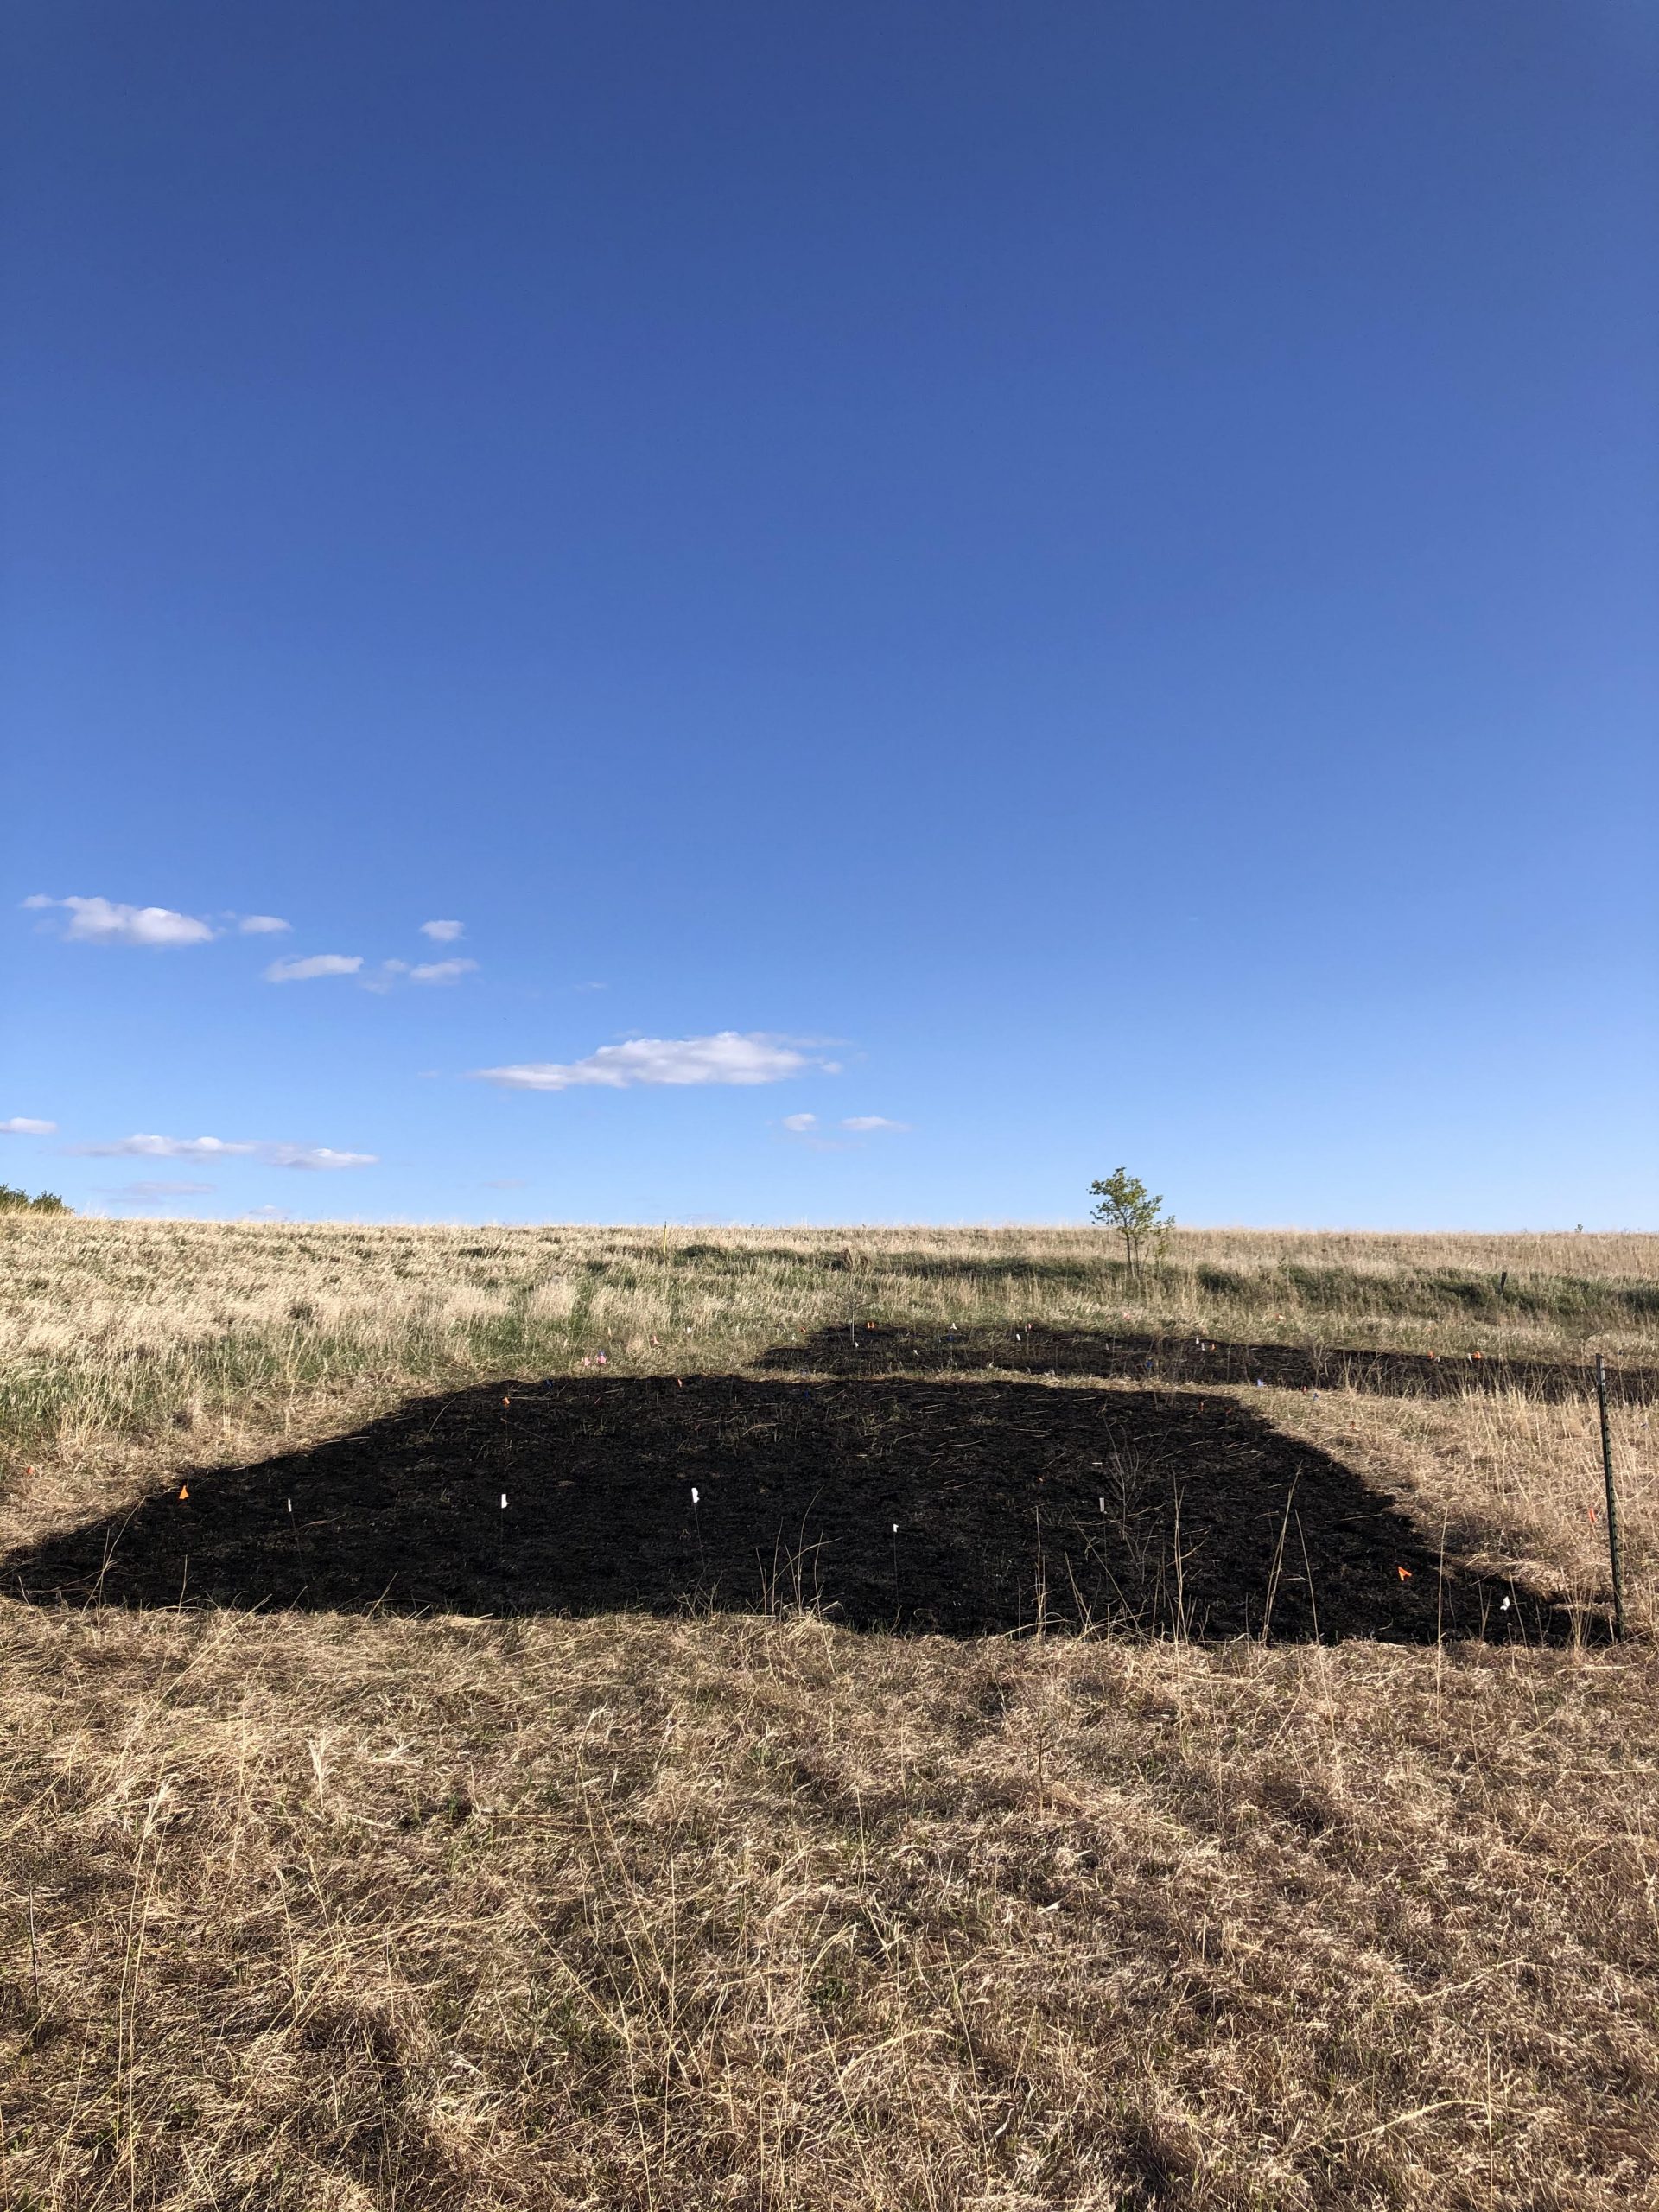
Here’s one of the 12 Echinacea plots at West Central Area High School used by Echinacea Project and WCA students to do research. Four of the plots are burned in the spring, four burned in the fall, and four are used as controls and haven’t been burned.
Having the Echinacea plots located at West Central Area School has provided many opportunities for the students to be involved in relevant research helping the Echinacea Project and doing individual projects. The plots at the school have also been used for additional research by Echinacea Project team members. Specifically, in the summer of 2021, graduate student Drake Mullett started a research project on prairie parasitic plants at exPt10 and will continue for the next few summers. Amy Waananen also continued an ongoing research project on Echinacea plants’ gene flow in exPt10. In May 2021, Team Echinacea conducted a prescribed burn at exPt10. Read more about the burn here.
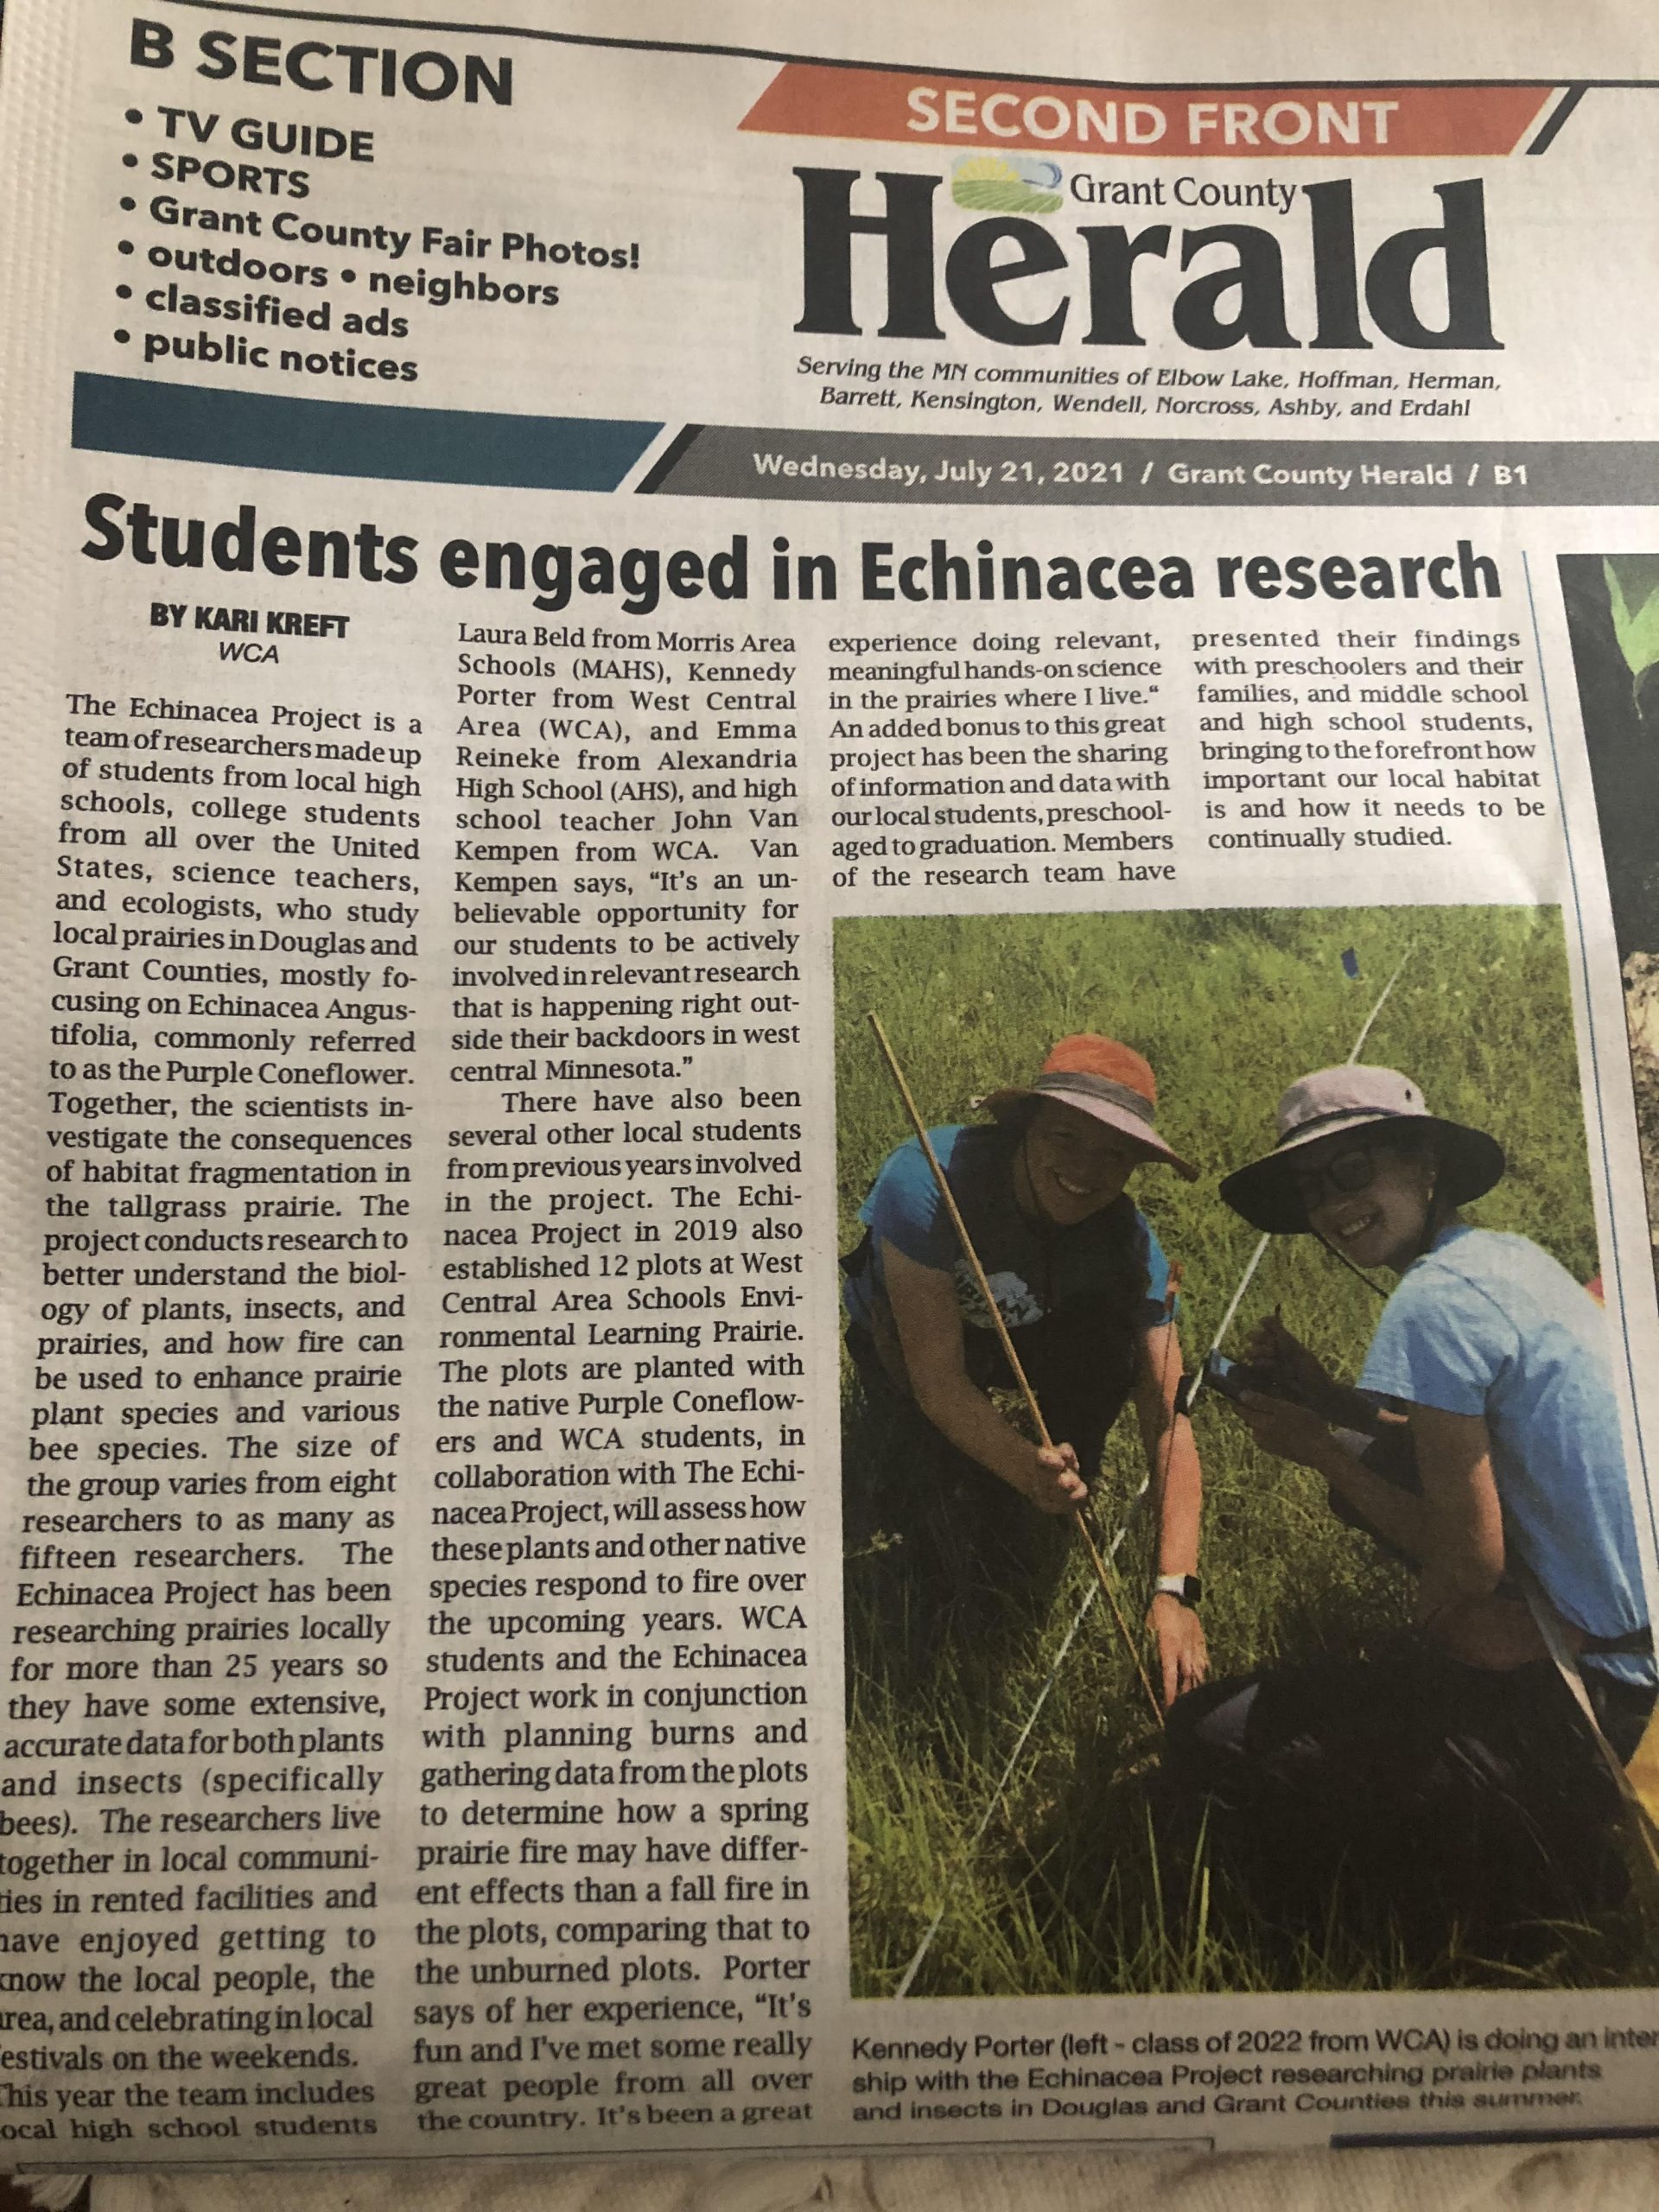
An article in the local newspaper about WCA student Kennedy and Echinacea Project member Maris working together measuring the plants on one of the 12 plots located on school property.
Start year: 2018
Location: West Central Area High School’s Environmental Learning Center, Barrett, MN
Data collected: Survival data for seedlings planted in summer 2019 from Amy W’s gene flow experiment, located in the cgdata bitbucket repository along with recheck data. Data from p10 will not be going into the SQL databases
Samples collected: None this year
Products: High school posters. Contact John Van Kempen for info.
Tallgrass prairie once covered vast expanses of western Minnesota, but it has been almost entirely converted to agriculture, and only fragmented patches remain, often along roadsides. Insecticide use has also dramatically increased since the early 2000s, especially the use of neonicotinoids. In addition, pollinator populations are declining worldwide, likely due to this loss in habitat quantity and quality. In our study area, student Ben Lee found that pollinator habitat decreased by 6.8 km2 from 2006 to 2014.
More research is needed to understand how pollinator communities are changing in the fragmented prairies of western Minnesota. Native bees are critical for pollinating both native plants and commercial crops, and many plants depend on specialized pollinators, and so the decline of these pollinators may threaten the long-term survival of native plant populations as well as human food systems.
Therefore, the Pollinators on Roadsides study, also known as the Yellow Pan Trap project (YPT), is measuring changes in native bee diversity and abundance from 2004-2019 and investigating how the amount of agricultural land and grassland corresponds to the nearby bee community. One hypothesis is that all bee species are declining in abundance equally. Alternatively, some bee populations may be shrinking while others take advantage of the decreased competition and become more prevalent, which would change the community composition. We hope to find out!
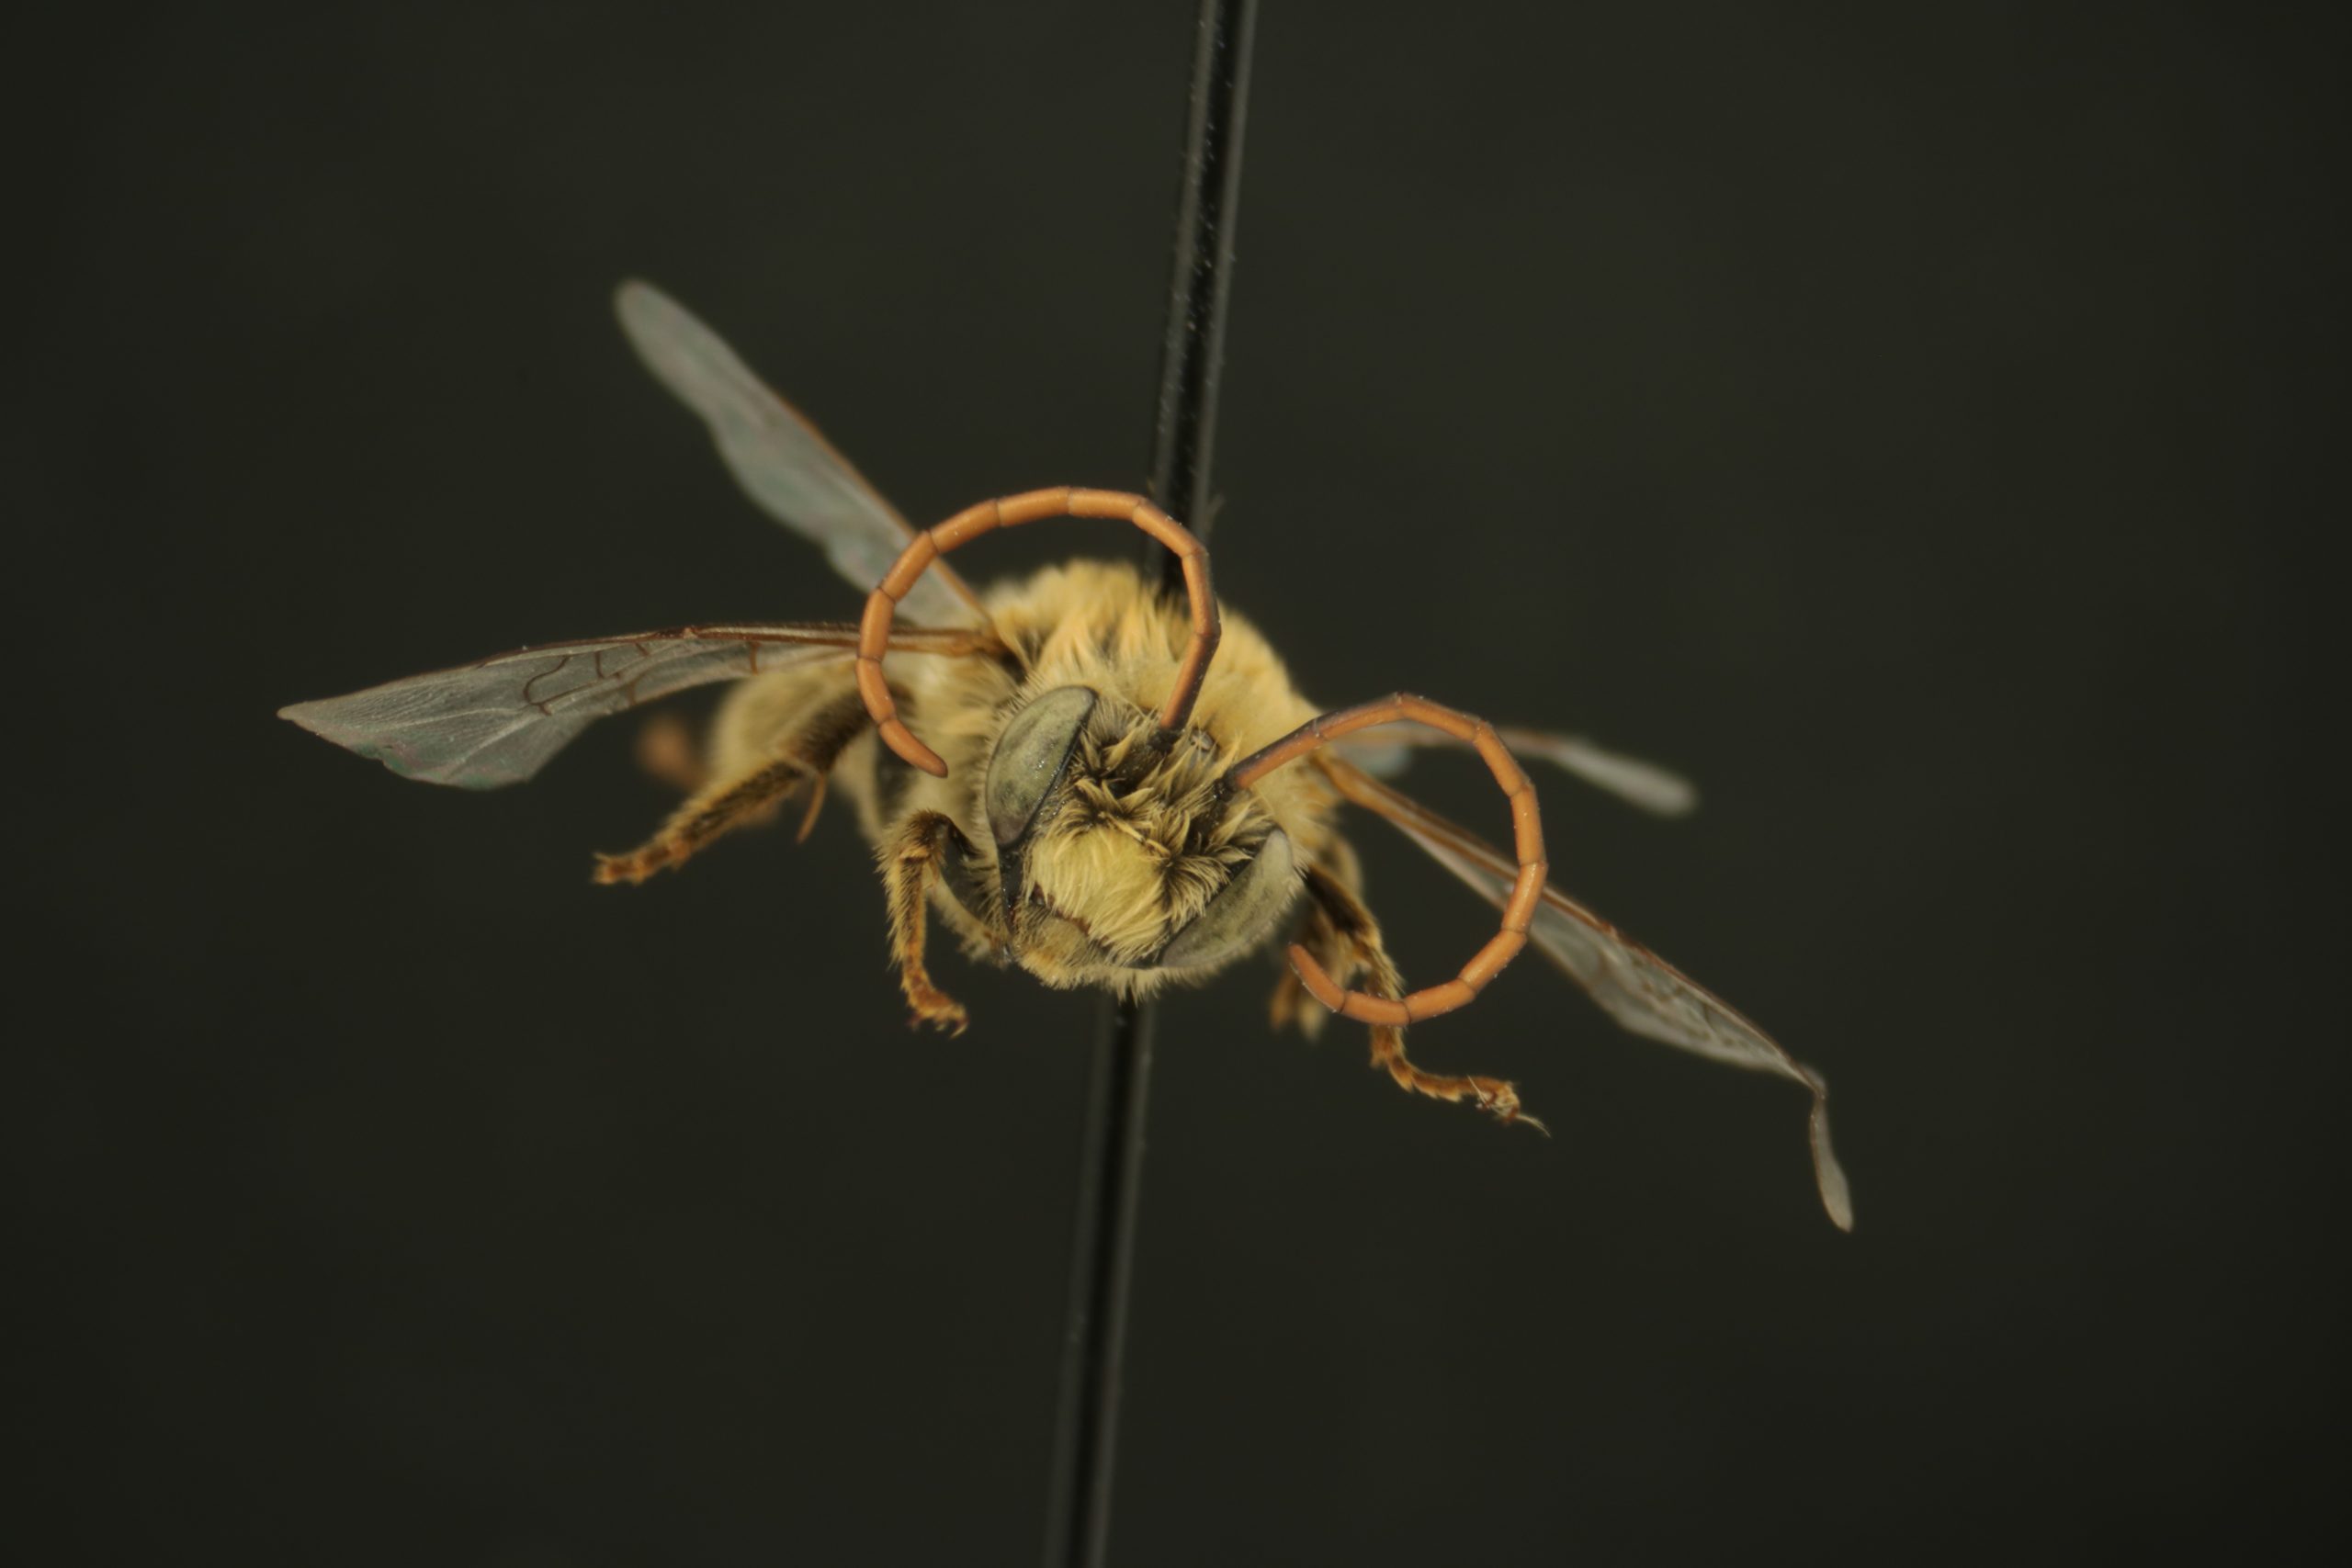
Specimen 1848 from 2018
This study is based on the original 2004 experiment by Wagenius and Lyon, who studied the relationship between characteristics of land and the abundance and diversity of pollinators. In 2004, 2017, 2018, and 2019, Team Echinacea set out yellow pan traps at 20-40 locations along roadsides in Solem Township which were surrounded by varying amounts of agricultural land. We collected the bees that fell into the traps and stored them at the Chicago Botanic Garden where patient volunteers pinned all the specimens. Many thanks to all the people who have contributed to this project over the past 18 years!
After a hiatus due to COVID-19, the Yellow Pan Trap project (YPT) is finally back on the road! In December 2021, we completed an inventory of all 1,988 YPT bees and delivered them in 8 cases to Zach Portman at the University of Minnesota. Volunteers Mike Humphrey and Anna Stehlik previously grouped the specimens by genus, and Zach will now identify the bees to species. Mia Stevens is working on a preliminary community analysis, and Alex Carroll is tackling the GIS landscape analysis.
Working with data that has been compiled by many different people over numerous years has been both exciting and challenging. Many thanks to intern Erin Eichenberger for leaving clear documentation from 2020. There are still a few problems that need to be resolved. During inventory, we discovered 9 pairs of duplicate specimen id numbers (SPIDs) from 2017, and the specimen labels will need to be changed. In addition, some of the date and trap numbers on the specimen labels were edited in pencil, and these should be cross-checked with the existing dataset.
After being stored in Chicago for up to 17 years, the bees finally return to Minnesota!
Start year: 2004, rebooted in 2017
Location: Roadsides and ditches around Solem Township, Minnesota. GPS coordinates for each trap are in a Google Map which Stuart Wagenius can share as needed.
Data collected: All YPT data can be found in Dropbox/ypt2004in2017.
The most up-to-date files are in this folder: Dropbox\ypt2004in2017\yptDataAnalysis2022
The inventory list can be found here: Dropbox\ypt2004in2017\yptDataAnalysis2022\masterYptChecklist2021Verified.csv
Specimens collected: Eight cases containing 1,988 specimens were delivered to Zach Portman at the University of Minnesota for further identification.
Team members involved with this project: Mia Stevens (2020-2022), Alex Carroll (2021-2022), Erin Eichenberger (2019-2020), Anna Stehlik (2020), Shea Issendorf (2019), Mike Humphrey (2018-2021), John Van Kampen (2018-2019), Kristen Manion (2017-2018), Evan Jackson (2018), Alex Hajek (2017), and Steph Pimm Lyon (2004)
Products: Stay tuned!
You can read more information about the pollinators on roadsides project here.
We are still monitoring the fate of the lone patch of Hill’s thistle at Hegg Lake WMA. It is the only patch in our study area, as far as we know. On 8 September 2021, Jared & Stuart used a stake file to find corners of the plot that was shot in 2014. We flagged the corners and did not see any flowering rosettes within. We shot coordinates for five basal rosettes. Two rosettes were outside of the plot near the SW corner. We scanned nearby and saw no more rosettes outside the plot. One Asclepias viridiflora plant was flagged within the plot. I regret I took no photos.
You can find more information about our experiment on how fire affects the fitness of Cirsium hillii on previous flog posts regarding this experiment and on the background page for this experiment.
Small remnant Echinacea populations may suffer from inbreeding depression. To assess whether gene flow (in the form of pollen) from another population could “rescue” these populations from inbreeding depression, we hand-pollinated Echinacea from six different prairie remnants with pollen from a large prairie remnant (Staffanson Prairie) and from a relatively small population (Northwest Landfill) in 2008. We also performed within-population crosses as a control. Amy Dykstra planted the achenes (seeds) that resulted from these crosses in an experimental plot at Hegg Lake WMA.
We sowed a total of 15,491 achenes in 2008. 449 of these achenes germinated and emerged as seedlings. Each summer, we census the surviving plants and measure them.
In 2021, Amy Dykstra and Team Echinacea found 33 basal plants and 2 flowering plants (1 with vertical development only and 1 with one head). These were the first plants to flower in this experiment! The plant with one head grew from an achene produced by a between-population cross between a Steven’s Approach maternal plant and a Northwest Landfill pollen donor. The plant with vertical development grew from an achene produced by a within-population cross between a maternal plant from Aanenson and an Aanenson pollen donor.
For more details and graphs, see this brief report:
Data collected: Plant fitness measurements (plant status, number of rosettes, number of leaves, and length of longest leaf), and notes about herbivory. Contact Amy Dykstra to access this data.
Samples collected: NA
Products: Dykstra, A. B. 2013. Seedling recruitment in fragmented populations of Echinacea angustifolia. Ph.D. Dissertation. University of Minnesota. PDF
You can read more about Dykstra’s interpopulation crosses, as well as links to prior flog entries mentioning the experiment, on the background page for this experiment.
This experiment was designed to quantify how well Echinaceaangustifolia populations are adapted to their local environments. In 2008, Amy Dykstra collected achenes from Echinacea populations in western South Dakota, central South Dakota, and Minnesota and then sowed seeds from all three sources into experimental plots near each collection site. Each year, Team Echinacea takes a demographic census at the western South Dakota and Minnesota plots; we abandoned the central South Dakota plot after it was inadvertently sprayed in 2009, killing all the Echinacea.
In 2021, during the annual census of the experimental plots, we found 134 living Echinacea plants, including 121 basal plants and 13 flowering plants. Only one of the flowering plants was in the Minnesota plot; the other 12 were in the South Dakota plot. For more details and graphs, please read this brief report:
Location: Grand River National Grassland (Western South Dakota), Samuel H. Ordway Prairie (Central South Dakota), Staffanson Prairie Preserve (West Central Minnesota), and Hegg Lake WMA (West Central Minnesota).
Data collected: Plant fitness measurements (plant status, number of rosettes, number of leaves, and length of longest leaf)
Samples collected: Heads from all flowering plants
Products: Dykstra, A. B. 2013. Seedling recruitment in fragmented populations of Echinacea angustifolia. Ph.D. Dissertation. University of Minnesota. PDF
You can read more about Dykstra’s local adaptation experiment and see a map of the seed source sites on the background page for this experiment.
In summer 2021, Amy Waananen continued the interremnant crosses experiment to understand how the distance between plants in space and in their timing of flowering influences the fitness of their offspring. This experiment builds on Amy’s study of gene flow and pollen movement in the remnants, asking the question of how pollen movement patterns affect offspring establishment and fitness. If plants that are located close together or flower at the same time are closely related, their offspring might be more closely related and inbred, and have lower fitness than plants that are far apart and/or flower more asynchronously. In other words, if distance in space or time is correlated with relatedness, we’d expect mating between more distant or asynchronous individuals to result in more fit offspring.
To test this hypothesis, Amy performed crosses between plants across a range of spatial isolation (within the same population, in adjacent populations, and in far-apart populations) in 2020. With the team’s help, she also kept track of the individuals’ flowering time to assess whether reproductive synchrony is associated with reduced offspring fitness, suggesting that individuals that flower at the same time are more closely related.
In 2021, Amy repeated the same hand crossing methods to assess the fitness consequences of outcrossing, this year on 44 focal plants.
To learn more about Amy’s project, check out this video created by RET participant Alex Wicker.
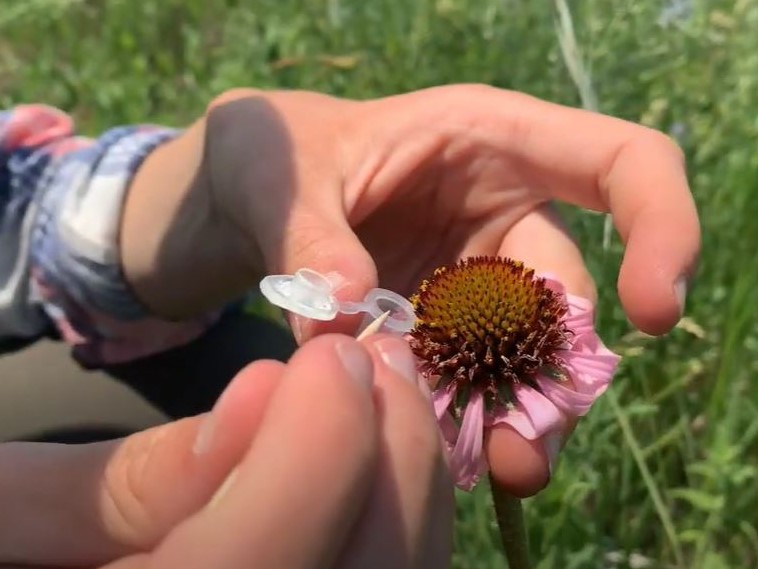
Amy collects pollen from Echinacea anthers
Start year: 2020
Location: On27, SGC, GC, NGC, EELR, KJ, NNWLF, NWLF, LF
Data/Materials collected: Style shriveling and seed set and weight from crosses, start and end date of flowering, coordinates of all individuals in the populations listed above
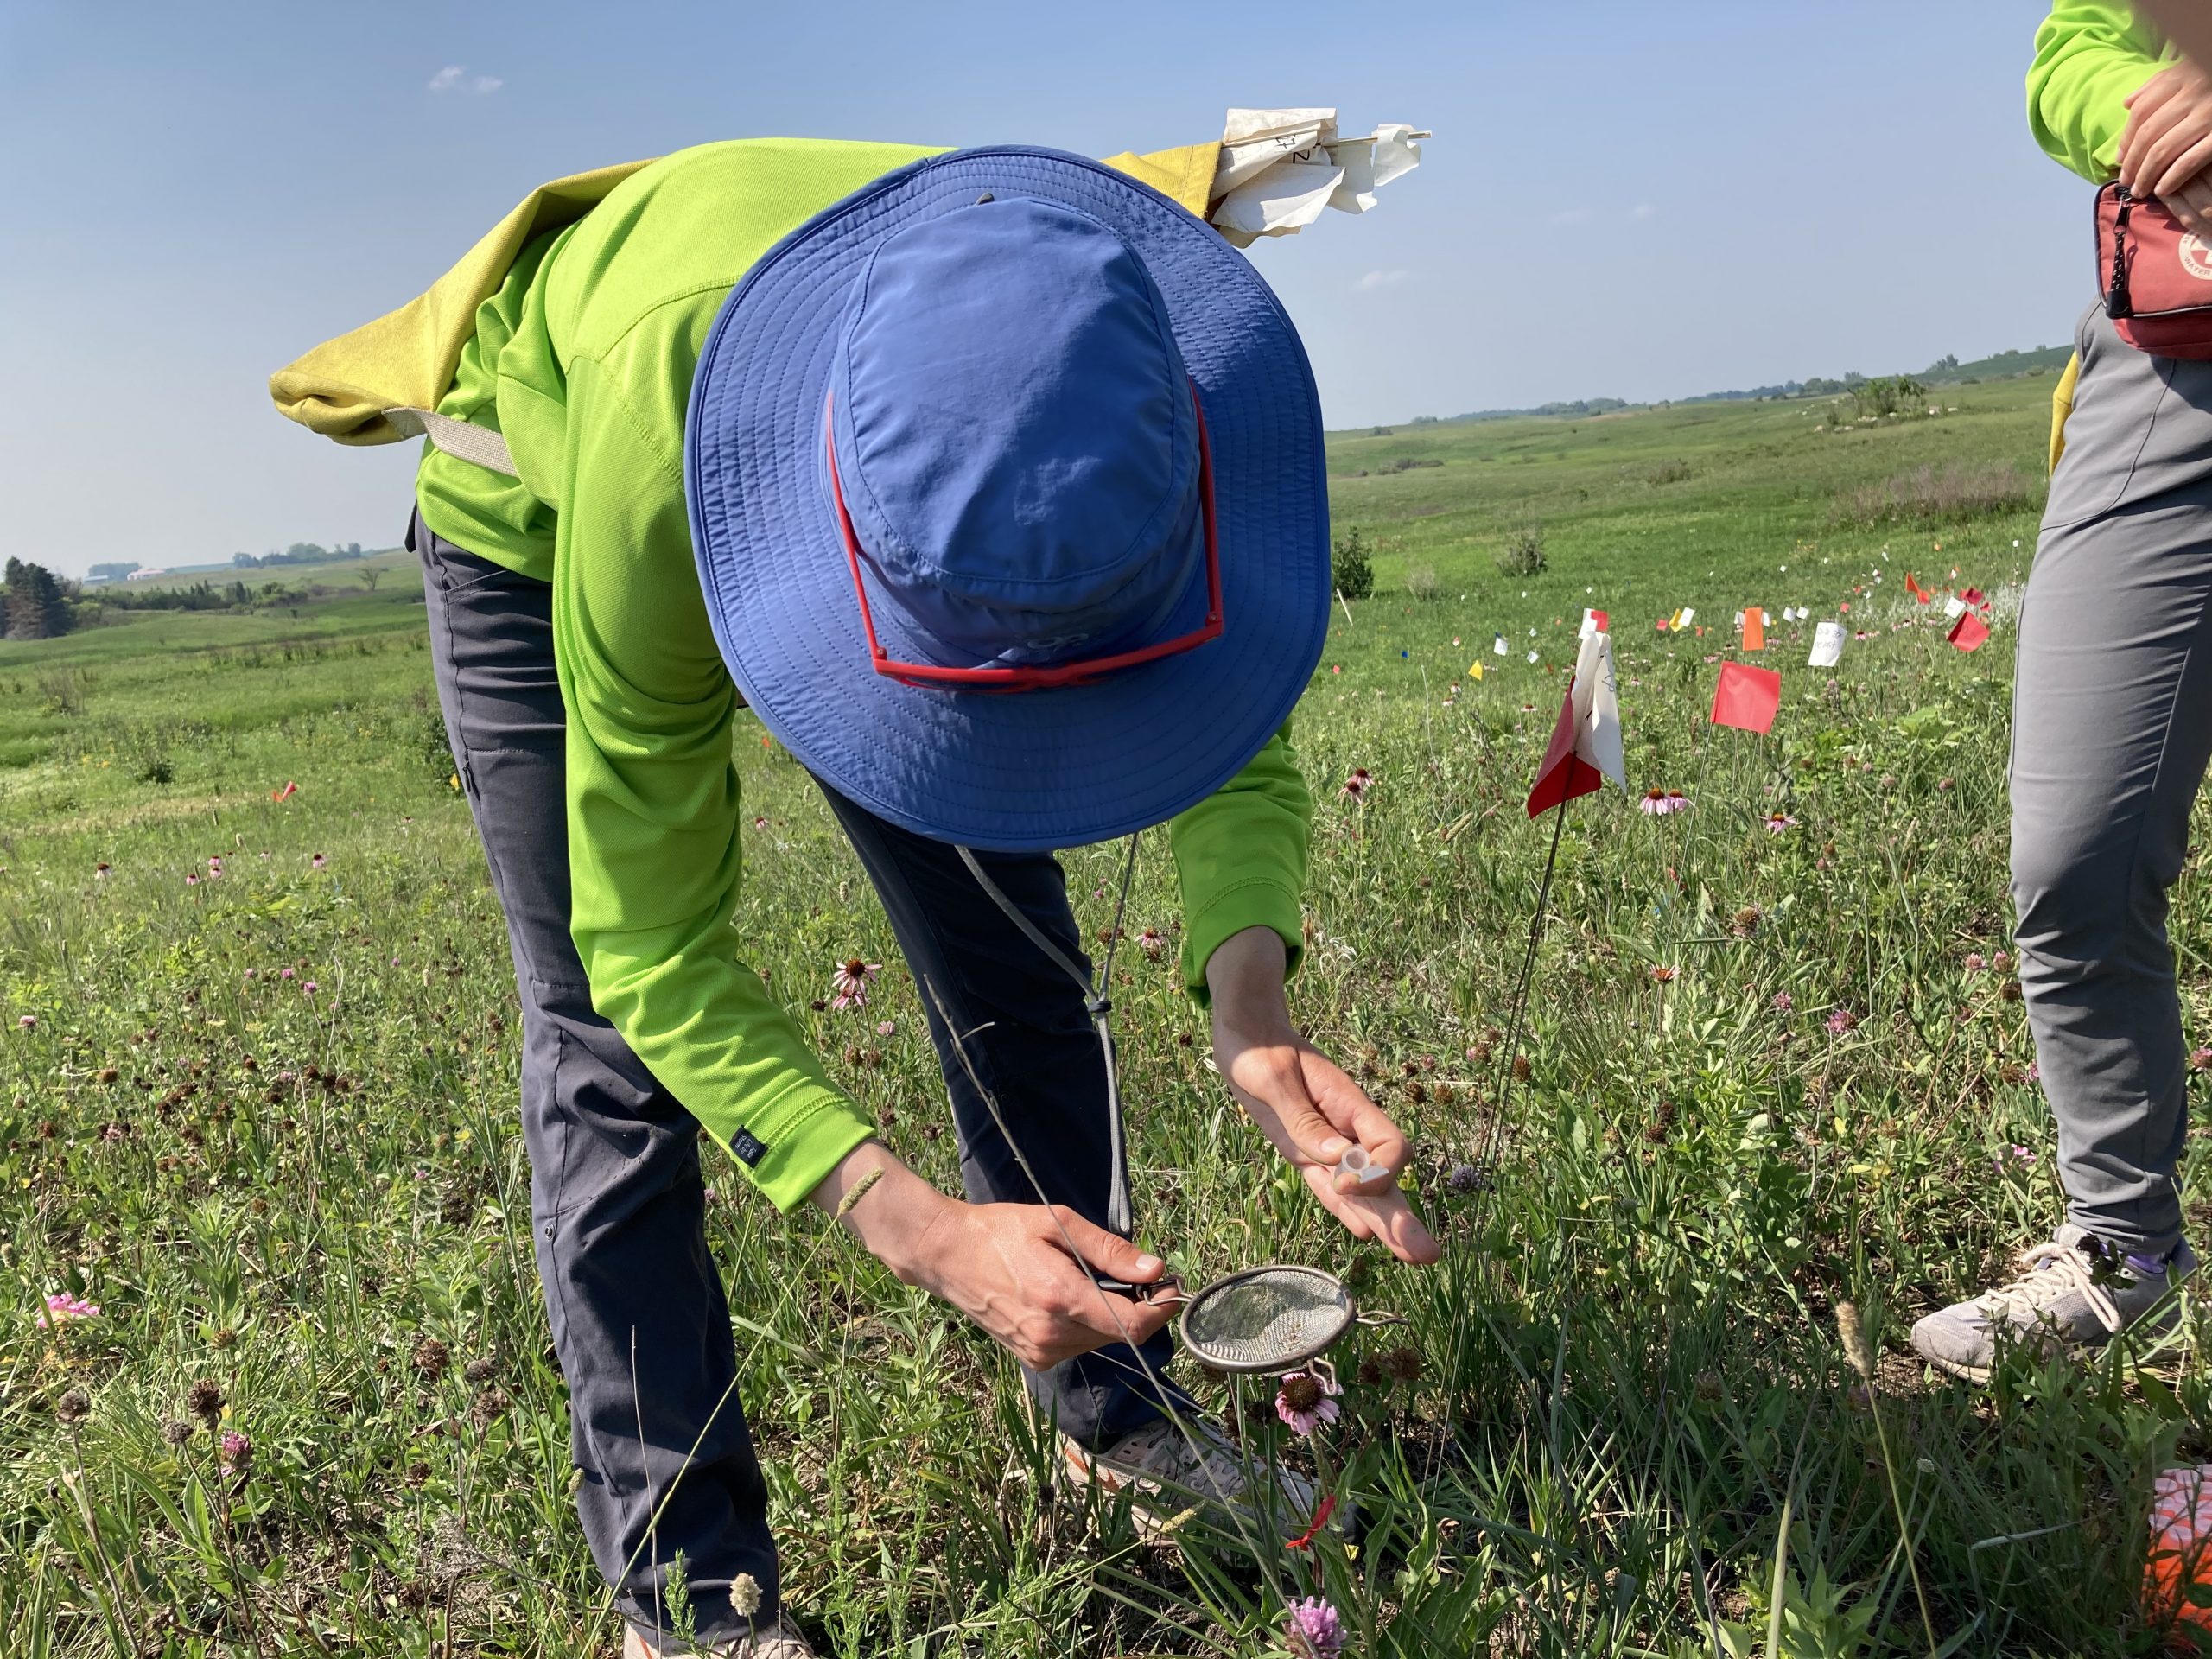
In summer 2021, we began a project to look at the effect of dust on reproduction of Echinacea. We randomly assigned treatments of ‘dust’ or ‘no dust’ to 41 heads in ExPt2 that were on first or second-day of flowering at the onset of our treatments. For ‘dust’ plants, we applied ~1g dust with a sifter to the top of each head at least once every three days until the heads were no longer flowering. Team Dust consisted of Emma, Alex, Kennedy, Mia, and I. We harvested the treatment heads at the end of the season. Unfortunately, we were only able to harvest 18 seedheads due to rodent herbivory. We will evaluate their seed set in Winter 2022.
Amy sifts dust on to an Echinacea head
Start year: 2021
Location: ExPt2
Overlaps with: None
Data collected: We collected style persistence data from treatment seedheads. Data has been double-entered and verified and is located in Dropbox/teamEchinacea2021/teamDust/p2DustTreatments_de.csv
Samples or specimens collected: We collected 18 seedheads, which are currently in the R. Shaw Lab in the Ecology building at UMN.
Products: None yet!
You can read more about the dust experiment in flog entries from summer 2021.
Reproduction in plants can be limited by access to pollen and resources. We previously found that Echinacea plants in the remnants are pollen limited, meaning that if they had access to more pollen, they would produce more seeds. However, the long-term effects of pollen limitation are unknown. Do plants that are super pollen saturated and have high amounts of pollen have a higher lifetime fitness than plants that are pollen limited? Also, we know that the plants in the remnants are pollen limited, but are the plants in the common garden environment also pollen limited? To answer these questions and more, 13 years ago Gretel randomly selected __ plants from p1; half of these plants were randomly assigned to the pollen addition group, and the others were assigned to pollen exclusion. Every year, plants in the pollen exclusion have their heads bagged and they are not pollinated, while we hand cross every style in the pollen addition group.
In the summer of 2021, 23 of the original 39 plants were found to be basal. There were no flowering plants this year, so no crosses occurred.
Start year: 2012
Location: exPt1
Physical specimens: No heads were harvested in 2021.
Data collected: Plant survival and measurements were recorded as part of our annual surveys in P1 and eventually will be found in the R package EchinaceaLab. Data sheets were scanned and entered and can be found here: “~/Dropbox/CGData/115_pollenLimitation/pollenLimitation2021”
You can find more information about the pollen addition and exclusion experiment and links to previous flog posts regarding this experiment at the background page for the experiment.