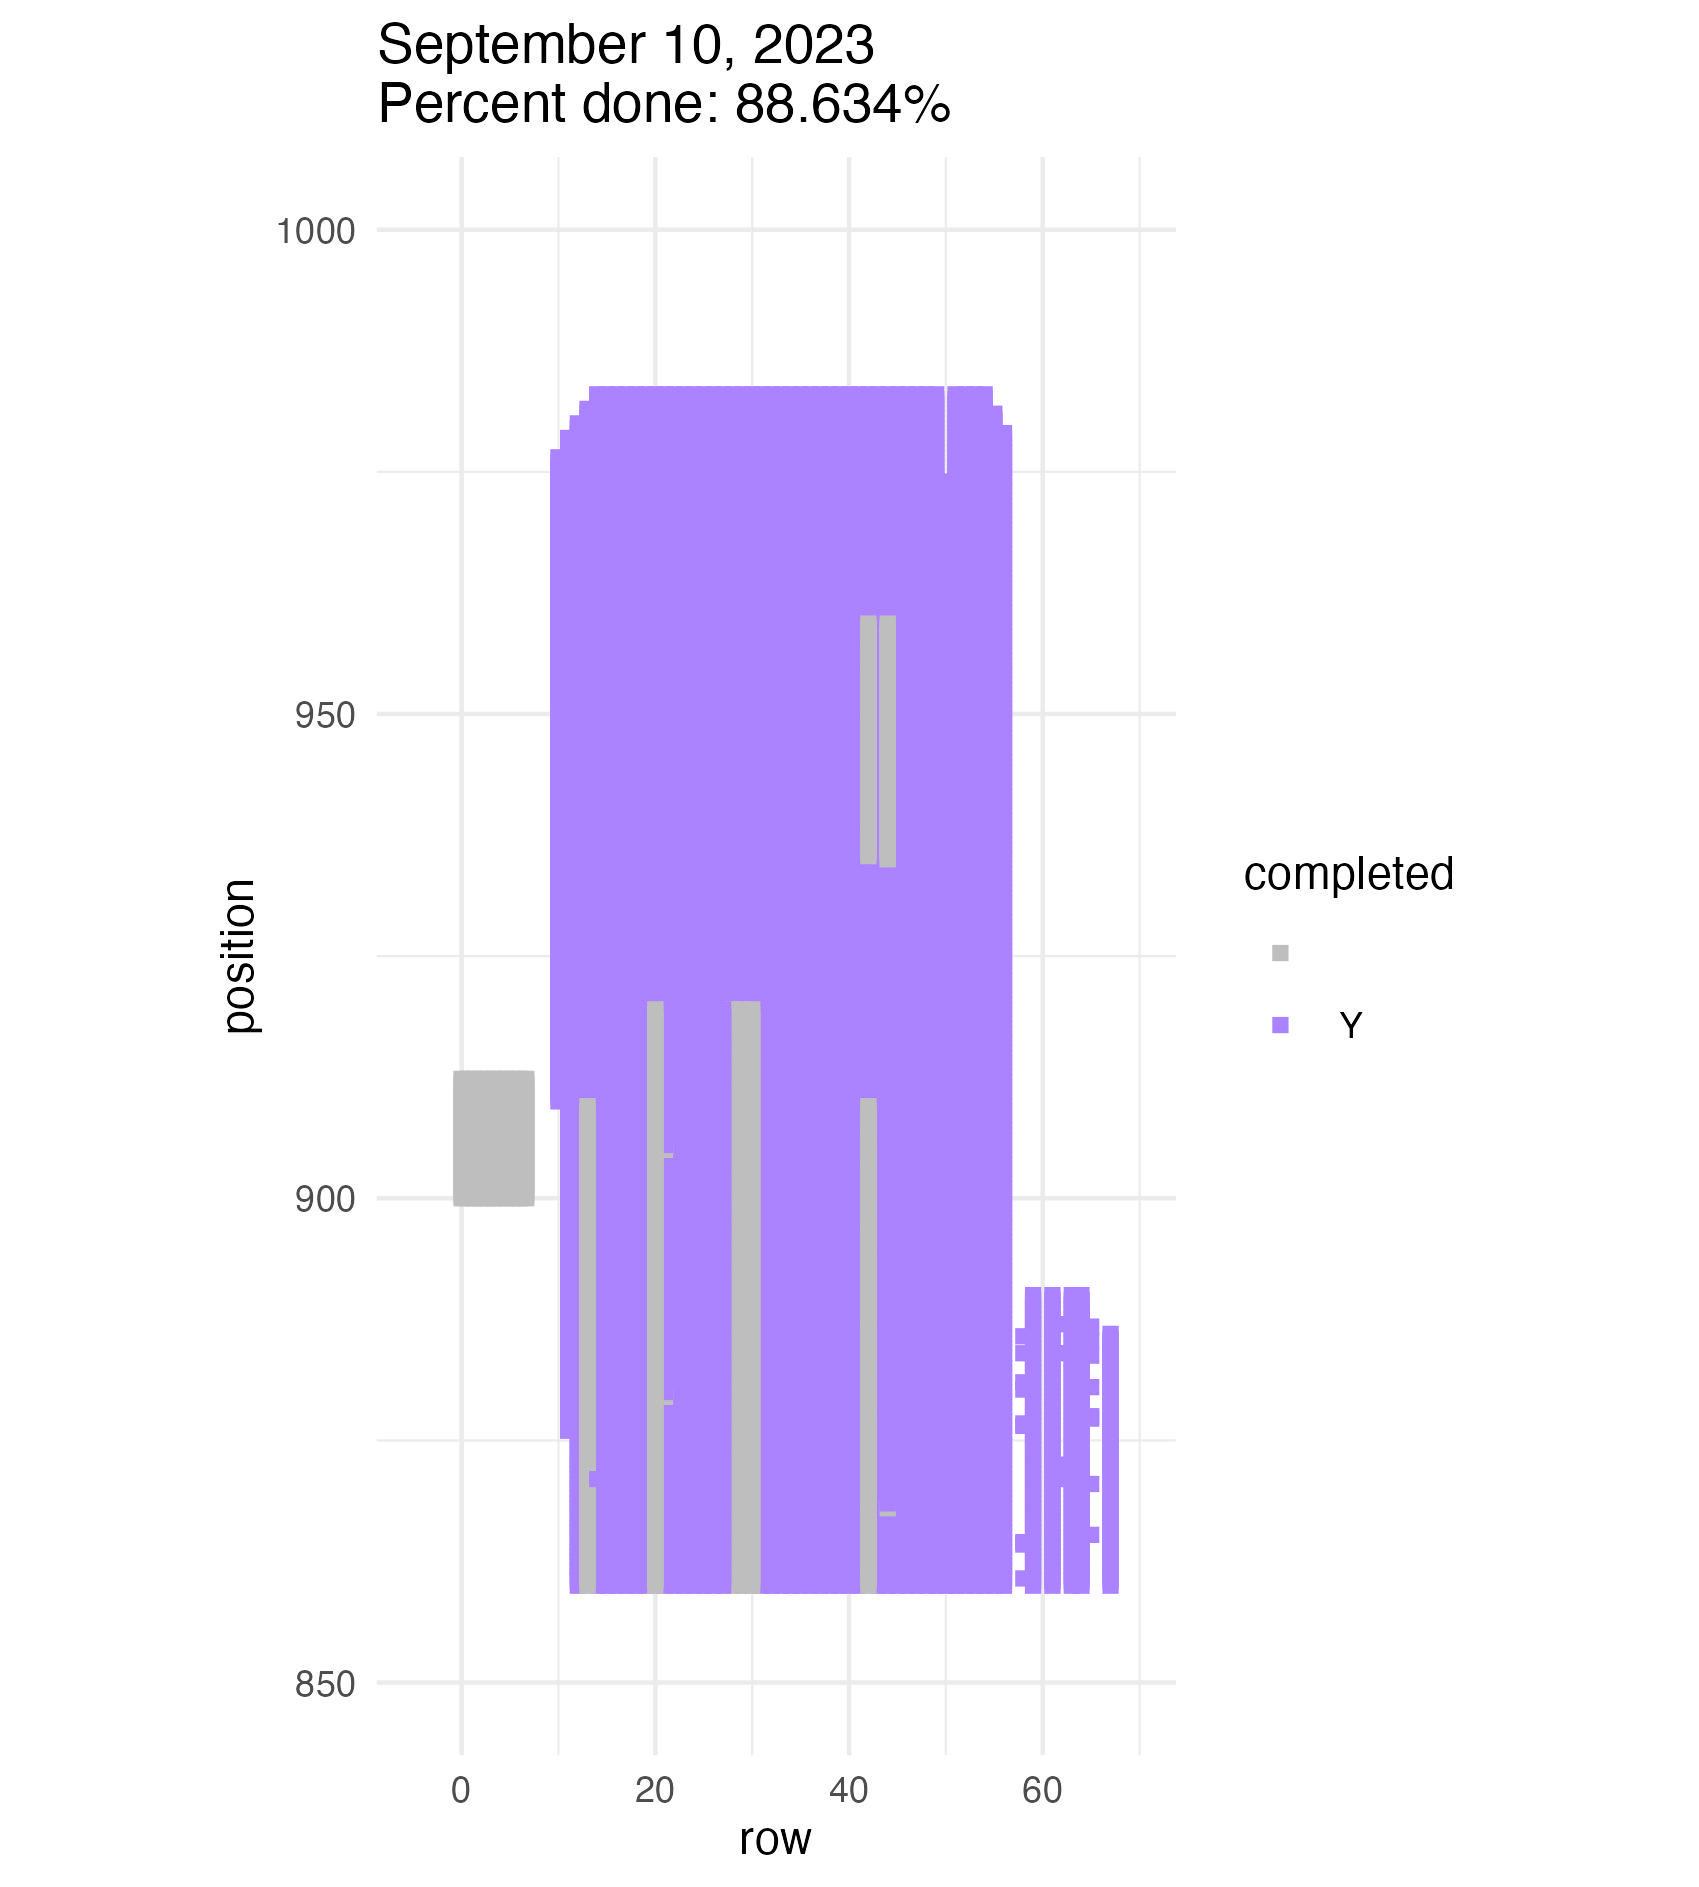
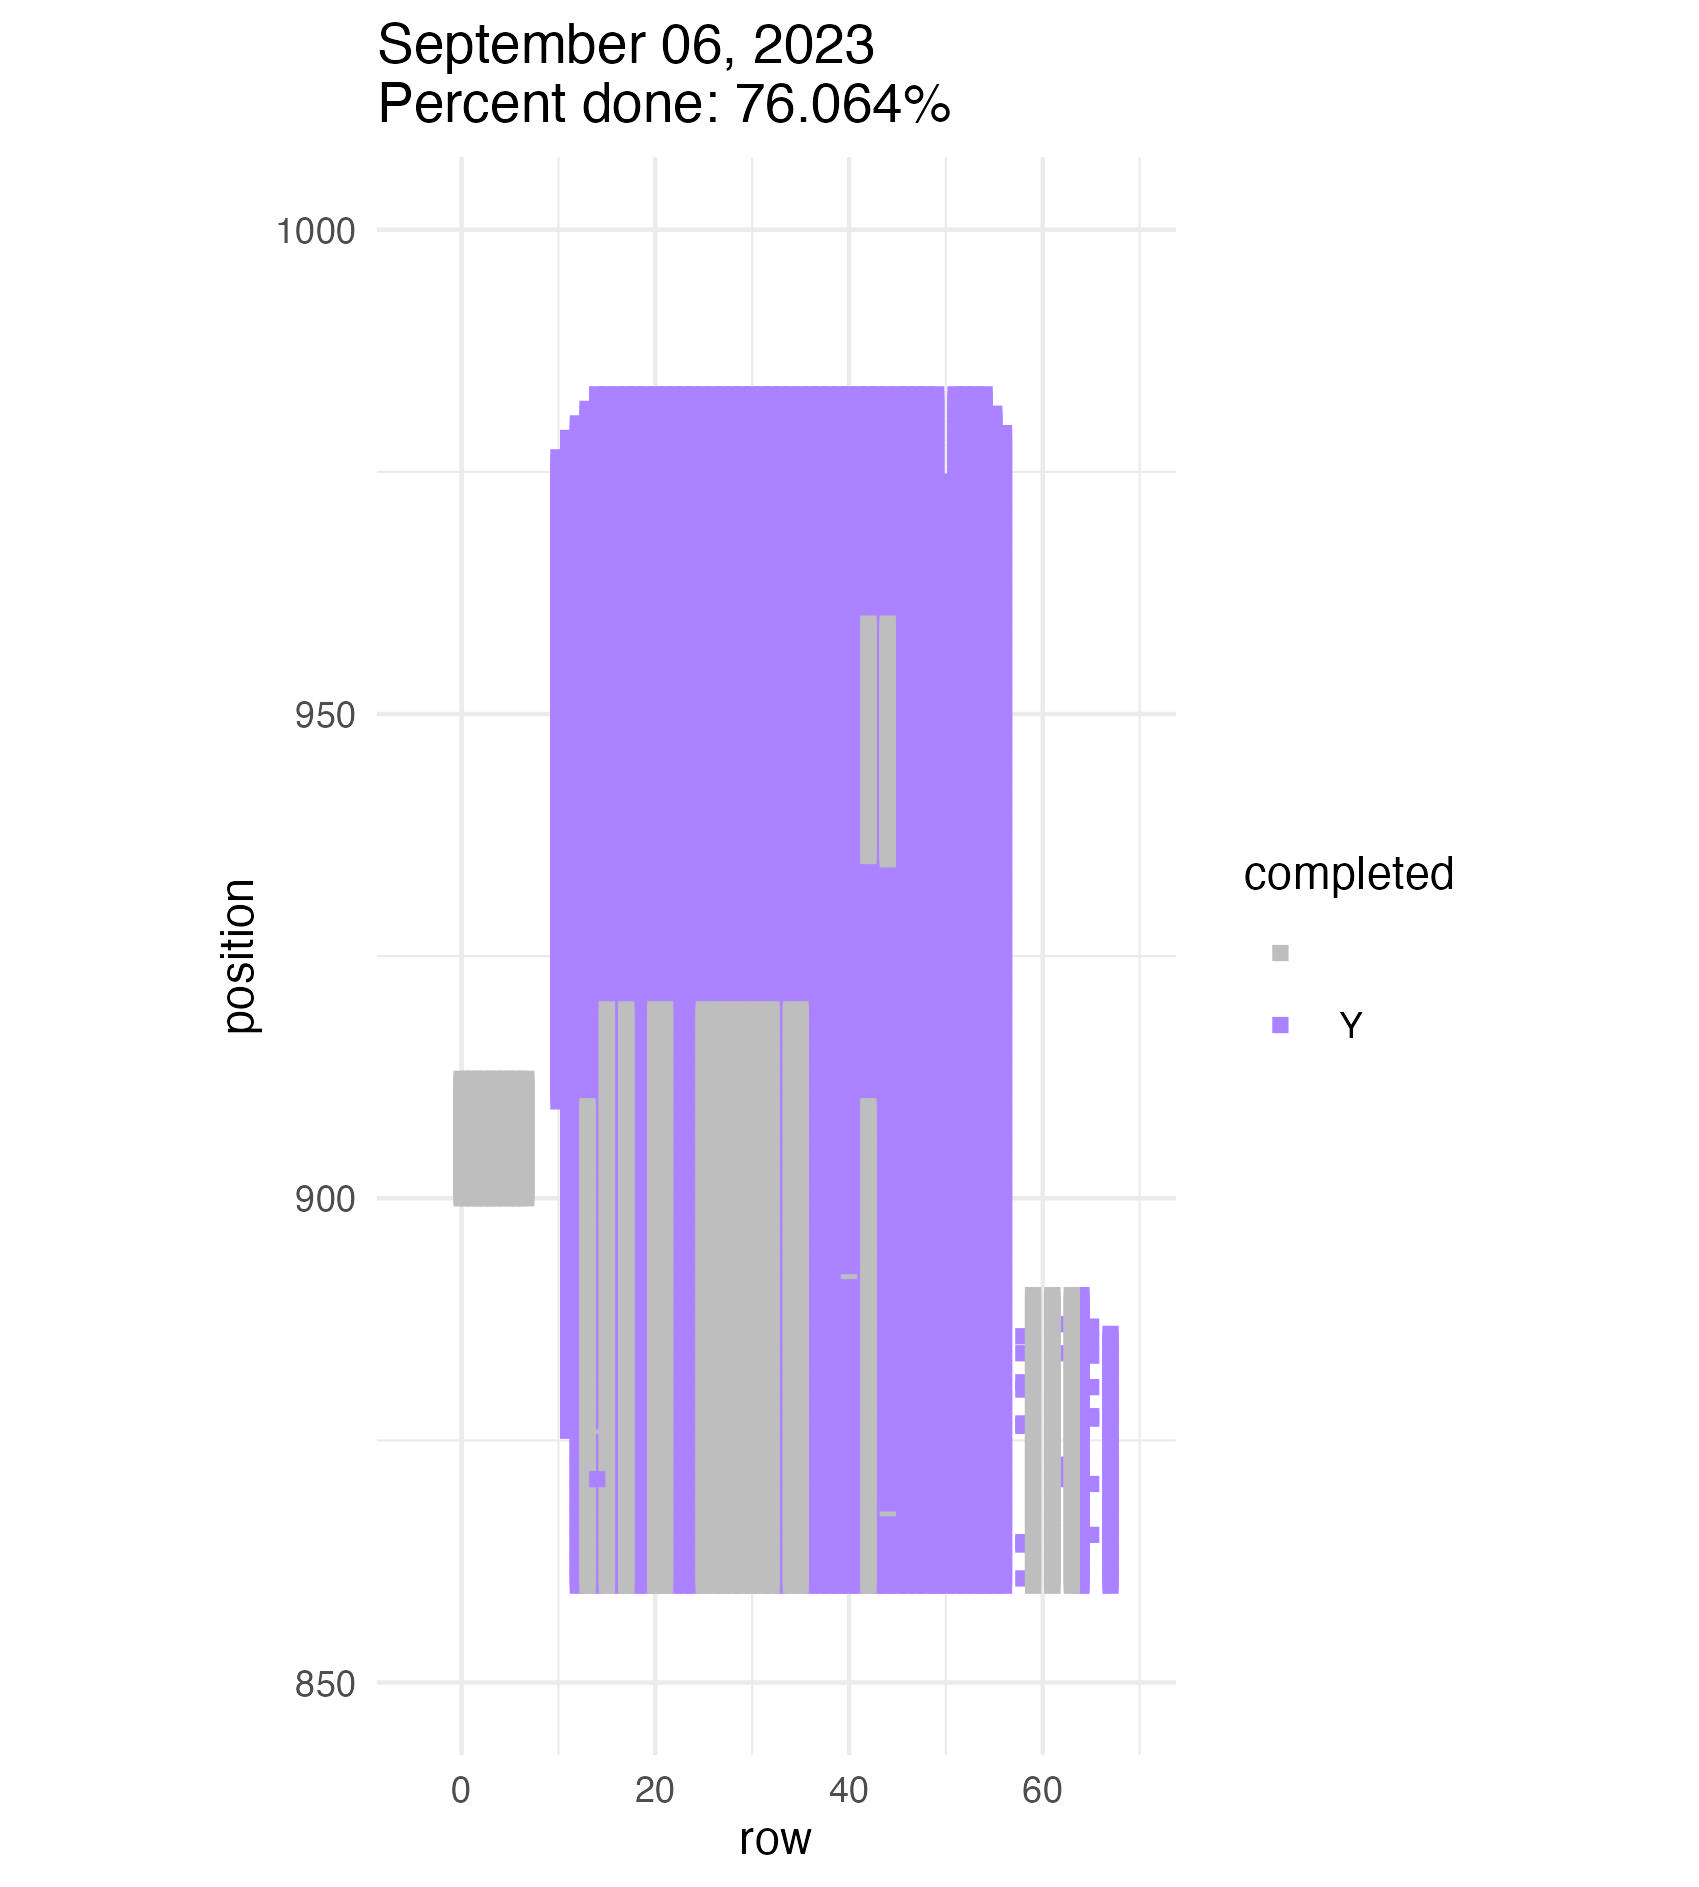
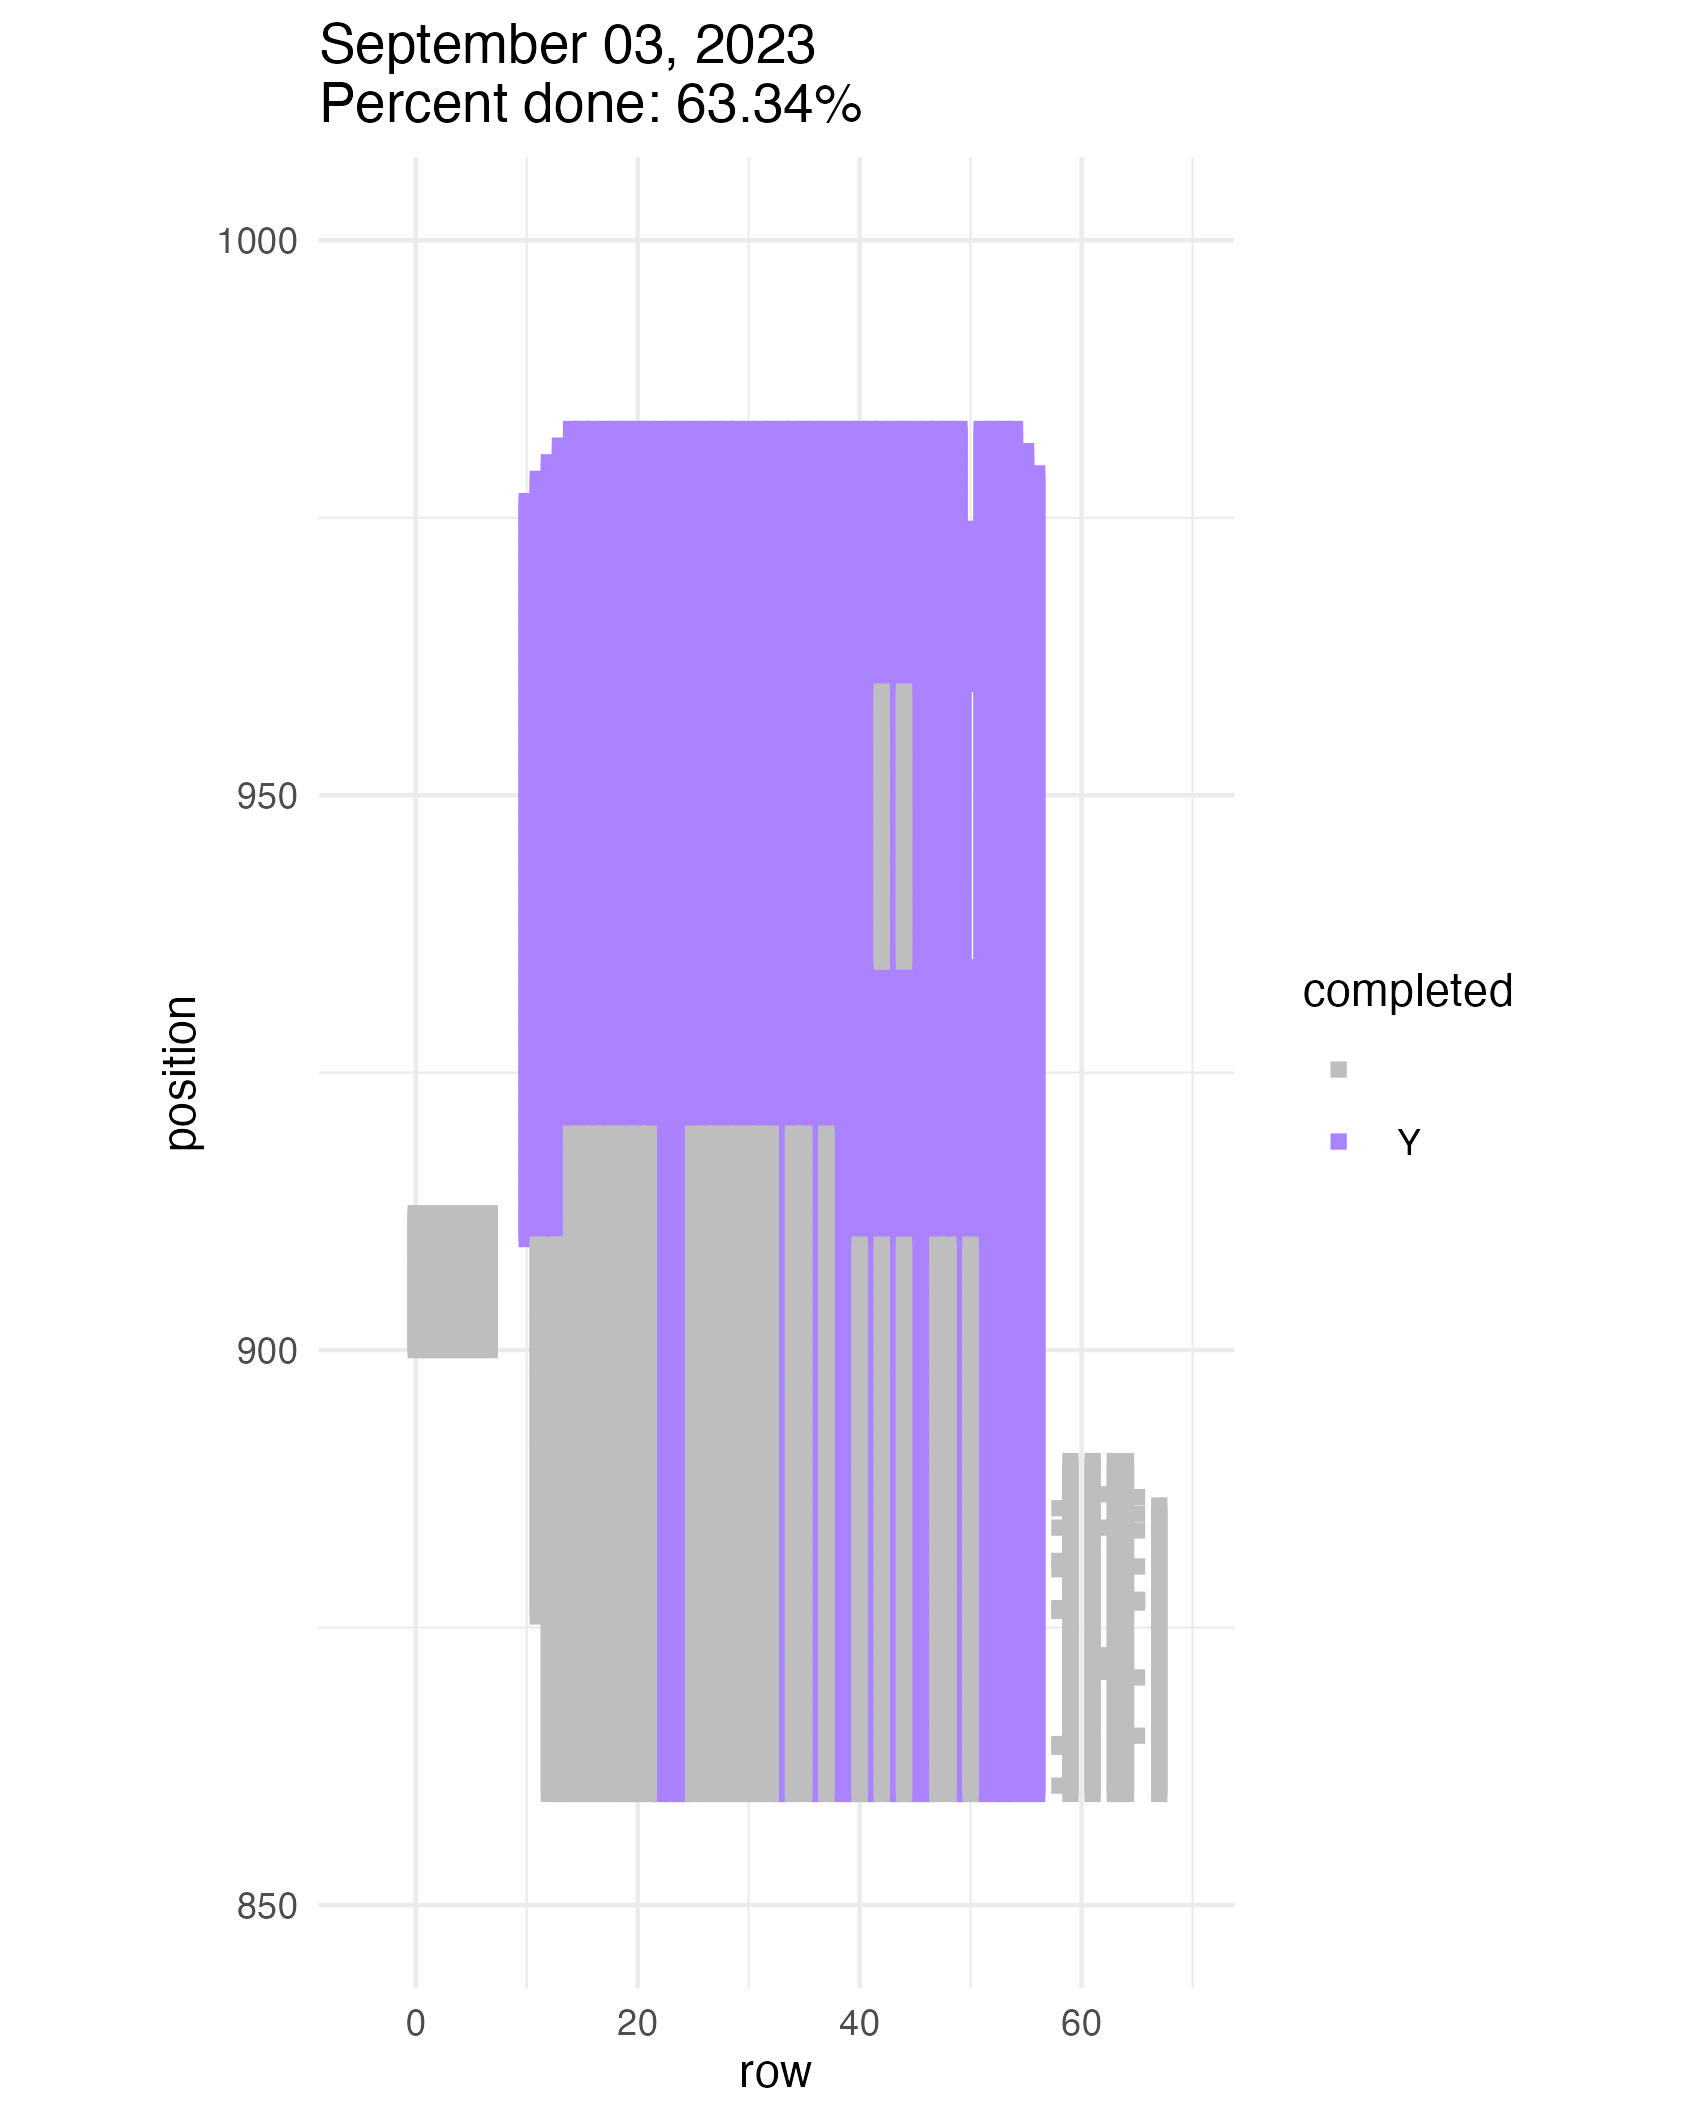
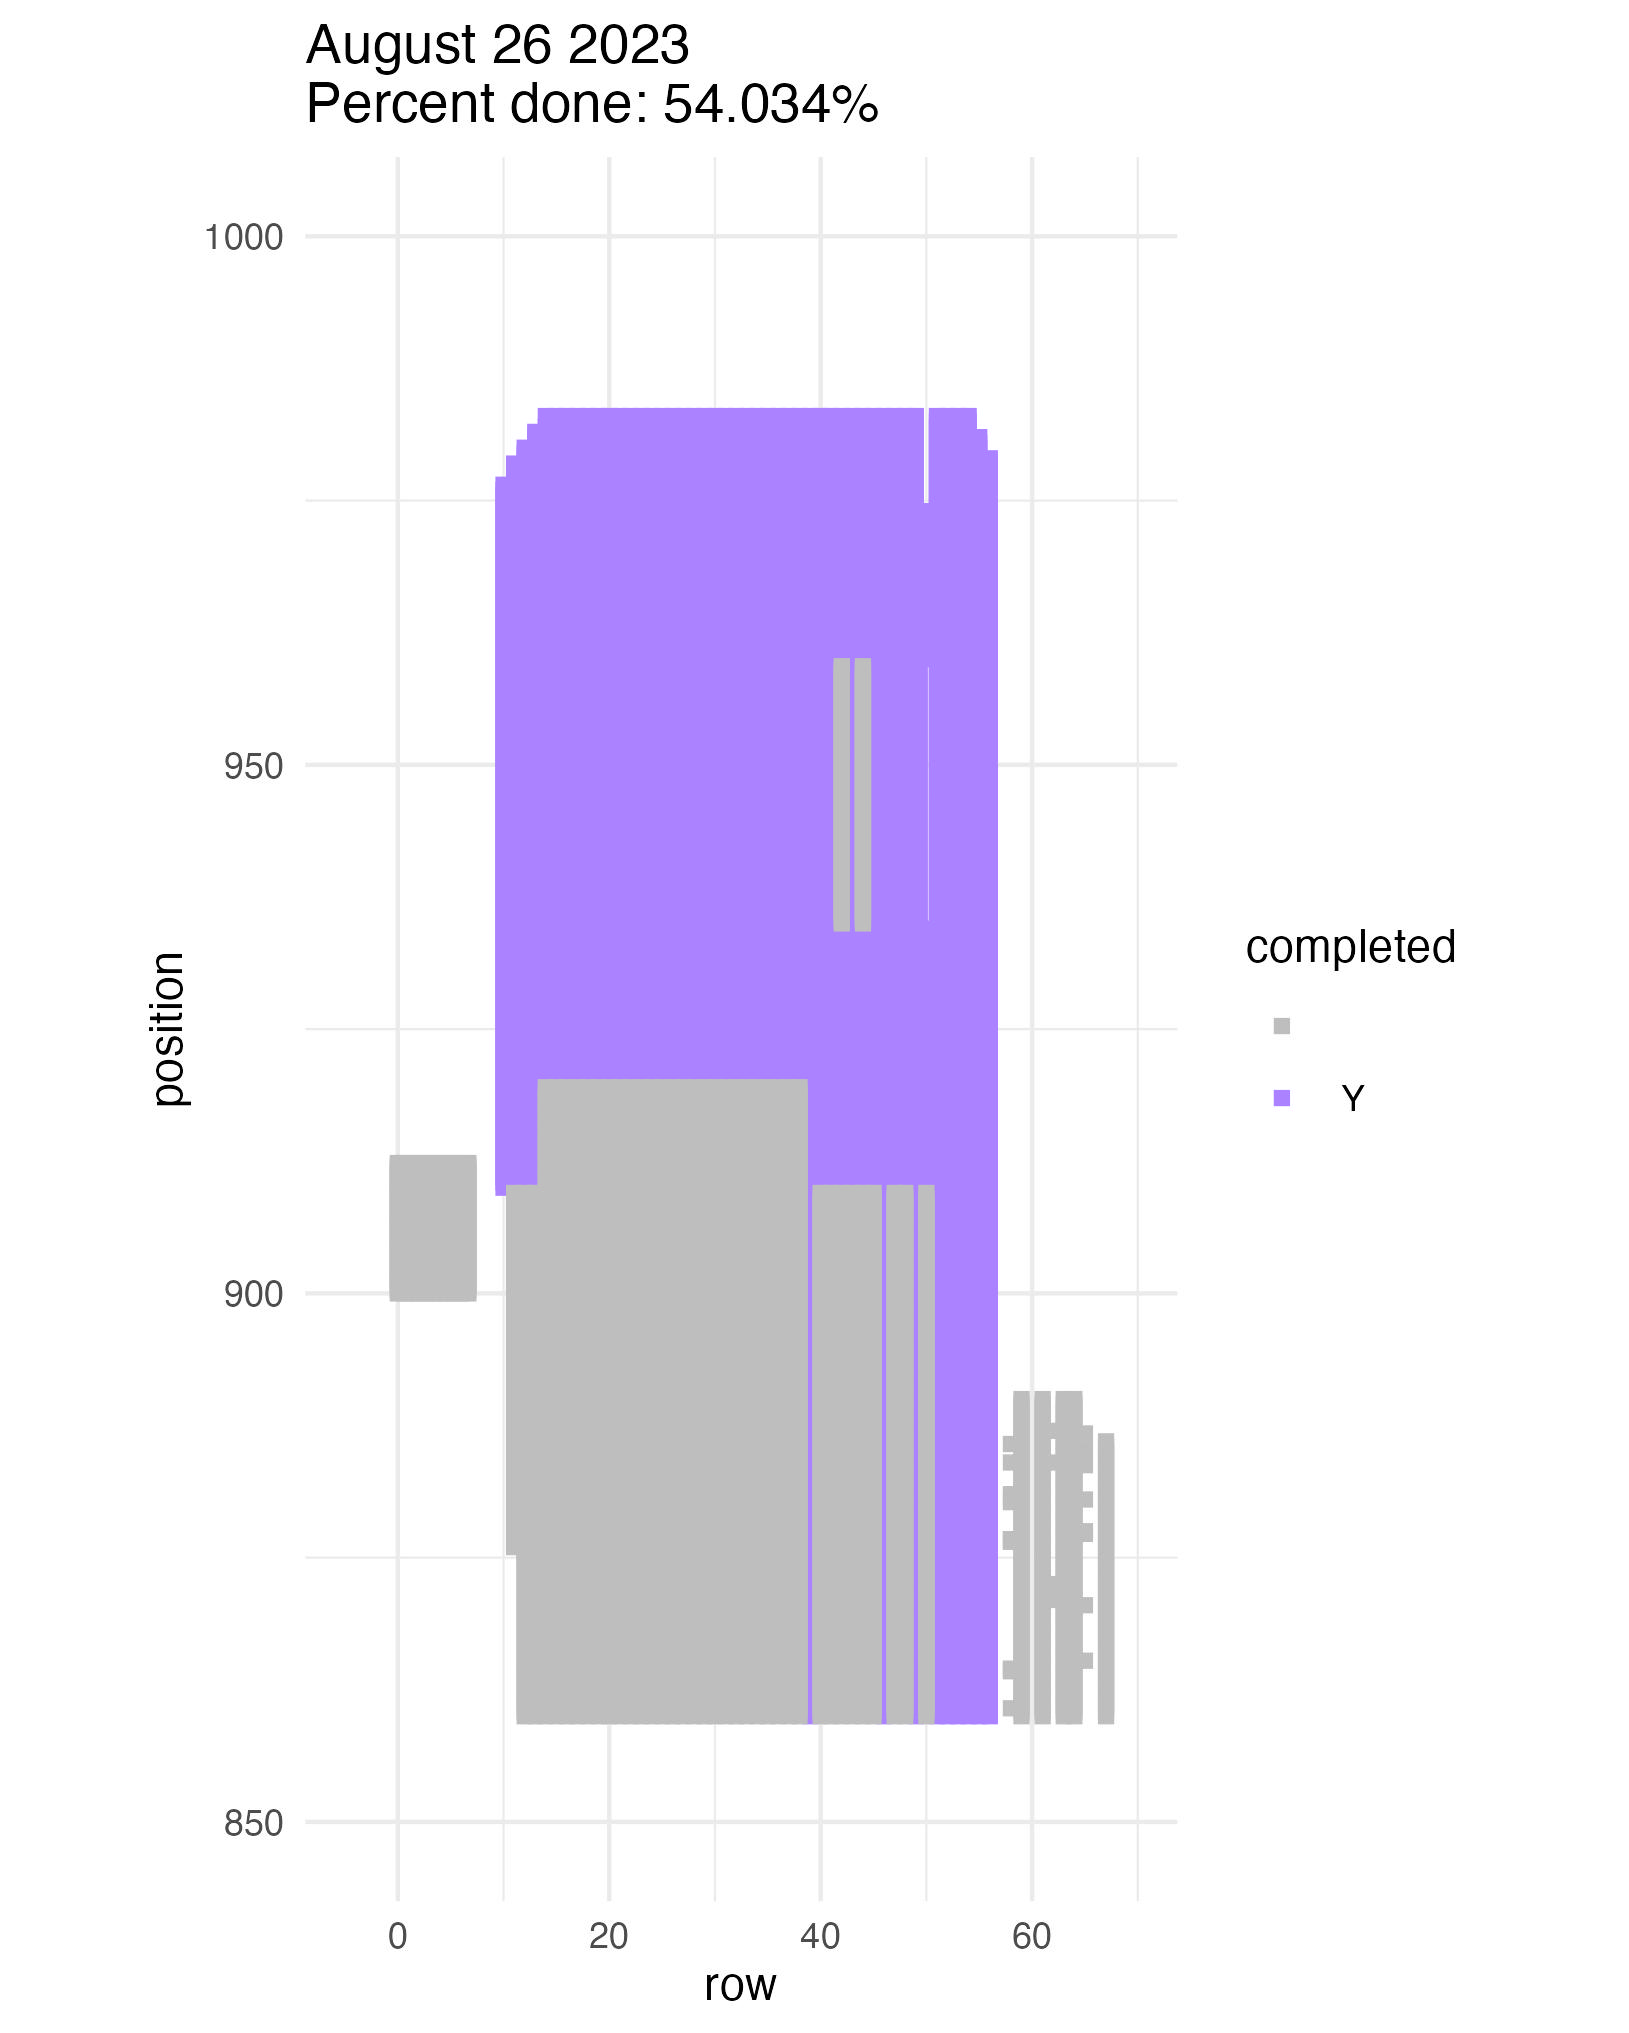
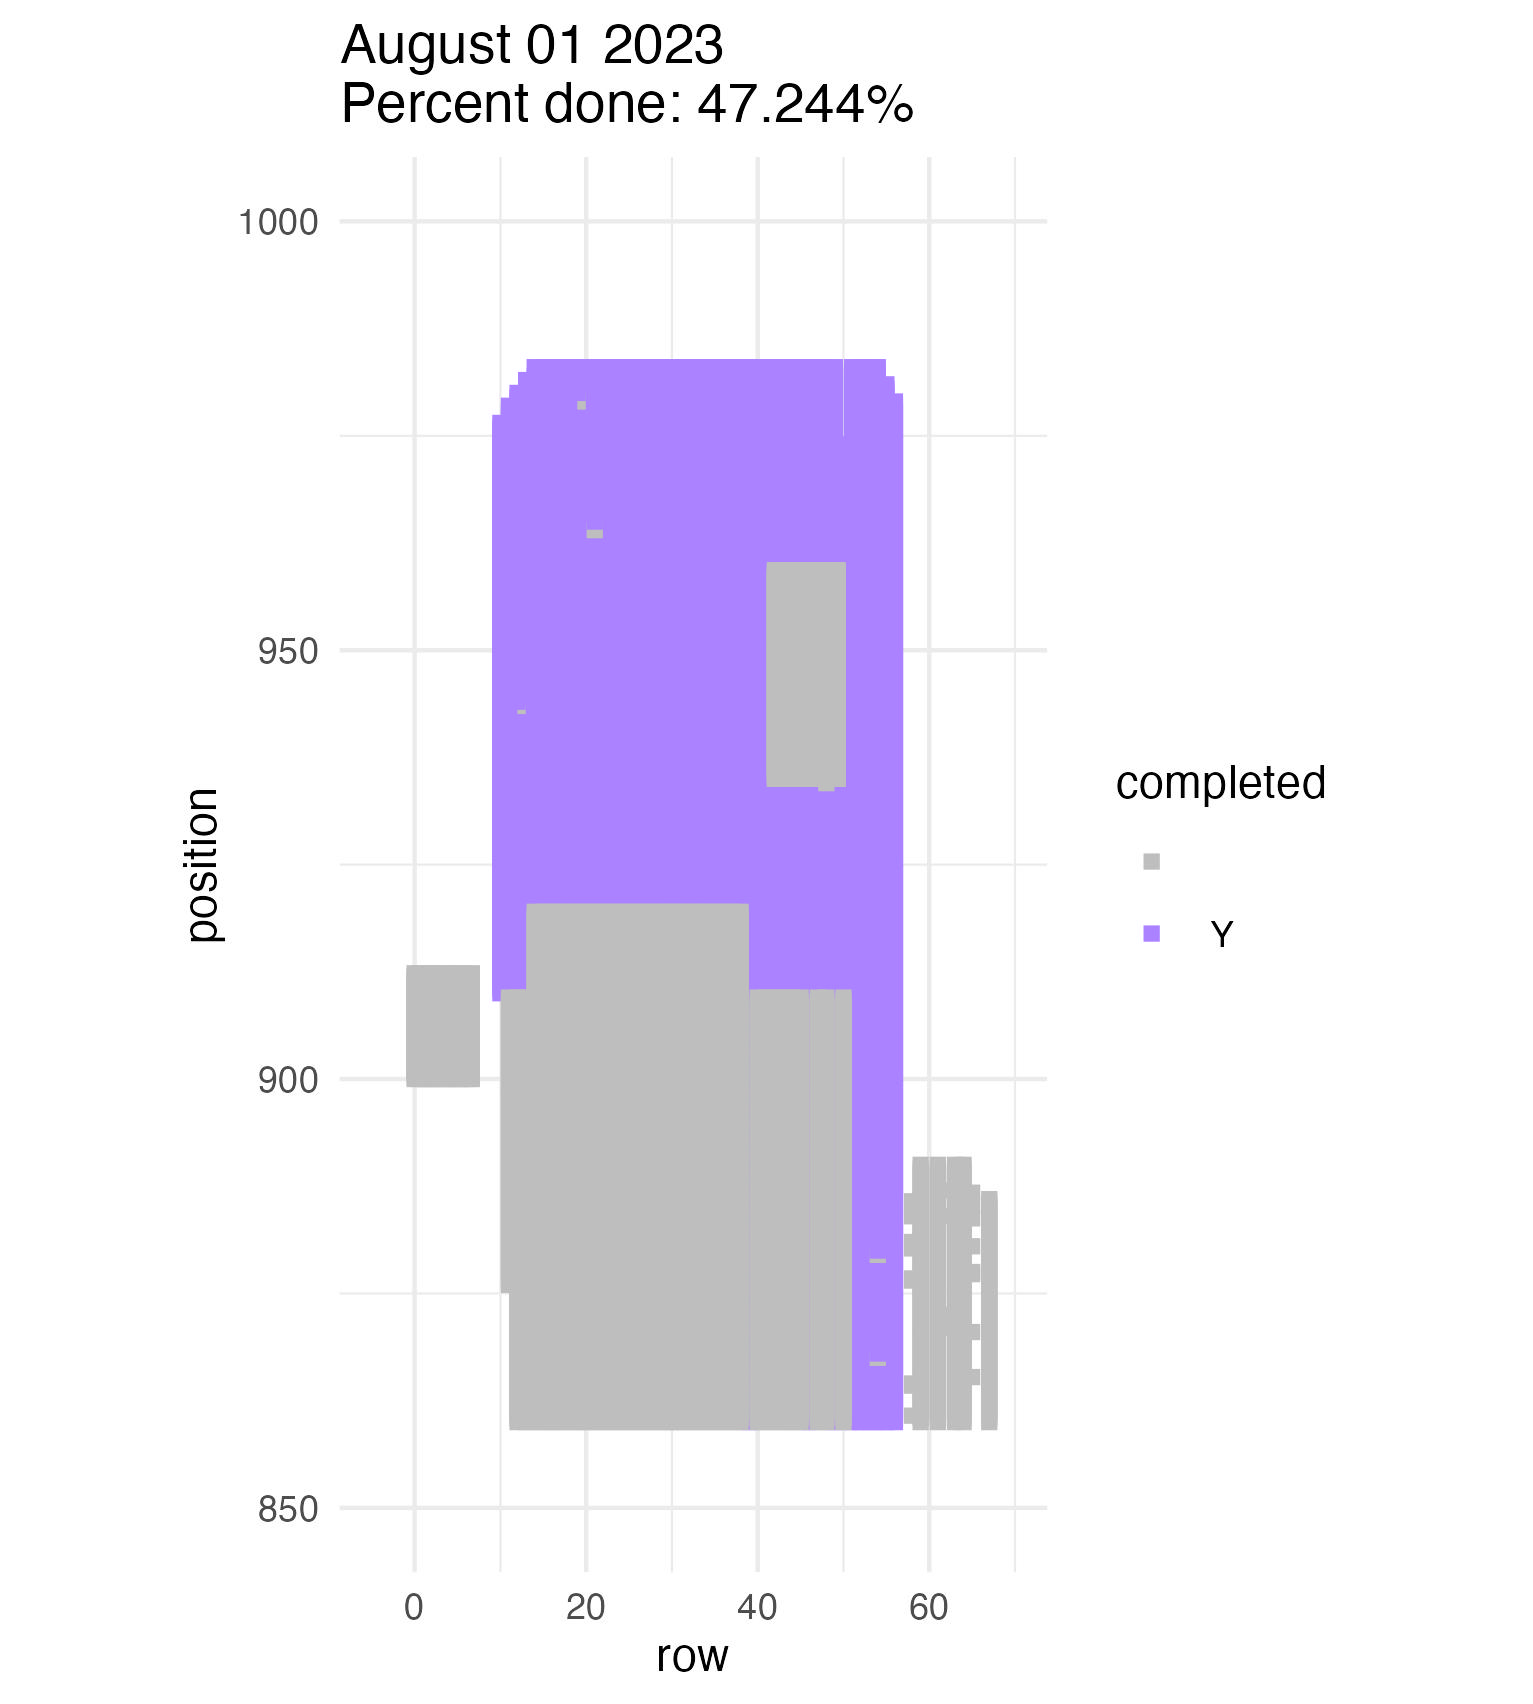
Members of Team Echinacea do a good job while measuring. Members of Team Echinacea are also humans (mostly, I think). We make mistakes! Maybe we searched for a plant that is there, but we couldn’t find it. Or maybe we had missteps while recording data. That’s why an essential part of our work each summer is identifying errors and inconsistencies in our database and then revisiting these in the field to check our work, as well as searching again for any plants we marked as can’t finds.
Thanks to the ghost of interns past, there is quite a bit of framework and functions that already exist to handle this work. It’s also a bit of a hodgepodge to keep track of, especially when you don’t have last year’s cg intern to show you around (we miss you Lindsey!) Here, I am documenting my personal journey in figuring out the who what when where why and hows of this process. I’ll continue updating this as I learn more.
Step 1: preRaw -> raw
The first step in the process is to take the data from the visors, which we call “preRaw” and turn it into a “raw” state that we can more easily work with. This is mostly a quality control step that a) formats the data how we like it and b) identifies and eliminates any carriage return issues that would be a source of head scratching down the line.
We do this step in a single script, but in separate steps for exPt08, exPt10, and then the rest of the plots as one. The same goes for the head data. Ideally, we would put in the work to combine all plots into one. Unfortunately there is a labor shortage, shall we say.
2024 script: ~cgData/summer2024/measureRaw/makeRawMeasure.R
Step 2: raw -> good
Next, we put the data through some more formatting tweaks. We also create a column called “recQ” (record quality) and tentatively mark every record we have as “good”. Any record with this field marked as “good” will be included in measureGood/plantAll_2024.txt and measureGood/headAll_2024.txt. Even prior to fixing errors, these can be useful in other processes, like setting up harvest.
2024 scripts:
- ~/cgData/summer2024/measureGood/makeGoodPlantAll_2024.R
- ~/cgData/summer2024/measureGood/makeGoodHeadAll_2024.R
Step 3: making “good” actually good
That’s just the trick, isn’t it? There are a number of ways we go about getting good records. For some records, the mistake is obvious and easy to fix in R. When this is the case, you make the change in the offending column(s) directly in “pp” or “hh”, the plant and head measure data frames, respectively. If it’s as simple as updating plant status to basal, only the plant status field needs to be update and the recQ field remains set to good. If the entire record is bad, you can modify recQ to be something other than “good” to keep the record from being included in plantAll or headAll (e.g., “dup record”).
Other times, we have to revisit the location in the field. When this is the case, we identify the issue and change recQ from “good” to a descriptive note about the issue. For example, any issue that I feel is worthy of a revisit in the field, I make sure to change the recQ to “revisit; xxx” with “xxx” being a brief note about the issue. The hh df is special in that it also has an “auditNote” column, where you can add additional notes about any issues. I’m not sure why this is exclusive to the head data.
Some ways we identify issues:
- compare2vectors()
- Ol’ reliable. I use this first thing to compare the cgPlaIds that are in the plot (use getPlaIds(), but don’t forget to add Amy’s annex in p1. side note, add Amy’s annex to getPlaIds()) to cgPlaIds we have measure records for (in pp)
- This alerts me of any records missing and any dups
- compareStatusToPrior()
- Location: ~/functions.R
- specific to plantMeasure
- This function, when assigned to a variable, spits out a list of many things and is very useful in identifying errors. It compares the status of the plant this year to the previous year’s and points out when there are issues. As far as I can tell, it only pulls records from pp that have a “good” recQ, so once you make updates you no longer see them pop up as errors here
- Some of the list items I’ve used (or seen others use):
- $summary.df
- summarizes all the varying combinations of prior and current statuses (referred to as “conditions”) and labels them as either an error (TRUE), not an error (FALSE) or NA (probably an error? Look into this if you encounter it).
- $plaIdsByCondition
- Lists which plaIds have which condition. I found it useful for finding plaIds with conditions that were labeled NA in summary.df
- $search0.err
- Contains a list of cgPlaIds whose records certainly have errors (were labeled as TRUE in summary.df)
- This can be used to easily fix or otherwise modify records that need it
- There are a bunch of other list items that I have not encountered in use yet
- compareMainFormandHeadSubform2024.R
- Location: ~cgData/summer2024/issues.hdCt/compareMainFormAndHeadSubform2024.R
- Where we go about the process of comparing plant data to the corresponding head data, or lack thereof.
- Sets up plant and head data to be put through function compareMeasureAndHeadRecords()
- Function source: ~/cgData/summer2022/makeFunctionCompareMeasureAndHeadRecord.R
- Maybe we could move this into functions.R
- Some issues identified with this function require returning to pp in makeGood to fix issues.
- Others require fieldwork. The script produces 2 csvs (called datasheets in the script) to assist with this fieldwork. Notes taken on these datasheets in the field can be used to update pp or hh in makeGood. Datasheet examples:
- Dropbox/CGData/125_measure/measure2024/searchIssues/exPt02searchHeadIssues.csv
- Dropbox/CGData/125_measure/measure2024/searchIssues/exPt02searchHeadIssuesSupp.csv
- makeLfThresholdChecker2024.R
- Location: ~/cgData/summer2024/issues.lf/makeLfThresholdChecker2024.R
- Checks to see if any leaves are suspiciously long or if counts are suspiciously high
- The end goal of this process is also a csv datasheet to return to the plot to record the correct info and then fix it directly in pp. When I did p2, there was no infrastructure to make this datasheet and it looked like Lindsey may have just run the code here and then run the code over in makeLfErrorChecker.R (next bullet) without clearing the environment. Maybe not up to code but this is what I did too. That makes just one datasheet for the two scripts, which is more convenient in the field. Seems like these two could be wrapped into one script.
- makeLfErrorChecker2024.R
- Location: ~cgData/summer2024/issues.lf/makeLfErrorChecker2024.R
- How we check any issues that could be associated with leaf data, primarily checks for any missing or illogical data (e.g., cauline leaf is not recorded for a flowering plant or cauline leaf is recorded for a basal plant)
- This script also produces a csv datasheet that is put into dropbox. We can use this datasheet to collect the correct data in the field and then make the updates directly to pp. Example:
- Dropbox/CGData/125_measure/measure2024/searchIssues/fixLfErrorsExPt02.csv
To be continued…