|
|
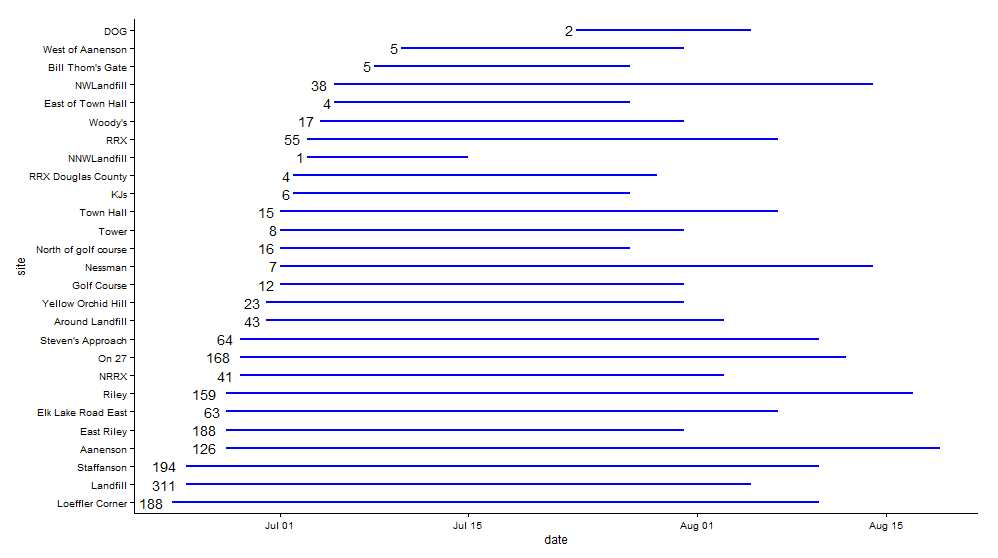
Beginning in 1996, Team Echinacea has monitored the flowering phenology of Echinacea angustifolia in remnant populations around Solem Township. The number of populations and plants we visit has varied over the years; a summary of which populations were monitored in each year can be found at this link. In 2015, we monitored phenology of 1763 heads on 1384 plants at 27 remnant populations. Whew! That is about 400 more flowering individuals than in 2014 although we monitored the same populations. Populations with big increases in numbers of flowering individuals from last year include Aanenson, East Riley, Landfill, and On 27. At each population, we identify all flowering individuals and track their development over the course of the season, gathering data on start and end dates of flowering for every individual. Flowering began at Loeffler’s Corner on June 23rd and ended at Aanenson on August 19th. We will use this data to describe temporal flowering patterns within and among remnants and relate this to potential for successful mating in populations.
 Blue line segments indicate the period of time that at least one individual was flowering at each population. The numbers to the left of the lines indicate the number of individuals that flowered from each population in 2015. Click to enlarge! Look here to read previous flog posts about this experiment.
Start year: 1996
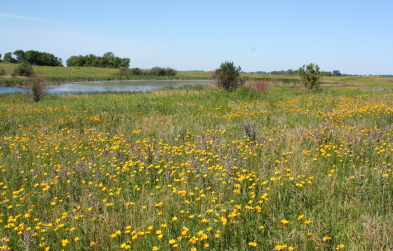
Locations: roadsides, railroad rights of way, and nature preserves in and near Solem Township, MN
Overlaps with: mating compatibility in remnants, demography in remnants, phenology in experimental plots
Team members who have worked specifically on this project include: Amber Zahler (2011), Kelly Kapsar (2012), and Sarah Baker (2013), although gathering phenology data was a whole team effort in 2014 and 2015. Flog posts authored by Kelly, Amber, and other team members may provide additional details about day-to-day activities associated with our flowering phenology monitoring project.
Every year we keep track of flowering phenology in our main experimental plots, exPt1 and exPt2. Summer 2015 was a big year of flowering in both plots, especially in exPt2, where 1233 heads flowered between July 4th and August 26th. ExPt2 was designed especially to study phenology—you can read more about the team’s monitoring of phenology in the 2015 heritability of phenology project status update.
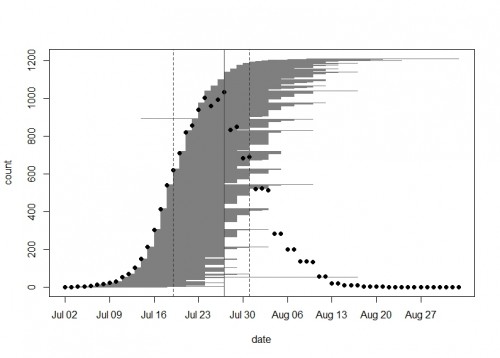
In exPt1, we kept track of 1212 heads on 649 plants (we left out the qGen_a ‘big batch’ cohort). The first head began shedding pollen on July 2nd and the latest bloomer shed pollen on September 2nd. Peak date in exPt 1 was on July 27th when there were 1034 heads flowering. At the end of the season we harvested the heads and brought them back to the lab, where we will count fruits (achenes) and assess seed set.
Read previous posts about this experiment.
 A plot of the 2015 flowering schedule in experimental plot 1 made with the brand new R package mateable–available now on CRAN! Each horizontal gray line segment on this plot represents the flowering time of one head. From bottom to top they are sorted by start day. Black dots show the number of heads in flower on each day. The vertical lines show the peak day (solid) and the days when half of the plants have started flowering and half have ended (dashed).
Start year: 2005
Location: Experimental plots 1 and 2
Overlaps with: Heritability of flowering time, common garden experiment, phenology in the remnants
Products:
These papers report on investigations of flowering phenology of individuals in experimental plot 1 in 2005, 2006, and 2007:
- Ison, J.L., and S. Wagenius. 2014. Both flowering time and spatial isolation affect reproduction in Echinacea angustifolia. Journal of Ecology 102: 920–929. PDF
- Ison, J.L., S. Wagenius, D. Reitz., M.V. Ashley. 2014. Mating between Echinacea angustifolia (Asteraceae) individuals increases with their flowering synchrony and spatial proximity. American Journal of Botany 101: 180-189. PDF
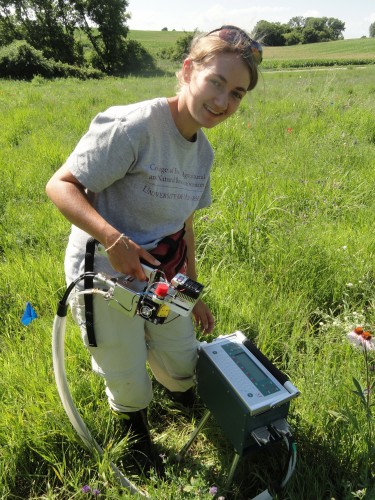
 The functional trait machine used in the Kittelson et al. paper. In 2015, we continued to study the effects of inbreeding on Echinacea angustifolia fitness. This experiment was planted in 2001 where each plant was produced from one of three cross types, depending on the relatedness of the parents: between maternal half siblings; between plants from the same remnant, but not sharing a maternal or paternal parent; and between individuals from different remnants. We continued to measure fitness and flowering phenology in these plants.
This year, of the original 557 plants in INB1, 157 were still alive. Of the plants that were alive this year, 23.4% were flowering and 24.9% have never flowered. Among the plants that were flowering, average head counts was 2, with a maximum of six heads.
Read previous posts about this experiment.
Start year: 2001
Location: Experimental plot 1
Overlaps with: Phenology and fitness in P1
Products:The team collected fitness measurements during our annual assessment of fitness in all plants in P1.
The below papers were published in summer 2015:
Kittelson, P., S. Wagenius, R. Nielsen, S. Qazi, M. Howe, G. Kiefer, and R. G. Shaw. 2015. Leaf functional traits, herbivory, and genetic diversity in Echinacea: Implications for fragmented populations. Ecology 96:1877–1886. PDF
Shaw, R. G., S. Wagenius and C. J. Geyer. 2015. The susceptibility of Echinacea angustifolia to a specialist aphid: eco-evolutionary perspective on genotypic variation and demographic consequences. Journal of Ecology 103:809-818. PDF
The oldest Echinacea plants in experimental plot 1 will turn 20 this year. They are part of the 1996 cohort, which was planted in a common garden experiment designed to study differences between remnant populations and assess life history traits as they grew. Stuart sampled about 650 seeds (achenes) from eight remnant populations in and near Solem Township, representing the range of modern prairie habitat from small patches along roadsides to a large nature preserve. In 1996, he transplanted seedlings on a 1m x 1m grid, randomly assigning the location of each individual.
Every year, members of Team Echinacea assess survival and measure plant growth and fitness traits including plant status (whether it is flowering or basal), plant height, leaf count, and number of flowering heads. We harvest all flowering heads in the fall and obtain their achene count and seed set in the lab.
Of the original 650 individuals, 304 were alive in 2015. This year, 136 individuals from the 1996 cohort were flowering with a total of 303 heads. At present, these heads are in the lab where they await processing to find their achene count and seed set. We used 31 plants (45 flowering heads) from the 1996 cohort as maternal plants in crosses for the most recent heritability of fitness experiment (qGen3). We also used five plants from the 1996 cohort (8 heads total) as part of the pollen exclusion and addition experiment. We covered their heads with pollinator exclusion bags for the duration of the season.
Read more posts about this experiment.
 Stuart passes out pollen to Gina and Ben for crosses between 1996 cohort plants in the qGen3 experiment Start year: 1996
Location: Experimental plot 1
Overlaps with: phenology in experimental plots, qGen3, pollen addition/exclusion
Products:
In 2015, we continued the study of mating compatibility in the remnants that began in 2014. This experiment is designed to assess population level compatibility and to investigate whether difference in flowering phenology and distance between plants predict whether or not a cross will be compatible. We do this by randomly selecting focal plants from remnant populations and then choosing pollen donors which are representative of the ‘extremes’ of these variables–early flowering, late flowering, nearest to focal plant, and furthest from the focal plant.
 Bracts are painted to identify the pollen donor for each style of the focal plant that is being crossed This past summer we conducted this study in six of our largest remnant populations with approximately ten focal plants at each for a total of 228 pairwise crosses. Occasionally we were unable to collect pollen from the most ‘extreme’ individuals because they flowered asynchronously with the focal plant, and in those cases we chose the most ‘extreme’ individual available. Excluding all other pollinators, we performed hand-crosses between the focal plants and their pollen donors and assessed style persistence the following day to evaluate the compatibility of each cross.
Read more posts about this experiment here.
Start year: 2014
Location: large remnant populations
Overlaps with: comprehensive compatibility
Products: The 2015 data from this experiment has been combined with the 2014 dataset and awaits analysis.
Team members who have worked on this project include: Danny Hanson (2015), Amy Waananen (2015), and Claire Ellwanger (2014). Flog posts authored by these team members may provide additional detail about day-to-day activities associated with this experiment.
This summer, Gina Hatch and Abby VanKempen continued a project examining the effects of aphid herbivory on Echinacea angustifolia survival and fitness. This year they found 70 of the original 100 study plants (33 addition and 37 exclusion). Starting July 14th going until August 20th, Abby and Gina visited plants twice each week for a total of 12 visits per plant. On each visit, the plant received its treatment: either adding aphids from other plants if it was in the addition group or removing all aphids if it was in the exclusion group. At the end of the summer, Abby and Gina used the number of leaves with chew marks and holes (signs of foliar herbivory) to quantify herbivory. There was not a significant difference in herbivory between the two treatment groups, where herbivory was measured as the proportion of damaged leaves (p = 0.74). On September 14th and October 15th, Ali Hall took measurements of senescence including number of brown and purple basal and cauline leaves. These have not yet been incorporated into an analysis.
Read more posts about this experiment here.
Start year: 2011
Location: P1
Overlaps with: Phenology and fitness in P1
Products: Fitness measurements were collected during our annual assessment of fitness in P1. A list of focal plants and addition/exclusion datasheets are located in Gina Hatch’s Dropbox folder and can be found here. Gina created a poster and presented at Carleton’s summer research symposium and her poster can be found here. Abby plans to present at the Elbow Lake Library. The senescence data can be found here.
For his REU, Ben Lee designed an experiment to test different methods of seed collection and sorting on Galium boreale. In the 2015 fall burn unit of Hegg Lake WMA, he placed six square ten by ten meter plots around patches of Galium. Ben randomly selected three plots to be machine harvested and the other three plots were chosen to be hand harvested. Hand harvesting was conducted by two team members at one time whereas machine harvesting was done by one person using a modified STIHL Shredder Vac. After harvest, Ben randomly selected three plots for machine sorting and the other three for hand sorting. Machine sorting was done using the dockage tester at the Hoffman Grain Elevator and hand sorting was done by pushing seeds through a standard window screen to remove the duff. Ben found no significant difference in efficiency (g/min) between the two harvest methods but did find that machine sorting is significantly more efficient than sorting by hand.
The team at Hegg, close to Ben’s plots Start year: 2015
Location: Hegg Lake WMA
Products: Ben wrote a report and created a poster that was presented at his school’s (St. Mary’s College of Maryland) summer research symposium. The poster can be found here.
For her RET project, Lea gathered data to study the relationship between flowering density and seed set. She worked at Staffanson Prairie Preserve, which appears to have higher flowering density in burn years than non-burn years. This year, 2015, was a non-burn year. Lea and Team Echinacea kept track of the style persistence of about 50 individuals for which we have seed set information from prior burn years. These individuals were harvested and their achene count and seed set will be assessed in winter 2016 by Gordon Younkin, an undergraduate intern from Northwestern University. Gordon will work to build a model of seed set in Staffanson in a non-burn year and aims to compare this model to a burn year.

Site: Staffanson Prairie Preserve
Start year: 1996
Location: Staffanson Prairie Preserve
Overlaps with: phenology in remnants, phen for aii
Products: Lea is developing a dataset and lesson plan for high-school students to compare individual plants’ style persistence in burn years and non-burn years to test hypotheses about seed set in high- and low- flowering density. This lesson will introduce students to R and its use in data management and statistical analysis.
Read other flog posts about this experiment.
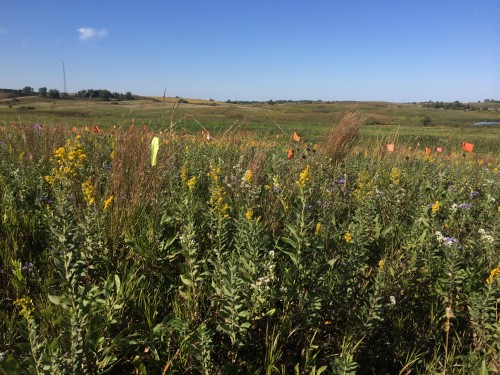
For his REU research project, Will is investigating heritability of flowering phenology in experimental plot 2 (p2), which was planted in 2006 with 3961 individuals selected for extreme (early or late) flowering phenology. This summer Will and Team Echinacea monitored the phenology of all 646 flowering plants (1216 individual heads) in p2, as well as the phenology of their parents in p1. Flowering in p2 began on the 4th of July and ended on August 26th. The peak day of flowering was July 27th when 1018 heads were flowering. The average duration of flowering for a head was 12.1 days. It was a huge year for flowering in p2 with nearly 5 times more heads than 2014 and over 16 times more than 2013. Will is comparing the flowering schedules of the p2 plants with the 2005 phenology records of their parents. As the plants in p2 mature, and perhaps flower more frequently, we will continue to gather data on family lines of Echinacea to discern the genetic component of their flowering phenology.
Many flags indicate many flowering plants in experimental plot 2 Start year: 2006
Location: Experimental plot 2 (Hegg Lake WMA)
Overlaps with: phenology in experimental plots
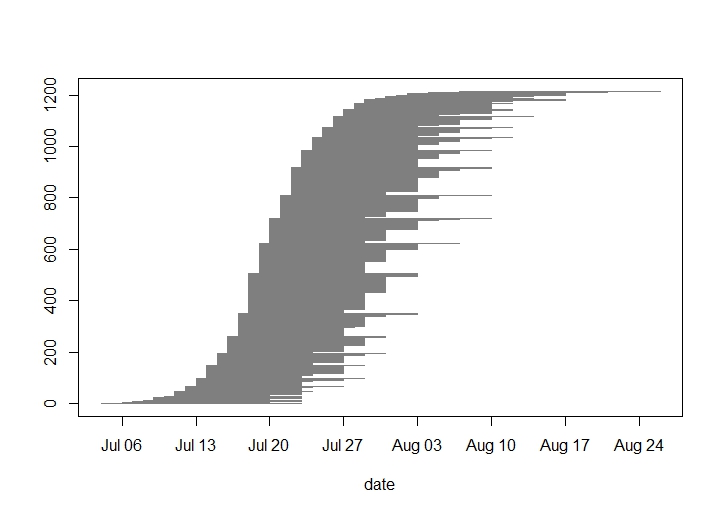
Products: The 2015 phenology records from p2 will be added to the existing multi-year ExPt2 phenology dataset. Will is using tools from the R package echPhenology developed by Team Echinacea to analyze and produce visualizations of the flowering schedule observed in p2. He plans to present his findings at a conference in spring or summer 2016.
 2015 flowering schedule of all heads in p2: First day of flowering was July 4th, peak was July 27th, and the last day was August 26th.
Read previous posts about this experiment.
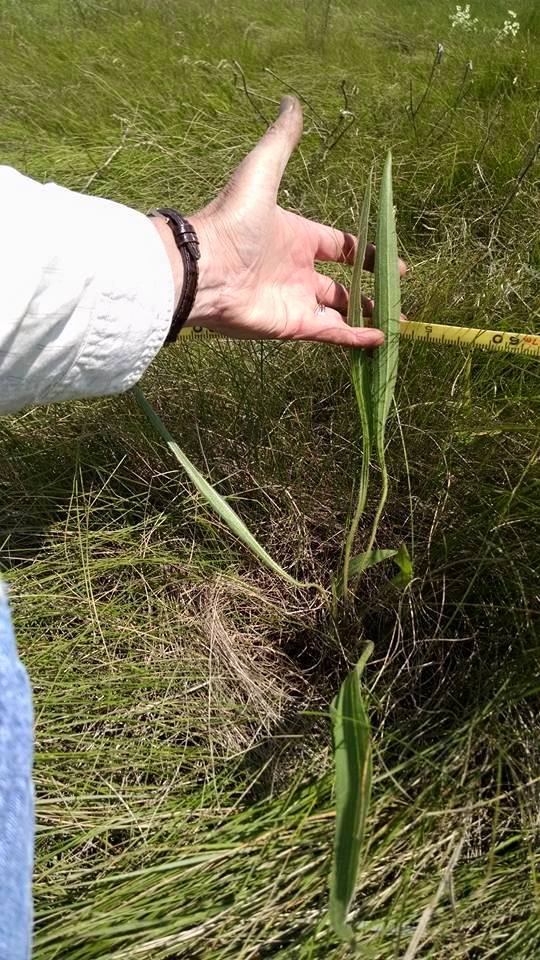
 Thanks to some critical help from Team Echinacea, we were able to complete the 2015 census on the local adaptation experiment this week. We found a total of 282 live Echinacea plants this summer (compared to 372 in 2014). 96 of the survivors live in the western South Dakota plot, and 186 in the Hegg Lake plot. None of the plants have yet flowered, though some of the western SoDak plants seem to be large enough (see photo). Maybe next year! Thanks to some critical help from Team Echinacea, we were able to complete the 2015 census on the local adaptation experiment this week. We found a total of 282 live Echinacea plants this summer (compared to 372 in 2014). 96 of the survivors live in the western South Dakota plot, and 186 in the Hegg Lake plot. None of the plants have yet flowered, though some of the western SoDak plants seem to be large enough (see photo). Maybe next year!
|
|