|
|
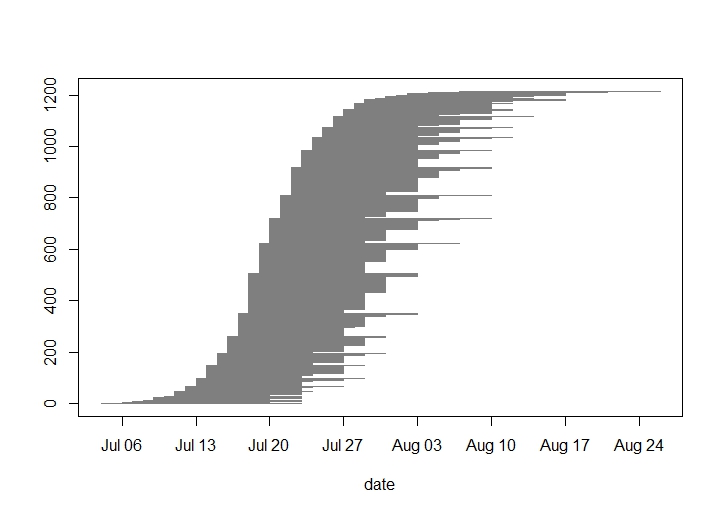
In 2017, we monitored the start and end dates of flowering for the 676 flowering plants (1116 heads) in experimental Plot 2. The first head started shedding pollen on June 26 and the latest bloomer ended flowering on August 19. Peak flowering was on July 13th. Note that these dates are subject to change as this is preliminary data that has not been fully cleaned and analyzed.
To examine the role flowering phenology plays in the reproduction of Echinacea angustifolia, Jennifer Ison planted this plot in 2006 with 3961 individuals selected for extreme (early or late) flowering timing, or phenology. Using the phenological data collected this summer, we will explore how flowering phenology influences reproductive fitness and estimate the heritability of flowering time in Echinacea angustifolia.
 One of the earlier flowering plants at exP2 this summer, a plant with 5 heads at Row 2 Position 1. Start year: 2006
Location: Experimental Plot 2, Hegg Lake WMA
Overlaps with: phenology in experimental plots, phenology in the remnants
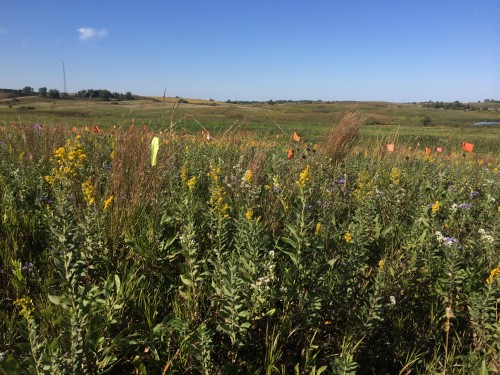
Physical specimens: We harvested approximately 1081 heads from exPt 2 (preliminary inventory). Some of these heads had a major loss of achenes, either due to the early flowering time that we were not expecting or windy and rainy weather that dispersed the achenes quickly. We brought the harvested heads back to the lab, where we will count fruits and assess seed set for each head.
Data collected: We visited all plants with flowering heads every two days (three days after weekends) until they are done flowering to record start and end dates of flowering for all heads. We will manage phenology data in R and add it to the full dataset.
Products: Will estimated heritability of flowering time using data from 2015 and presented his findings last summer at ESA (see his poster). He is continuing this work by assessing how heritability estimates differ between years in burn and non-burn years, now including 2016.
You can find more information about the heritability of flowering time and links to previous flog posts at the background page for the experiment.
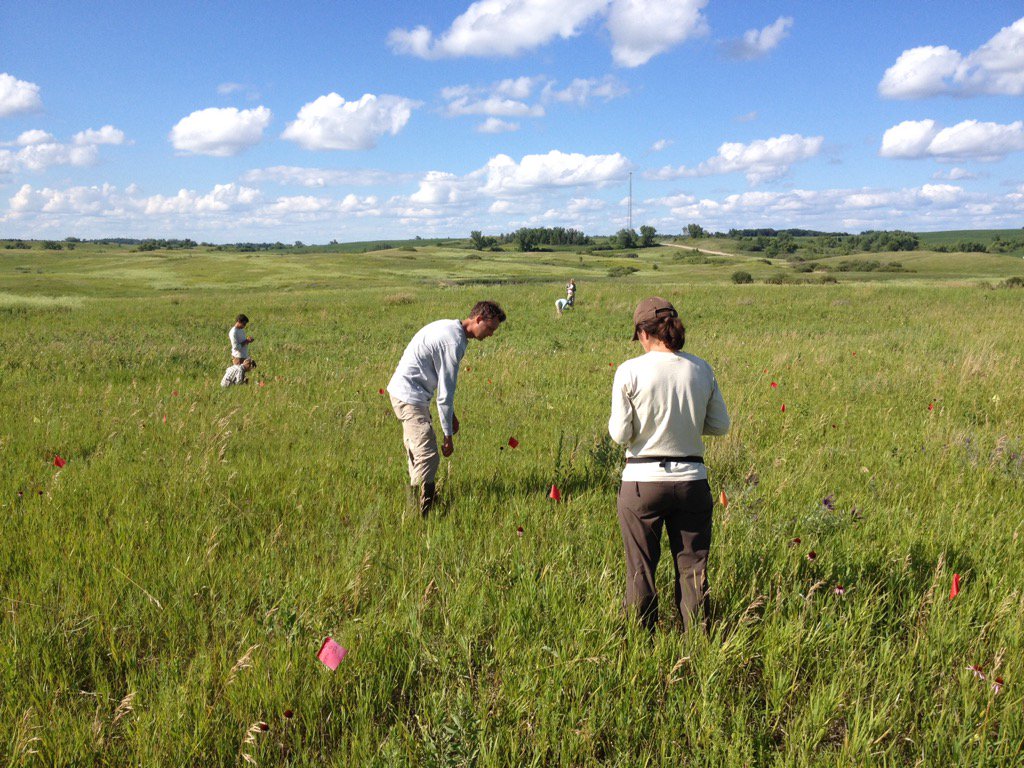
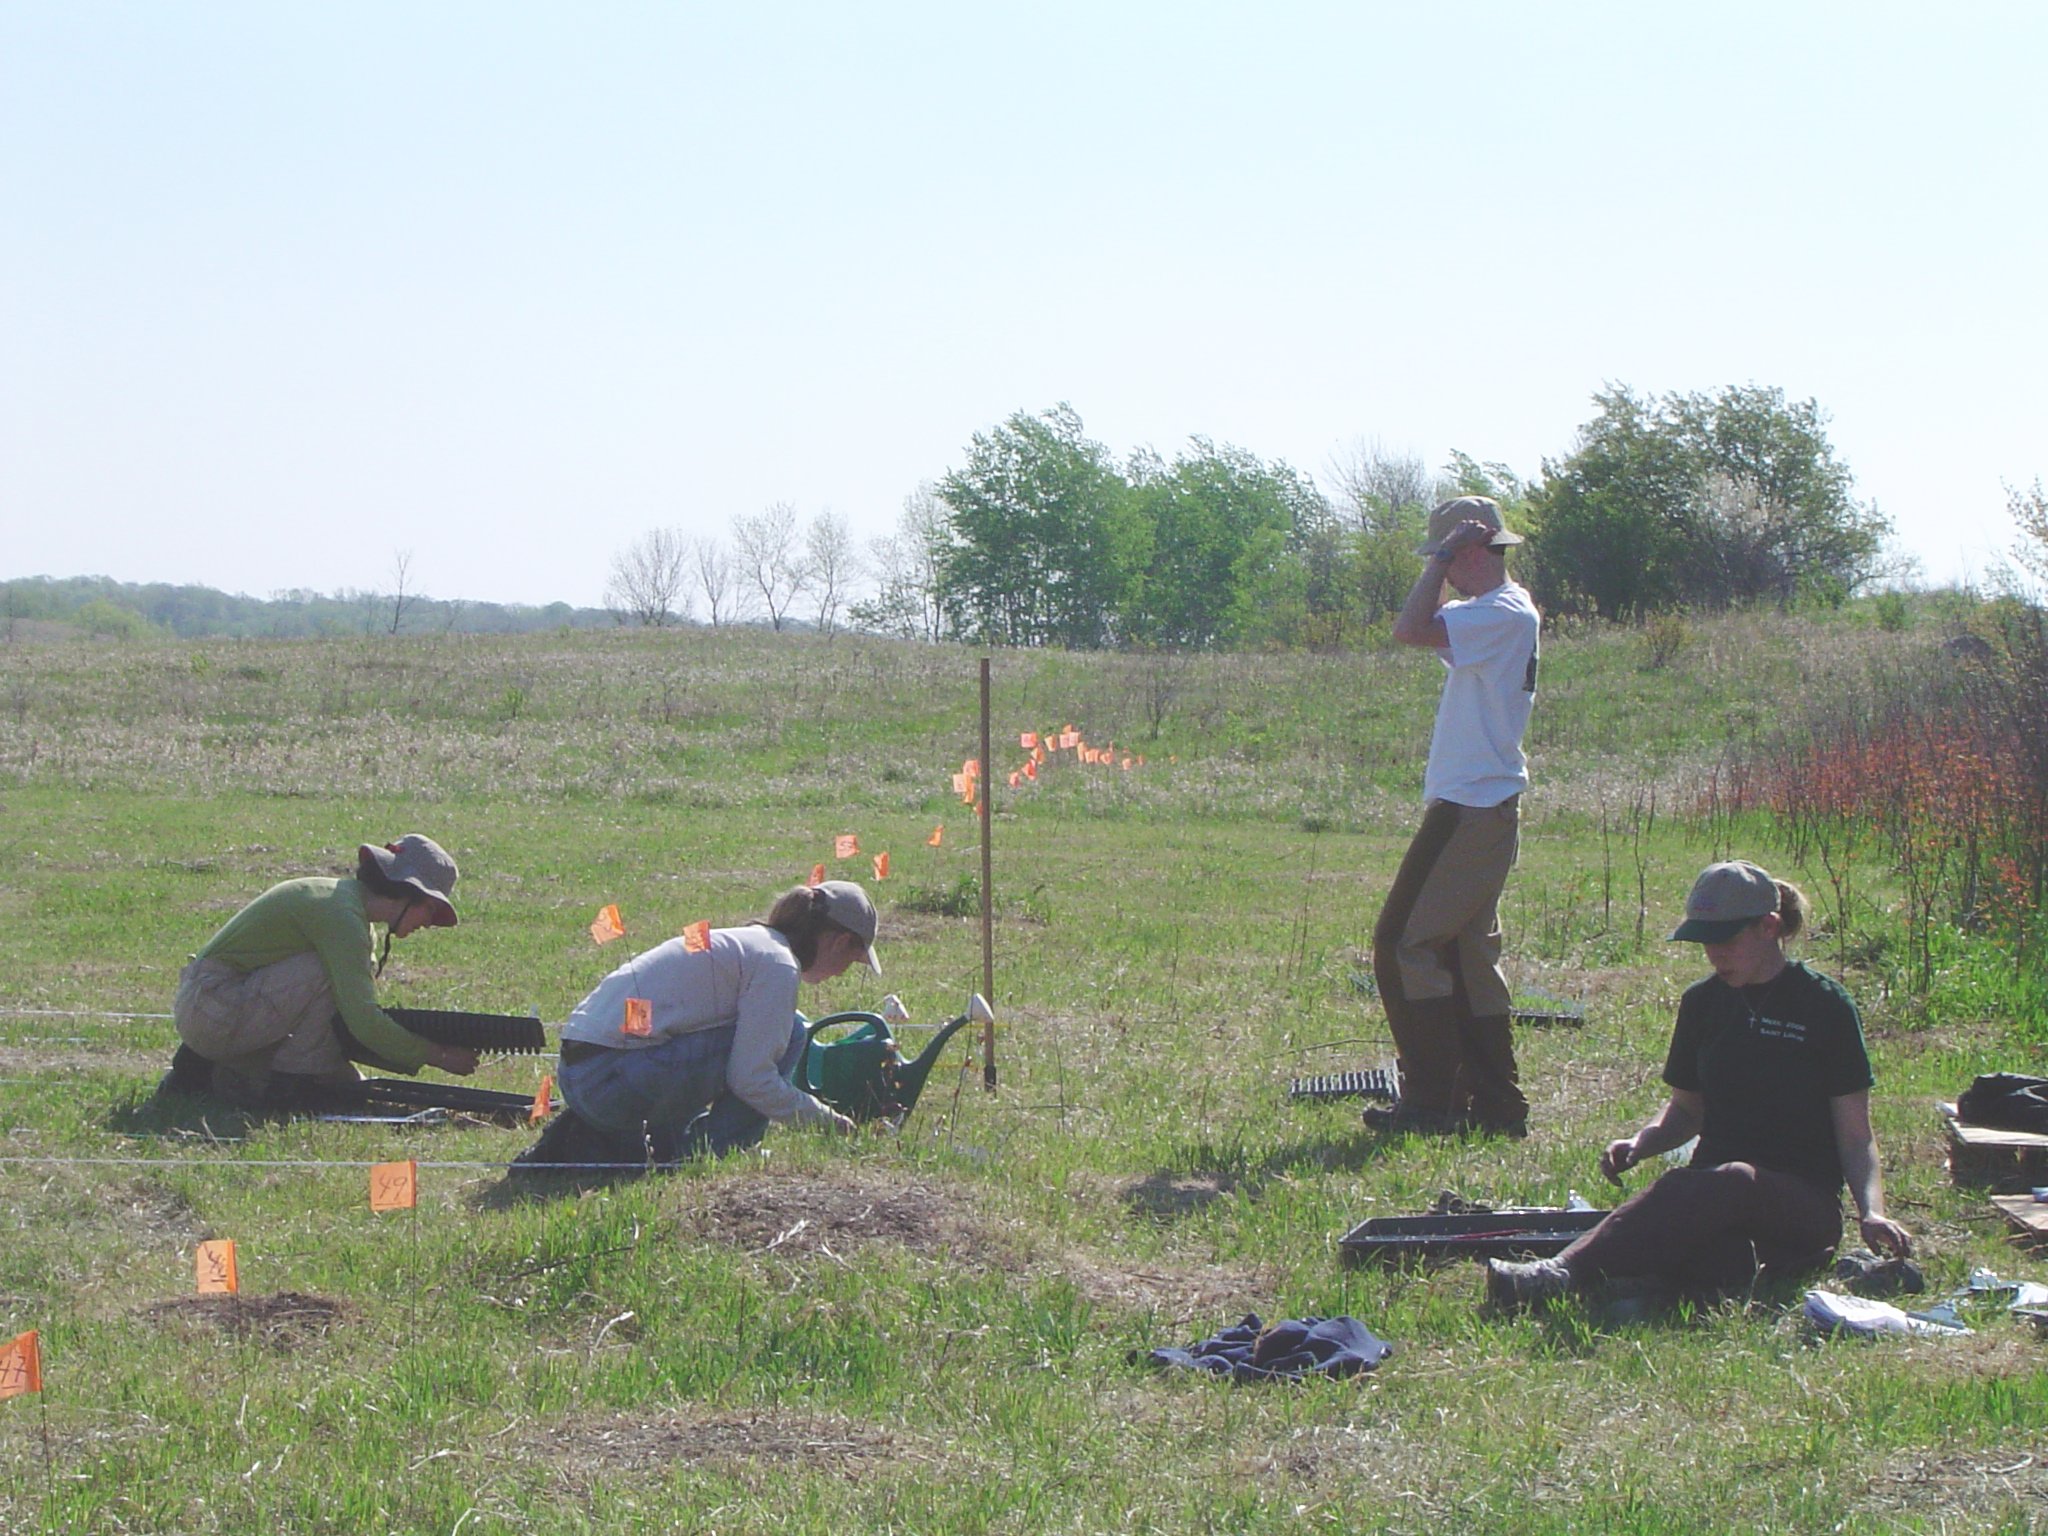
To examine the role flowering phenology plays in the reproduction of Echinacea angustifolia, Jennifer Ison planted experimental plot 2 (exPt 2) in 2006 with 3961 individuals selected for extreme (early or late) flowering timing, or phenology. In 2016, we monitored the start and end dates of flowering for the 570 flowering plants (933 heads) in the plot. The first head started shedding pollen on June 22 and the latest bloomer ended flowering on August 8th. Peak flowering was on July 7th, when 810 heads were flowering. Using the phenological data collected this summer, we will explore how flowering phenology influences reproductive fitness and estimate the heritability of flowering time in Echinacea angustifolia.
 Tracking phenology for 900+ heads in exPt2 was a big job. Here, three teams assess phenology on a nice day at exPt 2. Start year: 2006
Location: Experimental Plot 2, Hegg Lake WMA
Overlaps with: phenology in experimental plots, phenology in the remnants
Physical specimen: We harvested 870 heads from exPt 2. We were unable to harvest some heads which had been grazed by rodents. We brought the harvest back to the lab, where we will count fruits and assess seed set. Jennifer previously collected tissue samples from all individuals in the plot and plans to use these to genotype all of the individuals that flowered in 2016 this year and determine their parentage in exPt 1.
Data collected: We visit all plants with flowering heads every three days until they are done flowering to record start and end dates of flowering for all heads. We managed phenology data in R and added it to the full dataset.
Products: Will estimated heritability of flowering time using the data from 2015 and presented his findings this summer at ESA (see his poster here). He is continuing this work by assessing how heritability estimates differ between two years. He is comparing flowering in 2015 (a burn year) and 2016 (a non-burn year).
You can find more information about our experiment the heritability of flowering time and links to previous flog posts regarding this experiment at the background page for the experiment.
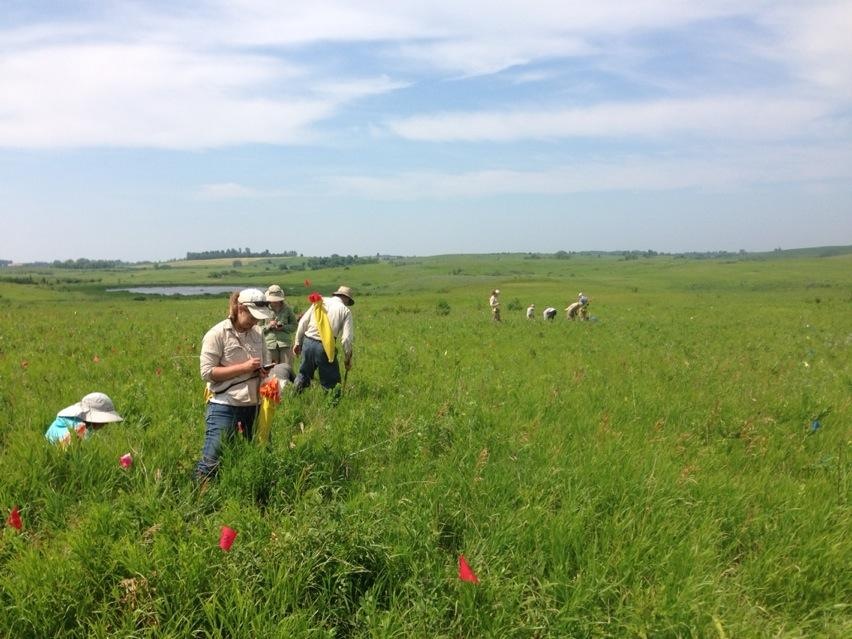
For his REU research project, Will is investigating heritability of flowering phenology in experimental plot 2 (p2), which was planted in 2006 with 3961 individuals selected for extreme (early or late) flowering phenology. This summer Will and Team Echinacea monitored the phenology of all 646 flowering plants (1216 individual heads) in p2, as well as the phenology of their parents in p1. Flowering in p2 began on the 4th of July and ended on August 26th. The peak day of flowering was July 27th when 1018 heads were flowering. The average duration of flowering for a head was 12.1 days. It was a huge year for flowering in p2 with nearly 5 times more heads than 2014 and over 16 times more than 2013. Will is comparing the flowering schedules of the p2 plants with the 2005 phenology records of their parents. As the plants in p2 mature, and perhaps flower more frequently, we will continue to gather data on family lines of Echinacea to discern the genetic component of their flowering phenology.
 Many flags indicate many flowering plants in experimental plot 2 Start year: 2006
Location: Experimental plot 2 (Hegg Lake WMA)
Overlaps with: phenology in experimental plots
Products: The 2015 phenology records from p2 will be added to the existing multi-year ExPt2 phenology dataset. Will is using tools from the R package echPhenology developed by Team Echinacea to analyze and produce visualizations of the flowering schedule observed in p2. He plans to present his findings at a conference in spring or summer 2016.
 2015 flowering schedule of all heads in p2: First day of flowering was July 4th, peak was July 27th, and the last day was August 26th.
Read previous posts about this experiment.
To examine the role flowering phenology plays in the reproduction of Echinacea angustifolia, Jennifer Ison planted experimental plot 2 (P2) in 2006 with 3961 individuals selected for extreme (early or late) flowering phenology. In 2014, we measured traits for all 2123 living plants and monitored the daily phenology of 247 flowering heads. Echinacea flowering began on July 2 in P2 and continued through August 24. Using the phenological and trait data collected this summer, we will explore how flowering phenology influences reproductive fitness and estimate the heritability of flowering time in Echinacea angustifolia.
Read previous posts about this experiment.
Start year: 2006
Location: experimental plot 2 (Hegg Lake WMA)
Overlaps with: pollinator efficiency
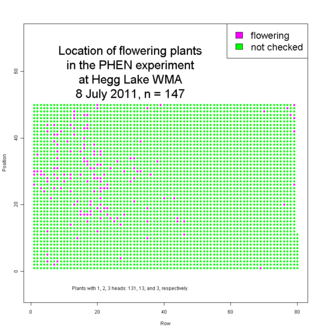
We found 147 flowering plants in Jennifer’s Phenology Experiment during a thorough, but not exhaustive, search on Friday. Most of these plants have buds only and will start shedding pollen later. I posted a map of locations of all plants to flower this year.
 Click on thumbnail to see a larger map. Click on thumbnail to see a larger map.
Jennifer planted this experiment to investigate heritability of flowering timing (phenology) in spring 2006.
Last year eight plants flowered and about 2700 plants were alive. Read about measuring last year.
Assuming that almost all of those plants are still alive and that we didn’t find all the flowering plants, then about 6% of surviving plants will flower this year (>147/2700).
For kicks, I made maps of the paths of data enterers. We usually worked in pairs and used one person’s PDA to enter data. Here are the paths…
Josh D’s visor, Amber E’s, Nicholas G’s visor, Gretel K’s visor, Lee R’s visor, Callin S’s, Stuart W’s visor, Maria W’s visor, Amber Z’s visor. For the record Katherine M’s visor had only one record and we didn’t use Karen T’s visor.
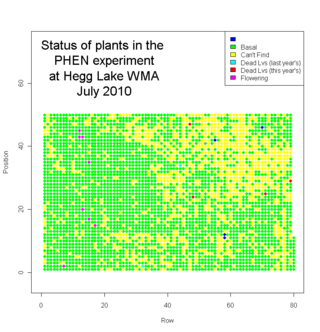
We finished measuring plants in Jennifer’s Phenology plot at Hegg Lake WMA this Friday.

We measured many plants.
We measured about 2700 plants. Eight plants flowered this year. We visited another 1300 locations where we couldn’t find a plant (mostly because they had died). Here’s a map of the plot with the status of each location (click to see a bigger version)…
In addition to Echinacea angustifolia, we saw some good prairie plants in the plot, including lead plant (Amorpha canescens), yellow lady-slipper (Cypripedium calceolus), prairie rose (Rosa arkansana), Missouri goldenrod (Solidago missouriensis), silver leaf scurf pea (Psoralea argophylla), and many others.
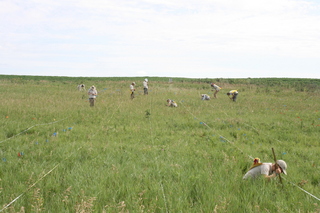
It was a big job, but we were quite efficient. We laid out 50m tapes on every other row to help guide us. Four of us went out on Wednesday to flag positions 1 and 50 for all rows. That took ~2h. We started flagging positions 10, 20, but that was unnecessary. On Thursday we all went out and measured from 2-4 pm. On Friday we did two shifts: 10 -12 and 2:30 -5.
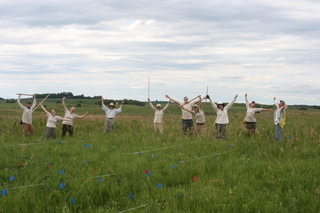
We were happy to be done.
On the way out we removed a weed that we had noticed the day before–spotted knapweed. We were careful not to touch it because it can be a skin irritant. I’d never seen this plant in the study area before.
Heading home.
What a great way to end the week. It was Katie and Laura’s last day. They are heading back to the Chicago Botanic Garden to prepare their posters and talks.
This afternoon we are going to measure plants in Jennifer’s Phenology plot at Hegg Lake WMA. Here is a script that makes a datasheet that assigns us rows to measure. The order is approximately 1 – 80, but they are slightly mixed up (just to keep us on our toes): measurePHENatHeggLakeRows.r
Thank you all for your hard work when we measured my Hegg Lake common garden a week back. It was by far the fastest the Hegg garden was ever measured and there were no rechecks besides can’t finds! Below is some information regarding the Hegg garden.
Total plants planted in May 2006: 3,945
Number alive in August 2006: 3,699 (94%)
Number alive in August 2007: 3,320 (84%)
Number alive in August 2008: 3,008 (76%)
Number alive in August 2009: 2,834 (72%)


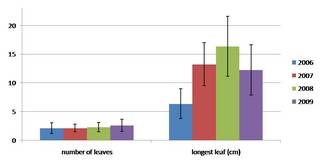
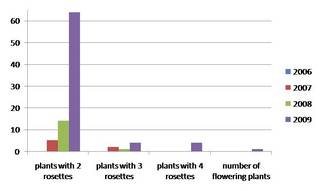
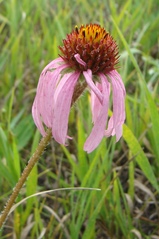
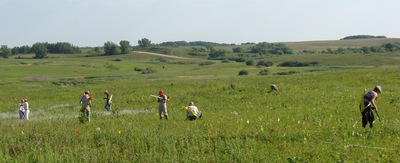
As you can see the length of the longest leaf actually decreases from 2008 to 2009. However, there were way more plants with multiple rosettes this year than in years past. I think the leaf length decreased because last year there was so much duff on the ground that the petioles of the leaves grew really long. The plants definitely looked healthy this year after the spring burn than they did last year. What was really exciting was I had my first flowering plant this year in row 7 position 44! Below is a picture of that flowering plant, and one of everyone measuring at Hegg.


Also, thank you to everyone in the town hall for being so hospitable to my dad, Oscar, and me. We had a great week and except my weird heat rash (it eventually went away) it was a lot of fun. Best of luck with the final push at the end of the season!
Regards,
Jennifer, Oscar, and John

I thought I would spend some time comparing the 2006 and 2007 measuring of the plants at Hegg Lake. The Hegg Lake common garden is located on Minnesota DNR land and is approximately a 7.5 mile drive from the main common garden. In May 2006 3,941 seedlings were planted at Hegg Lake after they were first germinated and grown in a green house at the Chicago Botanic Garden. To learn more about this large seedling growth experiment read this description.

Measuring plants:
In both years we counted the number of leaves and measured the longest leaf. However, this year we also recorded insects and any herbivory damage on the plants. The average tallest leaf of the living plants was 6.4 cm in 2006 and 13.7 cm in 2007.
“Can’t finds��? and mortality estimates between years:
When we are measuring plants and can’t find a plant we don’t assume the plant is dead. Instead the measurer records that the plant is a “can’t find��? and places a flag in the position he/she was searching. Later we have a different person come back and searches for the plant so that two pairs of eye look for every “can’t find��? plant. In 2006 we had approximately 21% of the plants were found by the second person who went back and searched for the “can’t find��? plants. Our overall estimate for mortality in the plants first year of growth was around 6% with 243 plants that were “can’t finds��? after two people searched for the plant.
This year we have just started having the second person go back and search for “can’t find��? plants. We have a total of 698 plants that were not found by the originally measurer. This puts the mortality estimate at 17.7% plants (cumulative) however I feel this percentage will drop significant after the second person rechecks the “can’t finds��?.
One interesting note is there were 30 plants found by the originally measurer this year that were not found by EITHER person who searched for the plant in 2006. Therefore, in 2006 there were really (at most) 213 plants that died making the currently mortality estimate for 2006 at 5%.
Here’s a photo of the measurers and datatakers at the Hegg Lake common Garden on July 26th.

(L to R) Kneeling: Amy, Amy, Jennifer. Standing: Gretel, Ian, Andy, Ruth, Julie, Josh, Rachel, Colin, Jameson. Photo by Stuart–he measured too.
The weather for measuring turned out to be much nicer than predicted: Temp 85 degrees F; dewpoint: 70 degrees F; mostly cloudy with a W wind at 13 mph. It started raining, so we packed up to leave. As we were walking out the rain stopped, so we paused to take this photo. After the photo, it started to rain again.
We measured plants efficiently. Most plants have two leaves and the longest is 8-19 cm tall. It can be very difficult to find a plant because the thick grass is about 50 cm high. The only way to find it is to measure from another Echinacea plant. The ~4000 plants are spaced on 1m apart on a 80m x 50m grid. That can seem like a vast distance between plants. Jennifer made measuring sticks 2 meters long to help us stay on line and find the plants. After finding two plants you could keep on line fairly well and go fast. If there was a missing plant or a particularly sneaky plant, then it was very easy to get disoriented. Some folks worked in pairs (one measuring, one taking data); others solo. Here’s a photos of folks at work…

|
|